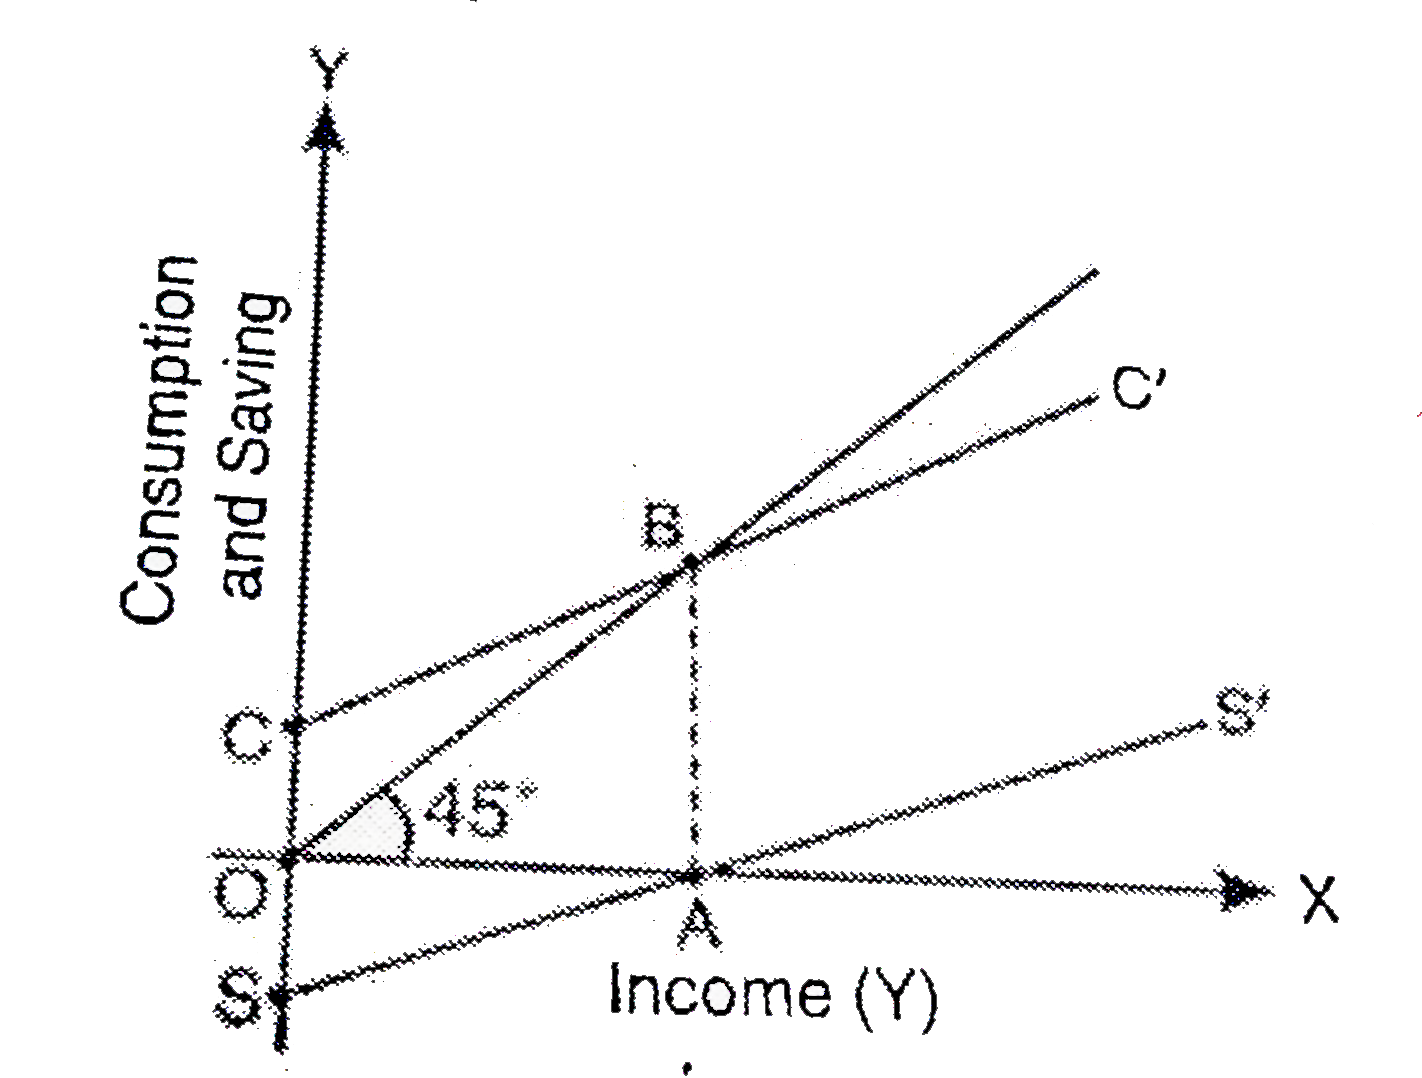
Draw a straight line consumption curve. From it derive a saving curve. Explain the process of derivation. Show in this diagram : (a) The point at which the Average propensity to Consume is equal to one: (b) Any point at which the Average Propensity to Save in negative.
Hint : Refer 'Derivation of Saving Curve from Consumption Curve'.
Step by step video & image solution for Draw a straight line consumption curve. From it derive a saving curve. Explain the process of derivation. Show in this diagram : (a) The point at which the Average propensity to Consume is equal to one: (b) Any point at which the Average Propensity to Save in negative. Hint : Refer 'Derivation of Saving Curve from Consumption Curve'. by Economics experts to help you in doubts & scoring excellent marks in Class 12 exams.
Updated on:21/07/2023Topper's Solved these Questions
- AGGREGATE DEMAND AND RELATED CONCEPTS Book:SANDEEP GARGChapter:AGGREGATE DEMAND AND RELATED CONCEPTS Exercise:UNSOLVED PRACTICALS
Explore 25 Videos
- AGGREGATE DEMAND AND RELATED CONCEPTS Book:SANDEEP GARGChapter:AGGREGATE DEMAND AND RELATED CONCEPTS Exercise:SHORT ANSWER TYPE QUESTIONS
Explore 23 Videos
- FOREIGN EXCHANGE RATE Book:SANDEEP GARGChapter: FOREIGN EXCHANGE RATE Exercise:REVISION EXERCISE
Explore 12 Videos
- BALANCE OF PAYMENTSBook:SANDEEP GARGChapter:BALANCE OF PAYMENTSExercise:LONG ANSWER TYPE QUESTIONS
Explore 6 Videos
Similar Questions
Given consumption curve , derive saving curve and state the steps taken in the process of derivation use diagram.
View SolutionDraw on a diagram a straight line savings curve for an economy. From it derive the consumption curve, explaining the method of derivation. Show a point on the consumption curve at which average propensity to consume is equal to 1.
View Solution
Knowledge Check
Average Propensity to Consume is …….at point B and Average Propensity to Save is ……..at point A.
 A0, 1B1, 0C1, 1D0, 0
Outline the steps taken in deriving saving curve from the consumption curve. Use diagram.
View SolutionExplain the relationship between average propensity to consume and average propensity to save.
Which of these can have a negative value and when ?
View SolutionExplain steps taken in derivation curve from saving curve from use diagam .
View SolutionDraw consumption curve and saving curve in a single diagram and mark the 'break-even point'.
View SolutionDraw consumption curve and saving curve in a single diagram and mark the 'break -even point'
View SolutionOutline the steps taken in deriving Consumption Curve from the Saving Curve. Use diagram.
View SolutionOutline the steps taken in deriving Consumption Curve from Saving Curve. Use diagram.
View Solution