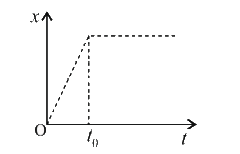
Figure shows the position-time graph of a particle moving on the X--axis. Which of these option correctly describes the particle 's motion?
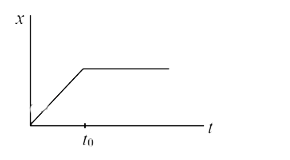
the particle is continuously going in positive x direction
the particle is at rest
the velocity increases up to a time and then becomes constant
the particle moves at a constant velocity up to a time and then stops
The correct Answer is:D
Slope of x-t graph gives velocity . Slope is +ve constant till t0 and then it is zero
Similar Questions
Knowledge Check
Figure show the displacement - time graph of a particle moving on the x-axis
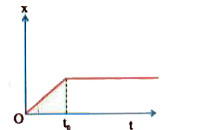 Athe particle is continuously going in positive X directionBthe particle is at restCthe velocity increases up to a time t0 and then becomes constant.Dthe particle moves at constant velocity up to a time t0 and then stops.
Figure shows the position of a particle moving on the X-axis as a function of time.
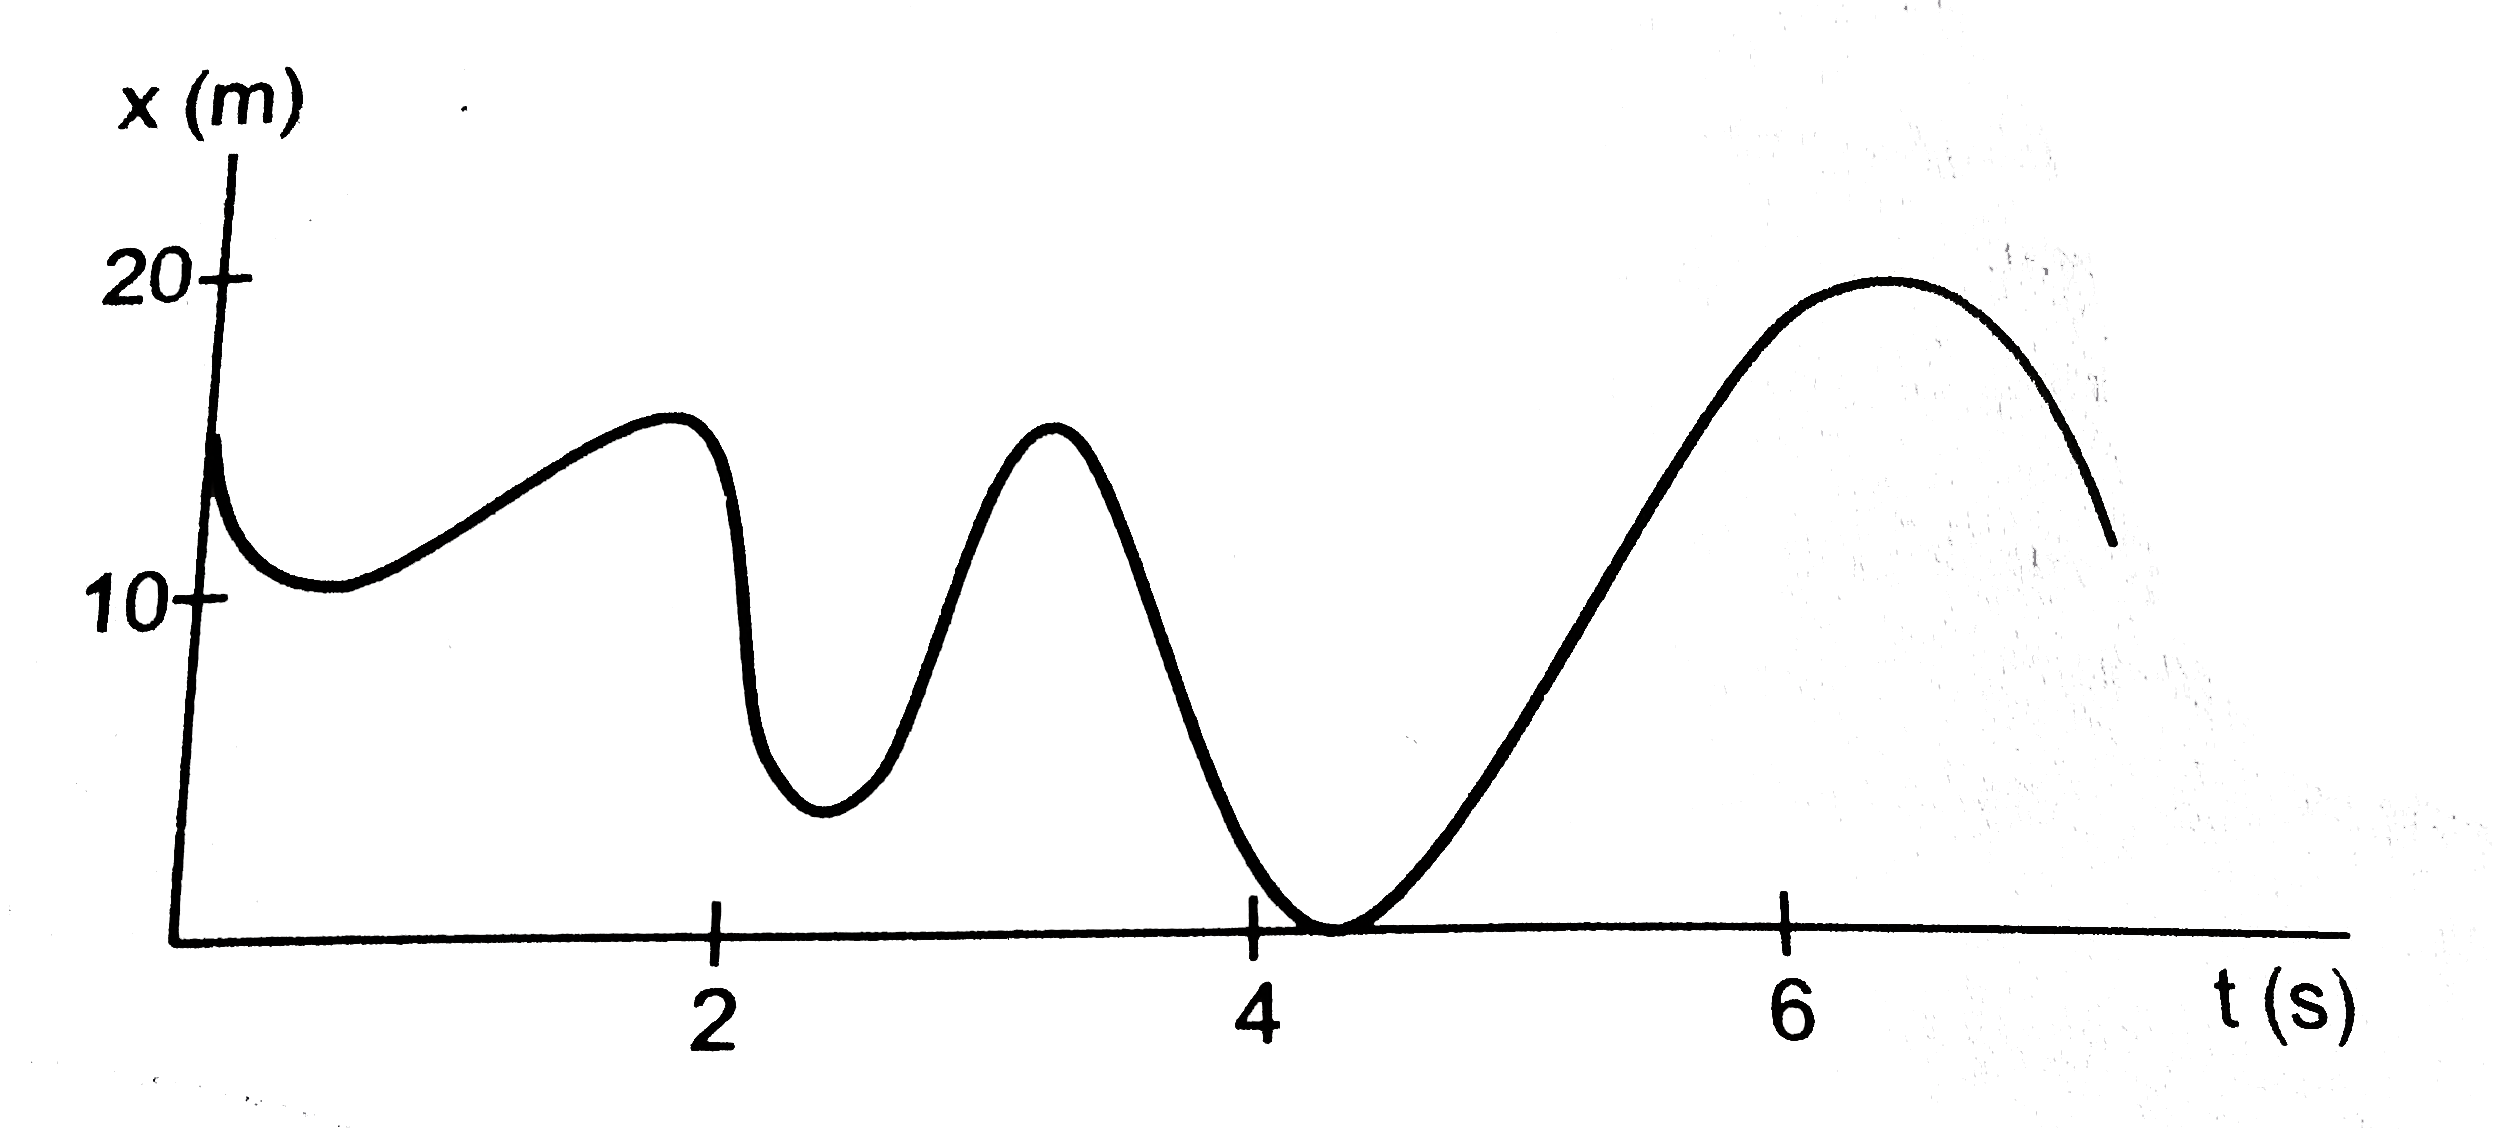 AThe particle has come to rest 6 timesBThe maximum speed is at t=6 s.CThe velocity remains positive for t=0 to t=6s.DThe average velocity for the total period shown is negative
Figure shows the position of a particle moving on the x - axis as a function of time
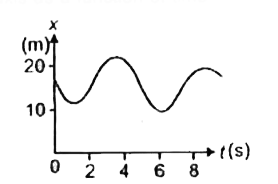 AThe particle has come to rest 4 timesBThe velocity at t = 8 s is negativeCThe velocity remains positive for t = 2 s to t = 6 sDThe particle moves with constant velocity.
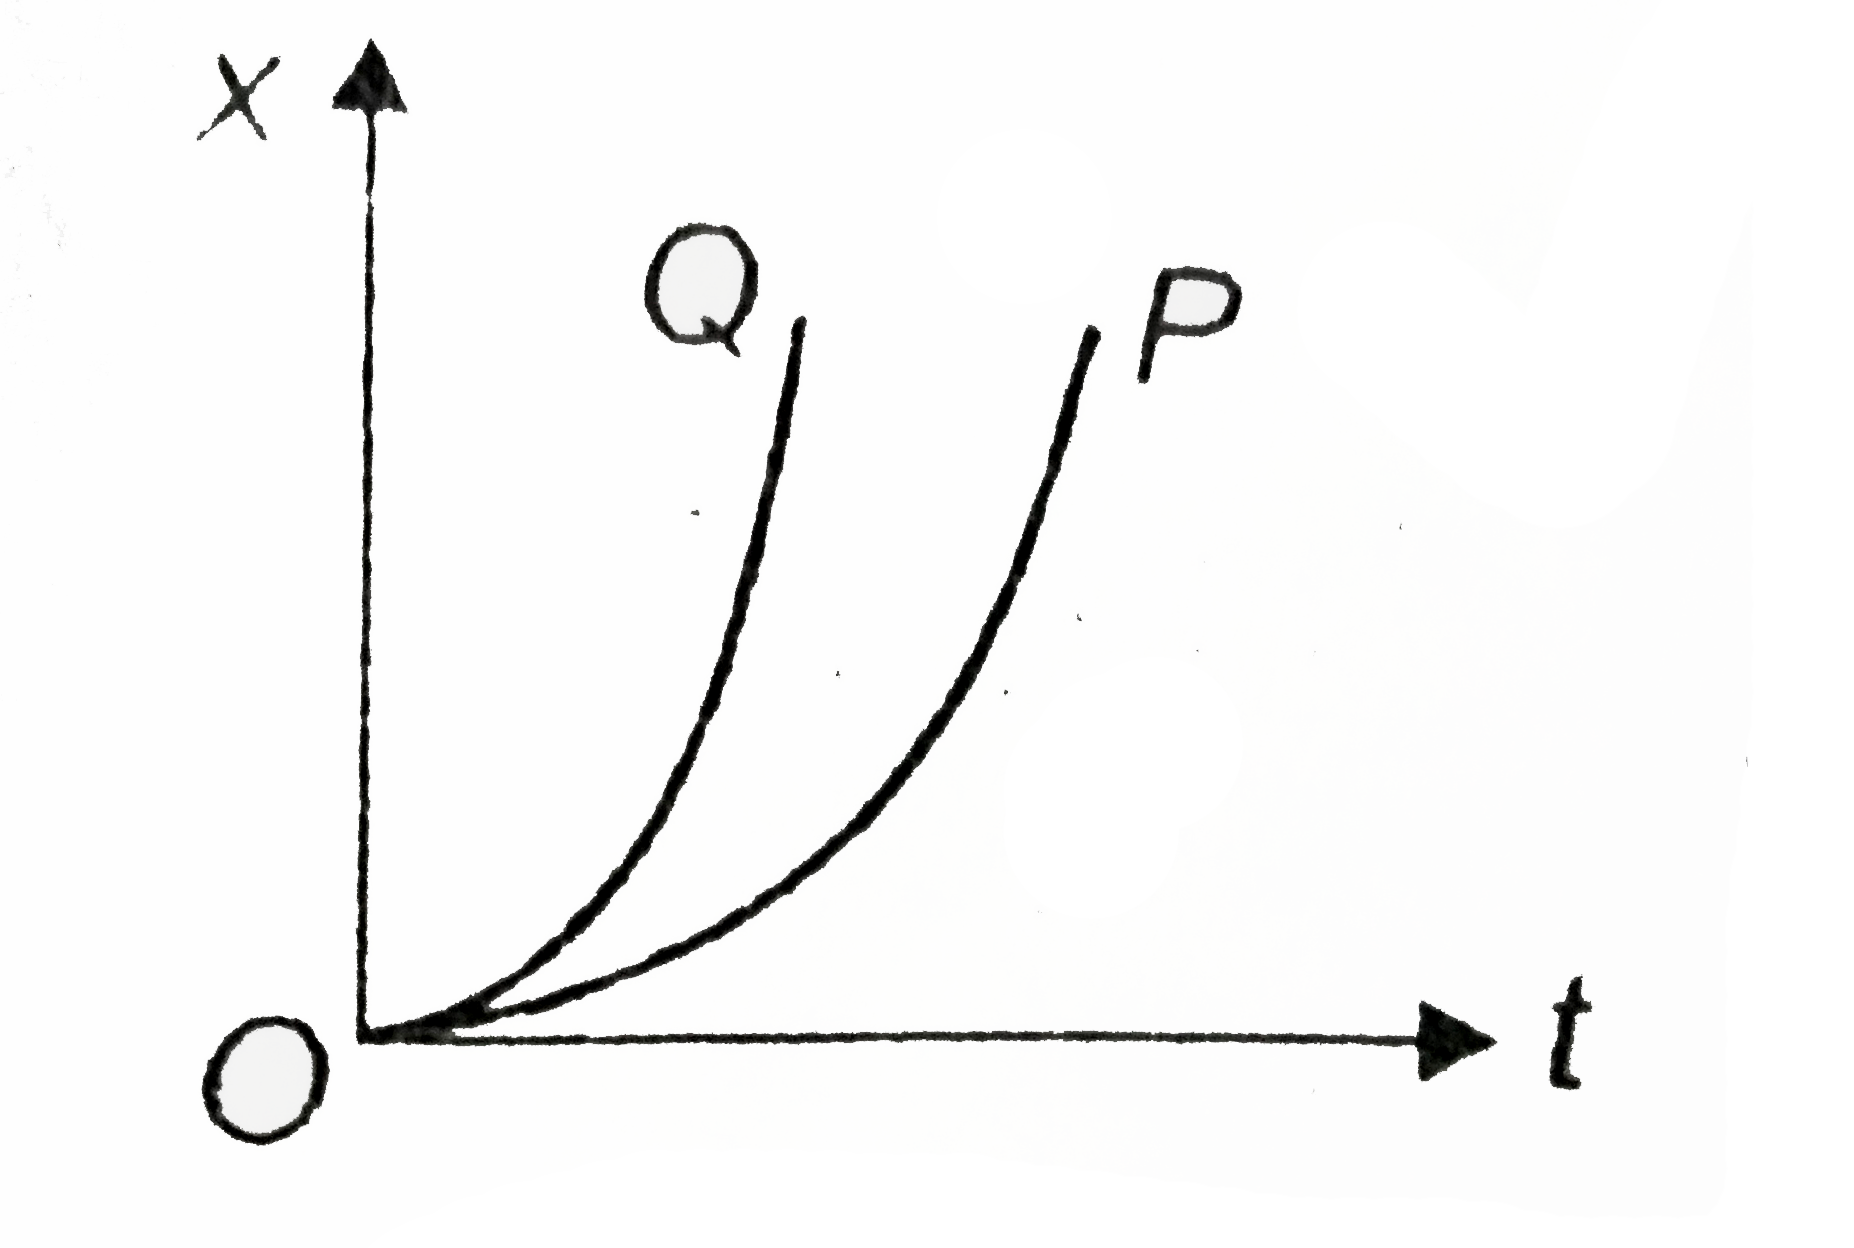
The position-time graph for two particles P and Q moving on x-axis is shown in the figure. Then
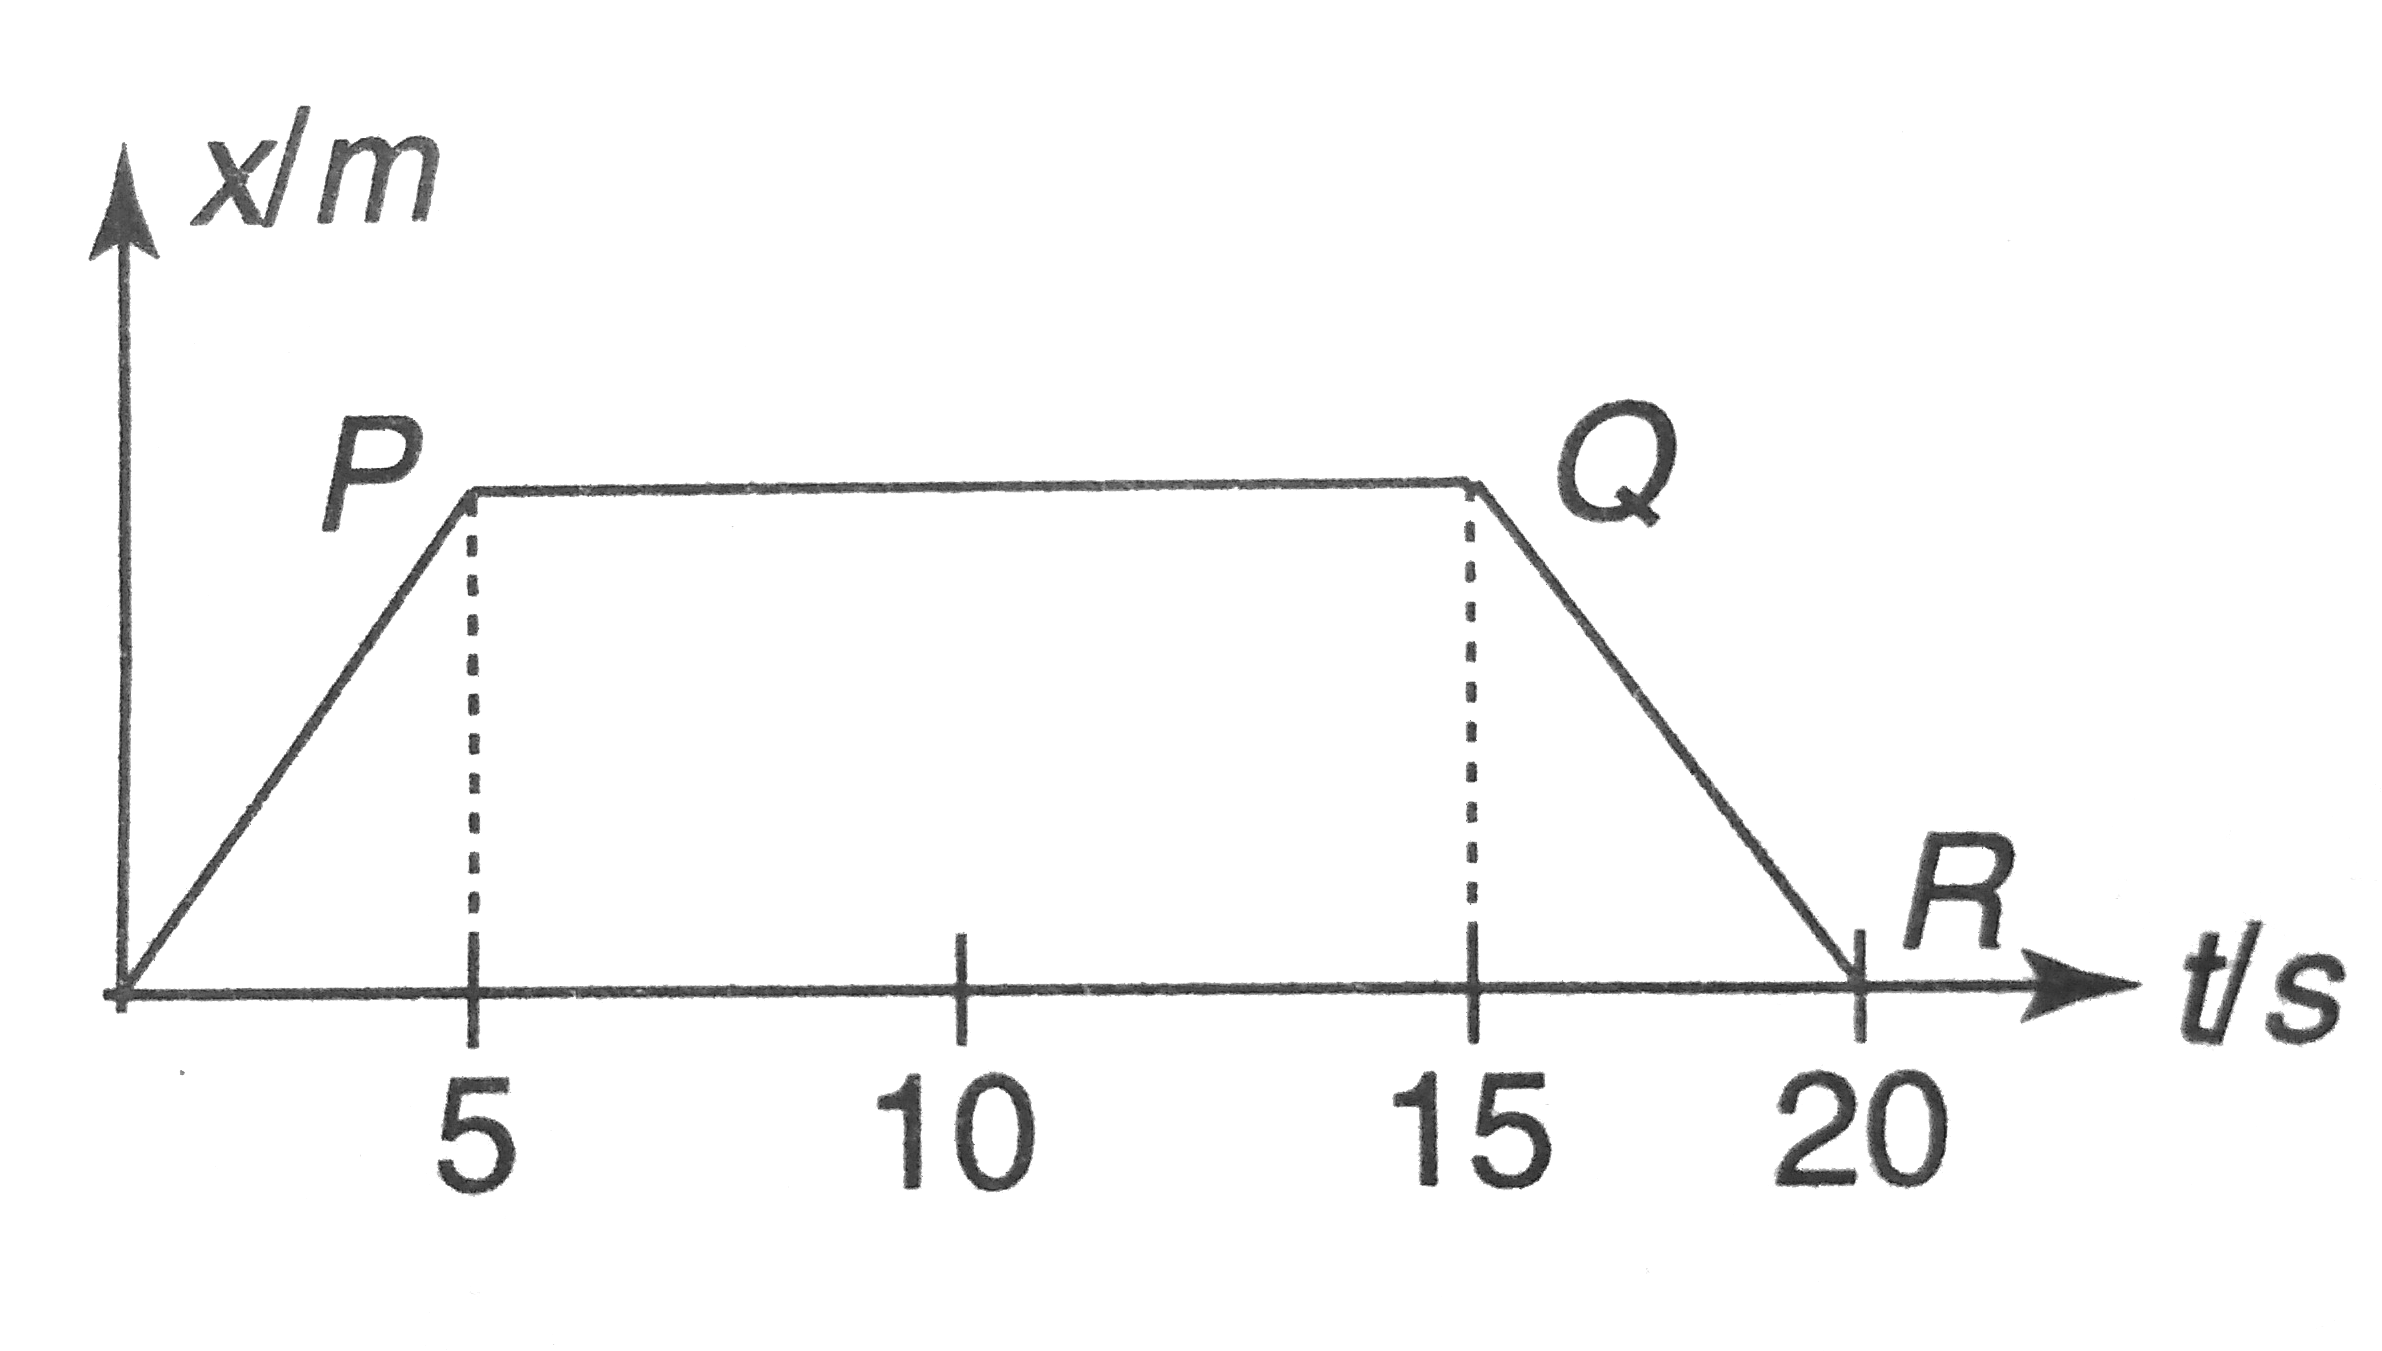
View SolutionFigure shows the position the graph for a particle in one dimensional motion. Which of the graphs in fugure represent the variation in the velocity of the particle with time ?
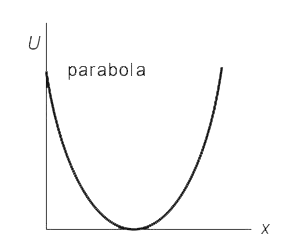
View SolutionThe first graph shows the potential energy U(x) for a particle moving on the x axis. Which of the other four graphs correctly gives the force F exerted on the particle?
View SolutionThe figure shows a velocity-time graph of a particle moving along a straight line
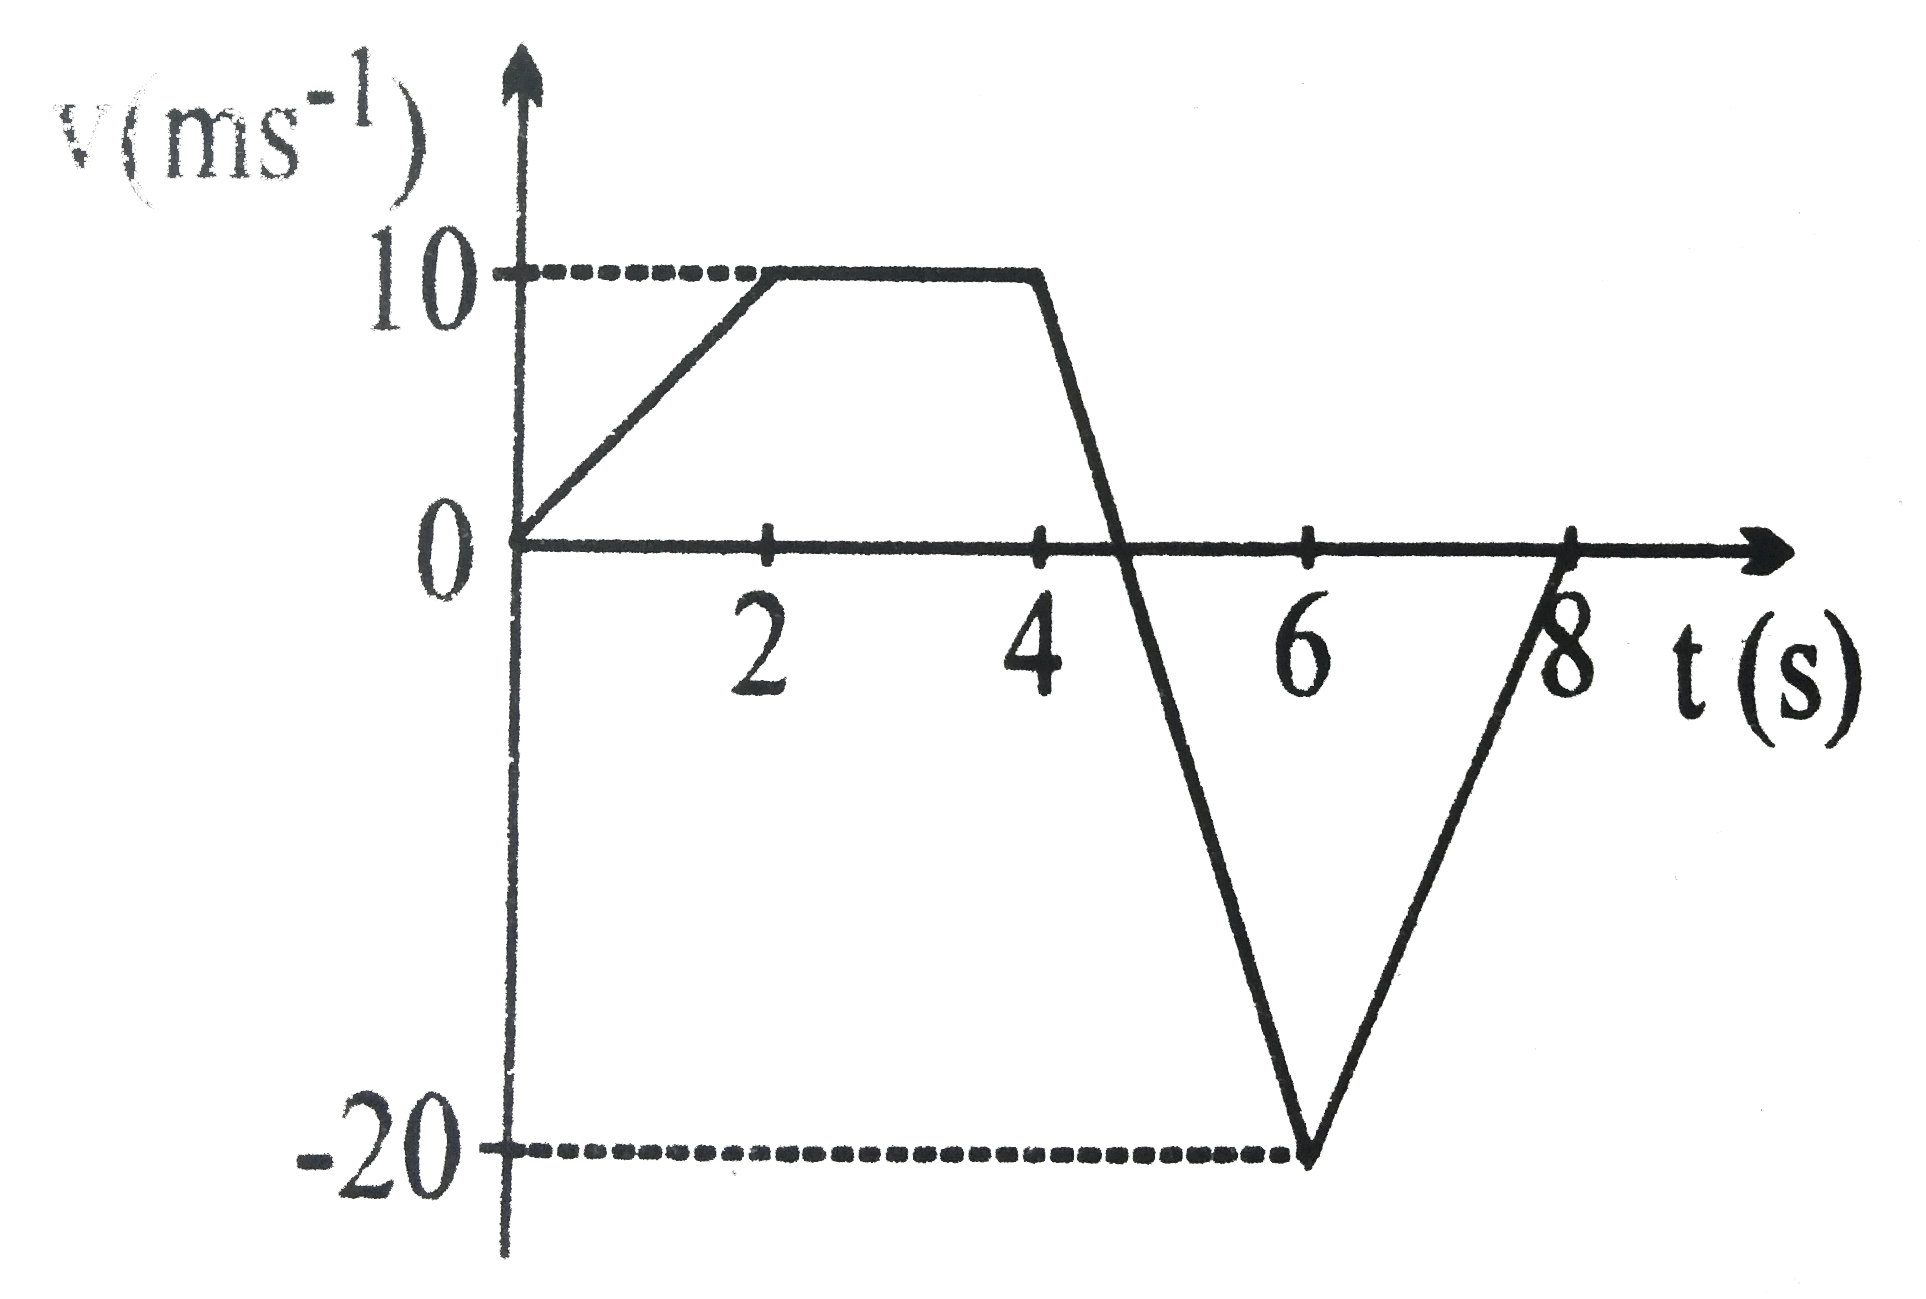
Choose the incorrect statement. The particle comes to rest at
View SolutionThe figure shows a velocity-time graph of a particle moving along a straight line
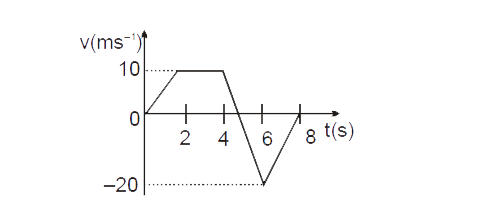
Choose the incorrect statement. The particle comes to rest at
View Solution


