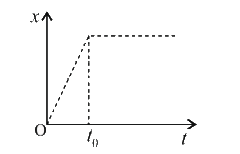
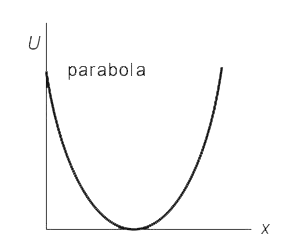
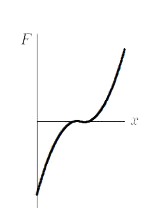
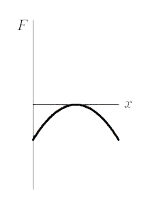
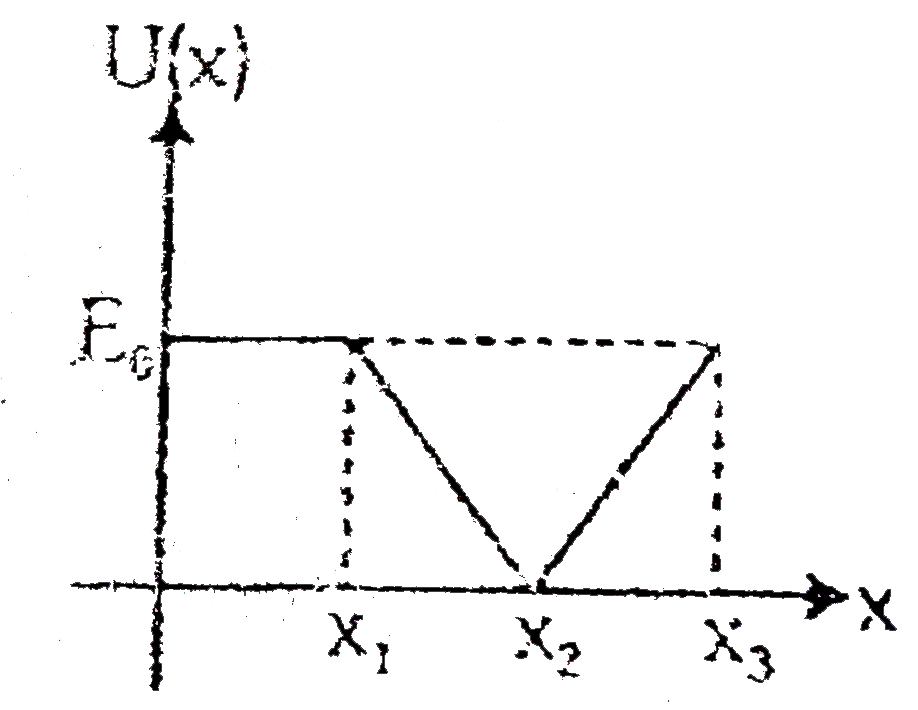
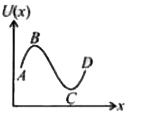
The first graph shows the potential energy for a particle moving on the x axis. Which of the other four graphs correctly gives the force F exerted on the particle?
A
B
C
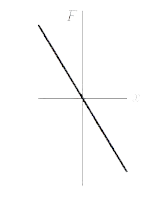
D
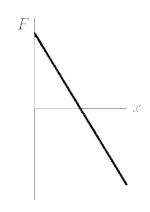
Video Solution
Text Solution
The correct Answer is:D
|
Similar Questions
Knowledge Check
Figure shows the position-time graph of a particle moving on the X--axis. Which of these option correctly describes the particle 's motion?
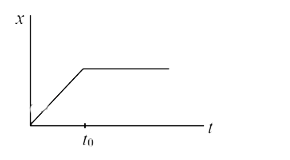 Athe particle is continuously going in positive x directionBthe particle is at restCthe velocity increases up to a time and then becomes constantDthe particle moves at a constant velocity up to a time and then stops
Figure show the displacement - time graph of a particle moving on the x-axis
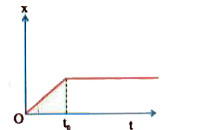 Athe particle is continuously going in positive X directionBthe particle is at restCthe velocity increases up to a time t0 and then becomes constant.Dthe particle moves at constant velocity up to a time t0 and then stops.
The potential energy U(x) of a particle moving along x−axis is shown in figure. Which one of the following graphs represents the variation of kinetic energy of this particel if its total mechanical enery is E0
 A
A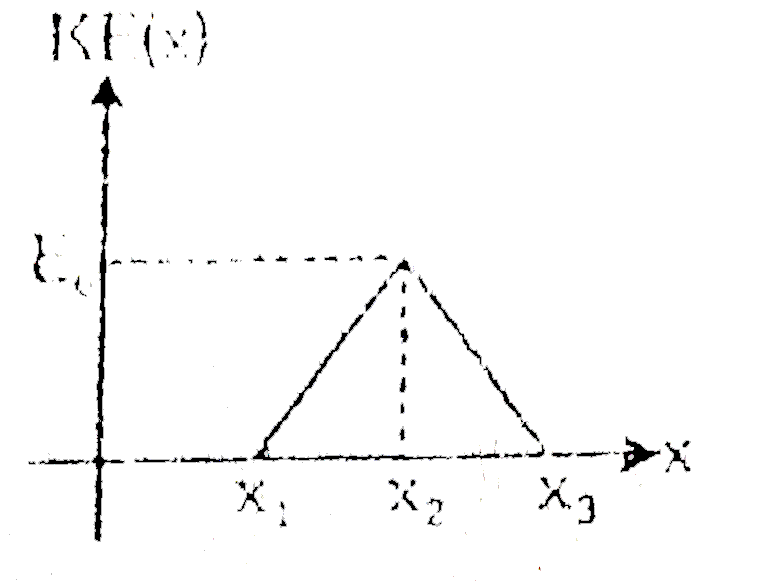 B
B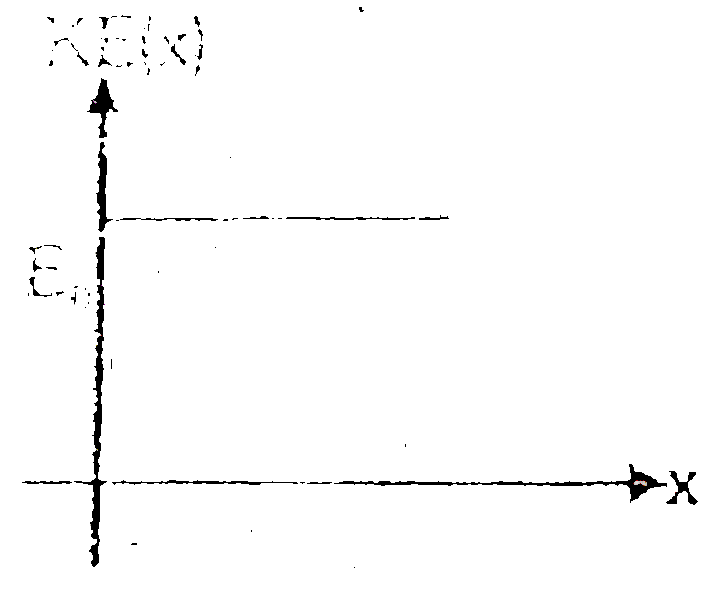 C
C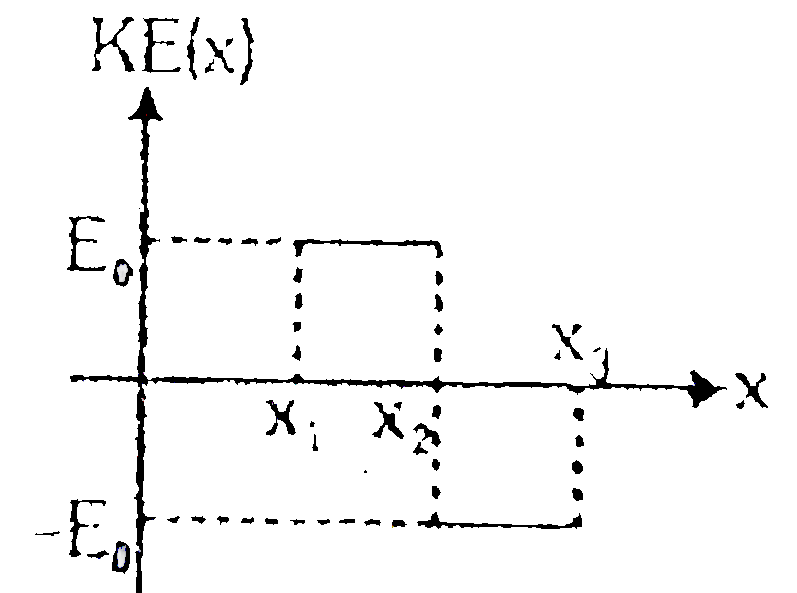 D
D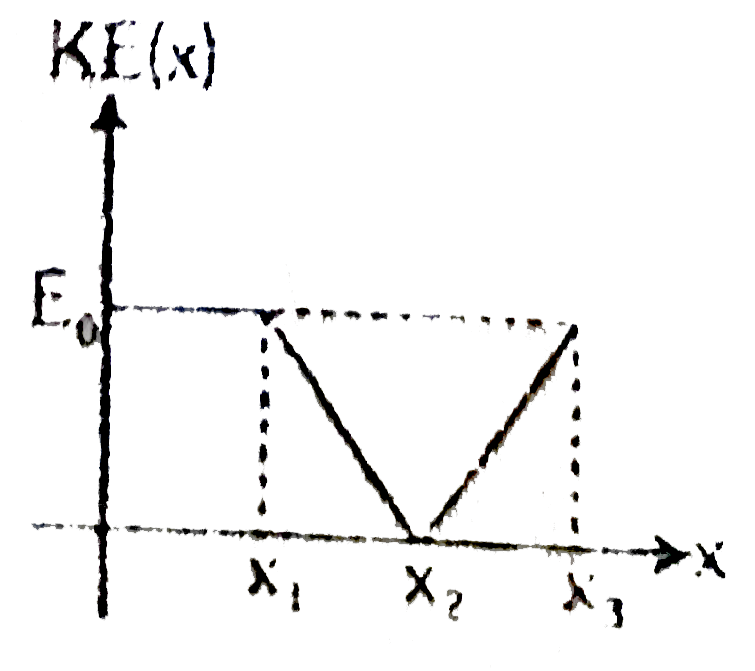
Figure shows the velocity of a particle moving on x-axis.
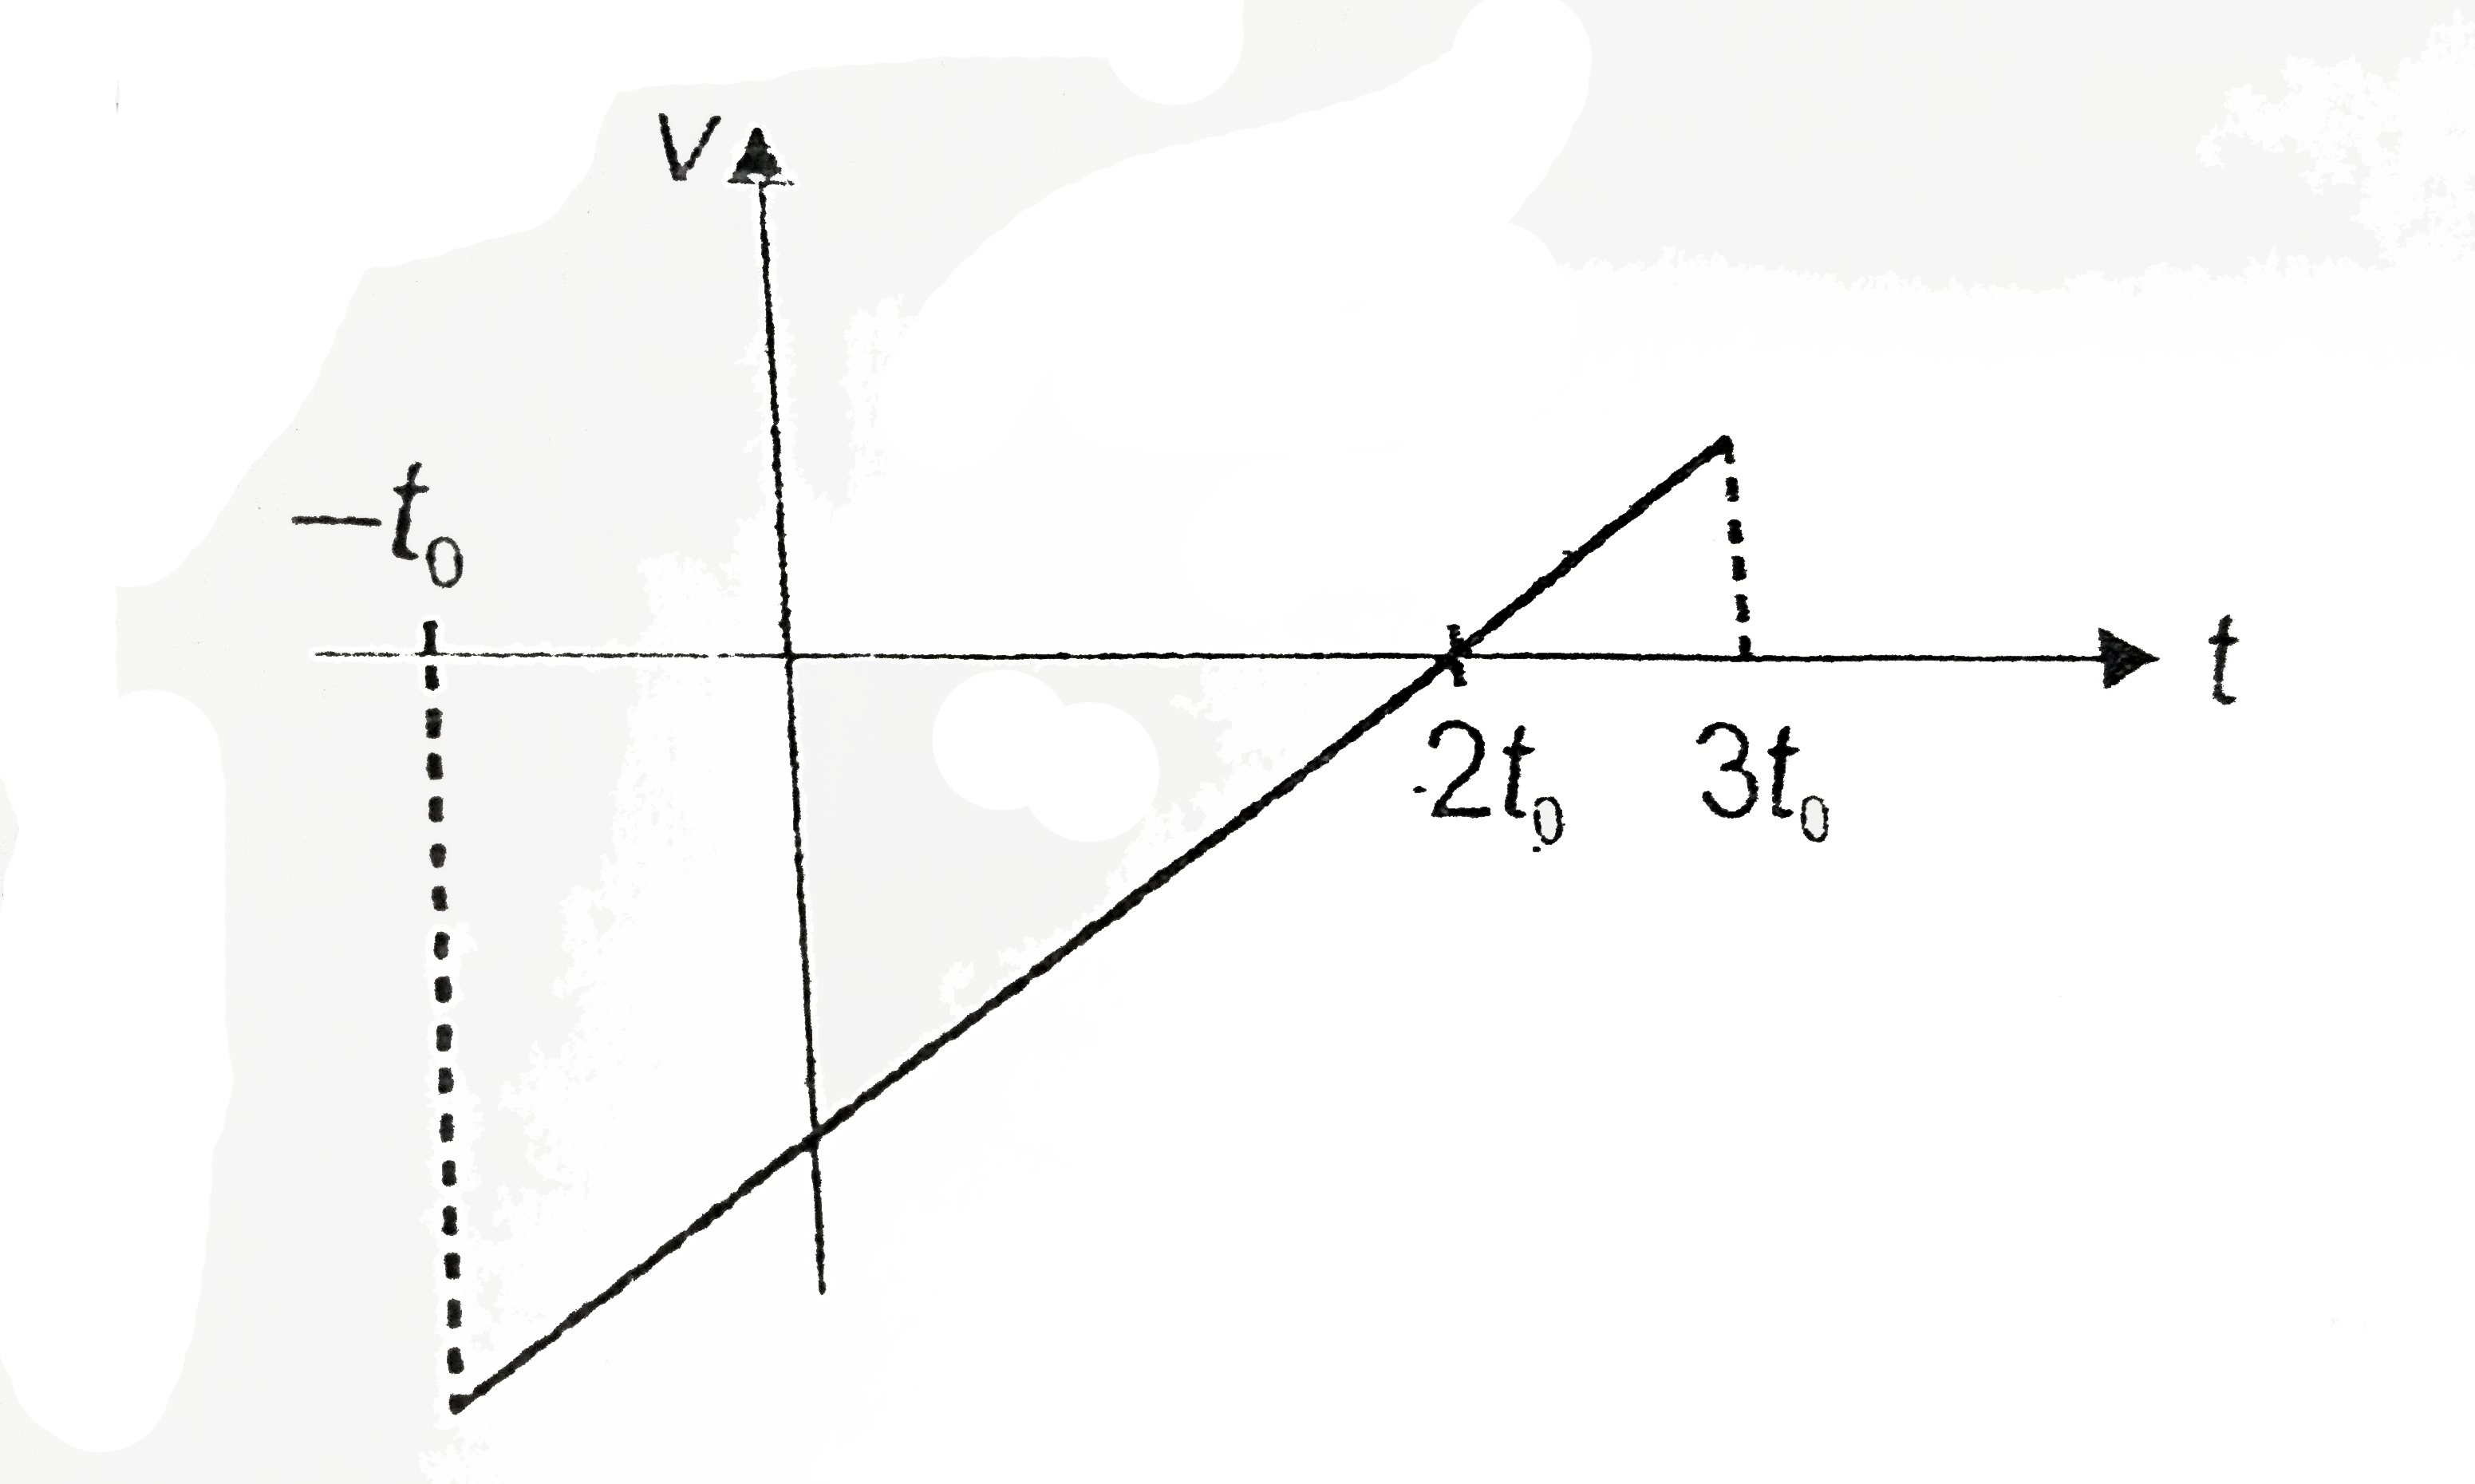
Which of the following statement is correct for the interval shown in graph?
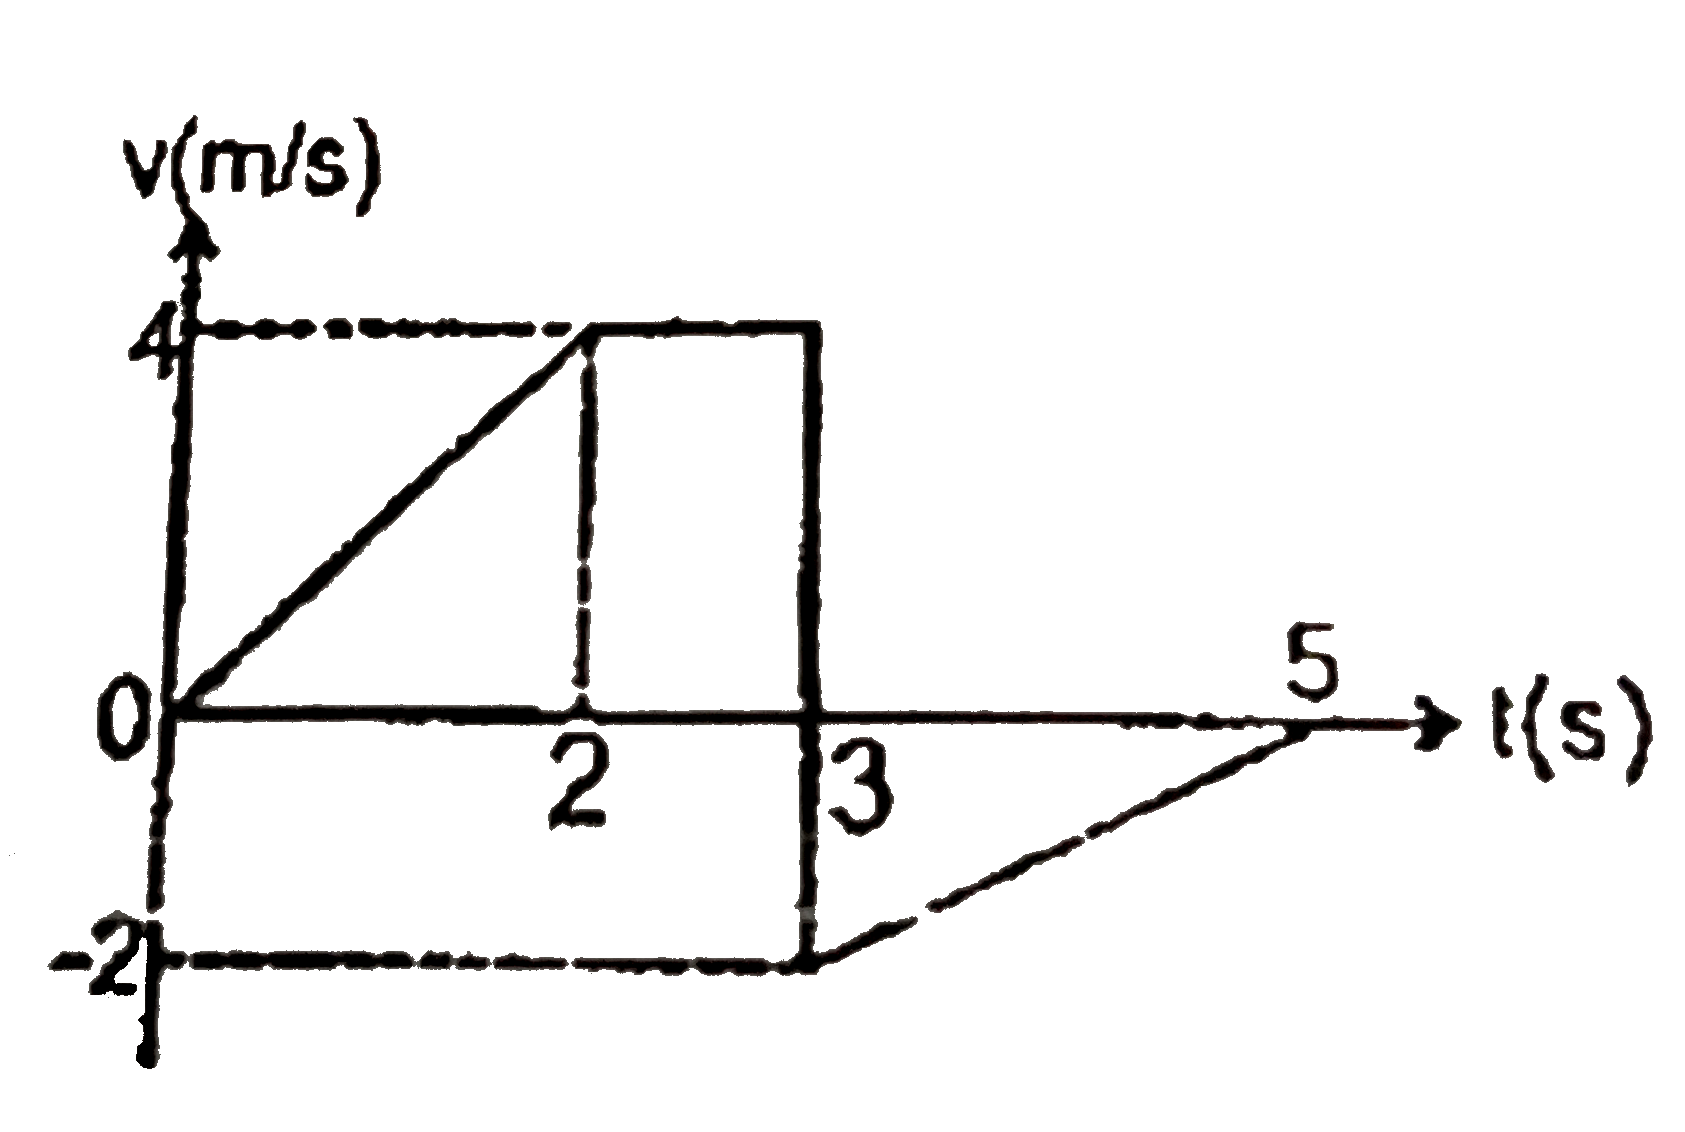
View SolutionFor a particle moving along x-axis, velocity-time graph is as shown in figure. Find the displacement of the particle?
View SolutionFigure shows a plot of the potential energy as a function of x for a particle moving along the x-axis. Which of the following statement(s) is/are true?
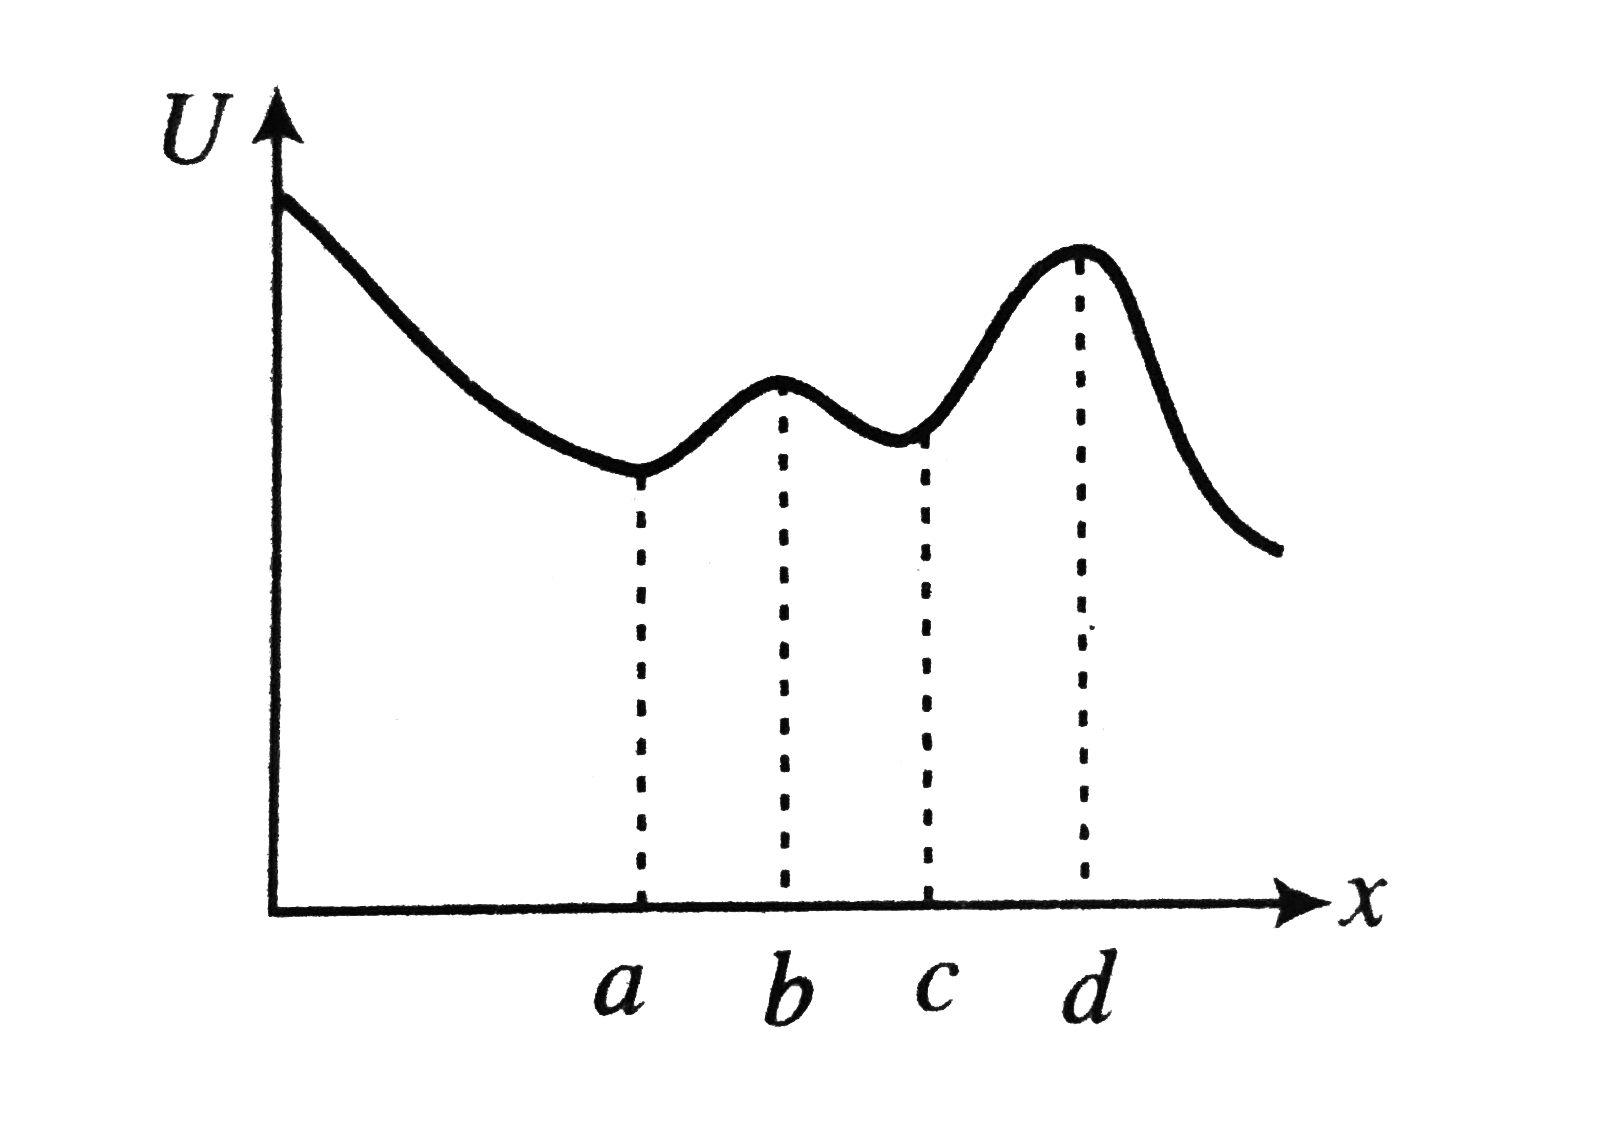
View SolutionThe potential energy of a particle varies with distance x as shown in the graph. The force acting on the particle is zero at
View SolutionThe potential energy of a particle varies with distance x as shown in the graph. The force acting on the particle is zero at

View Solution


