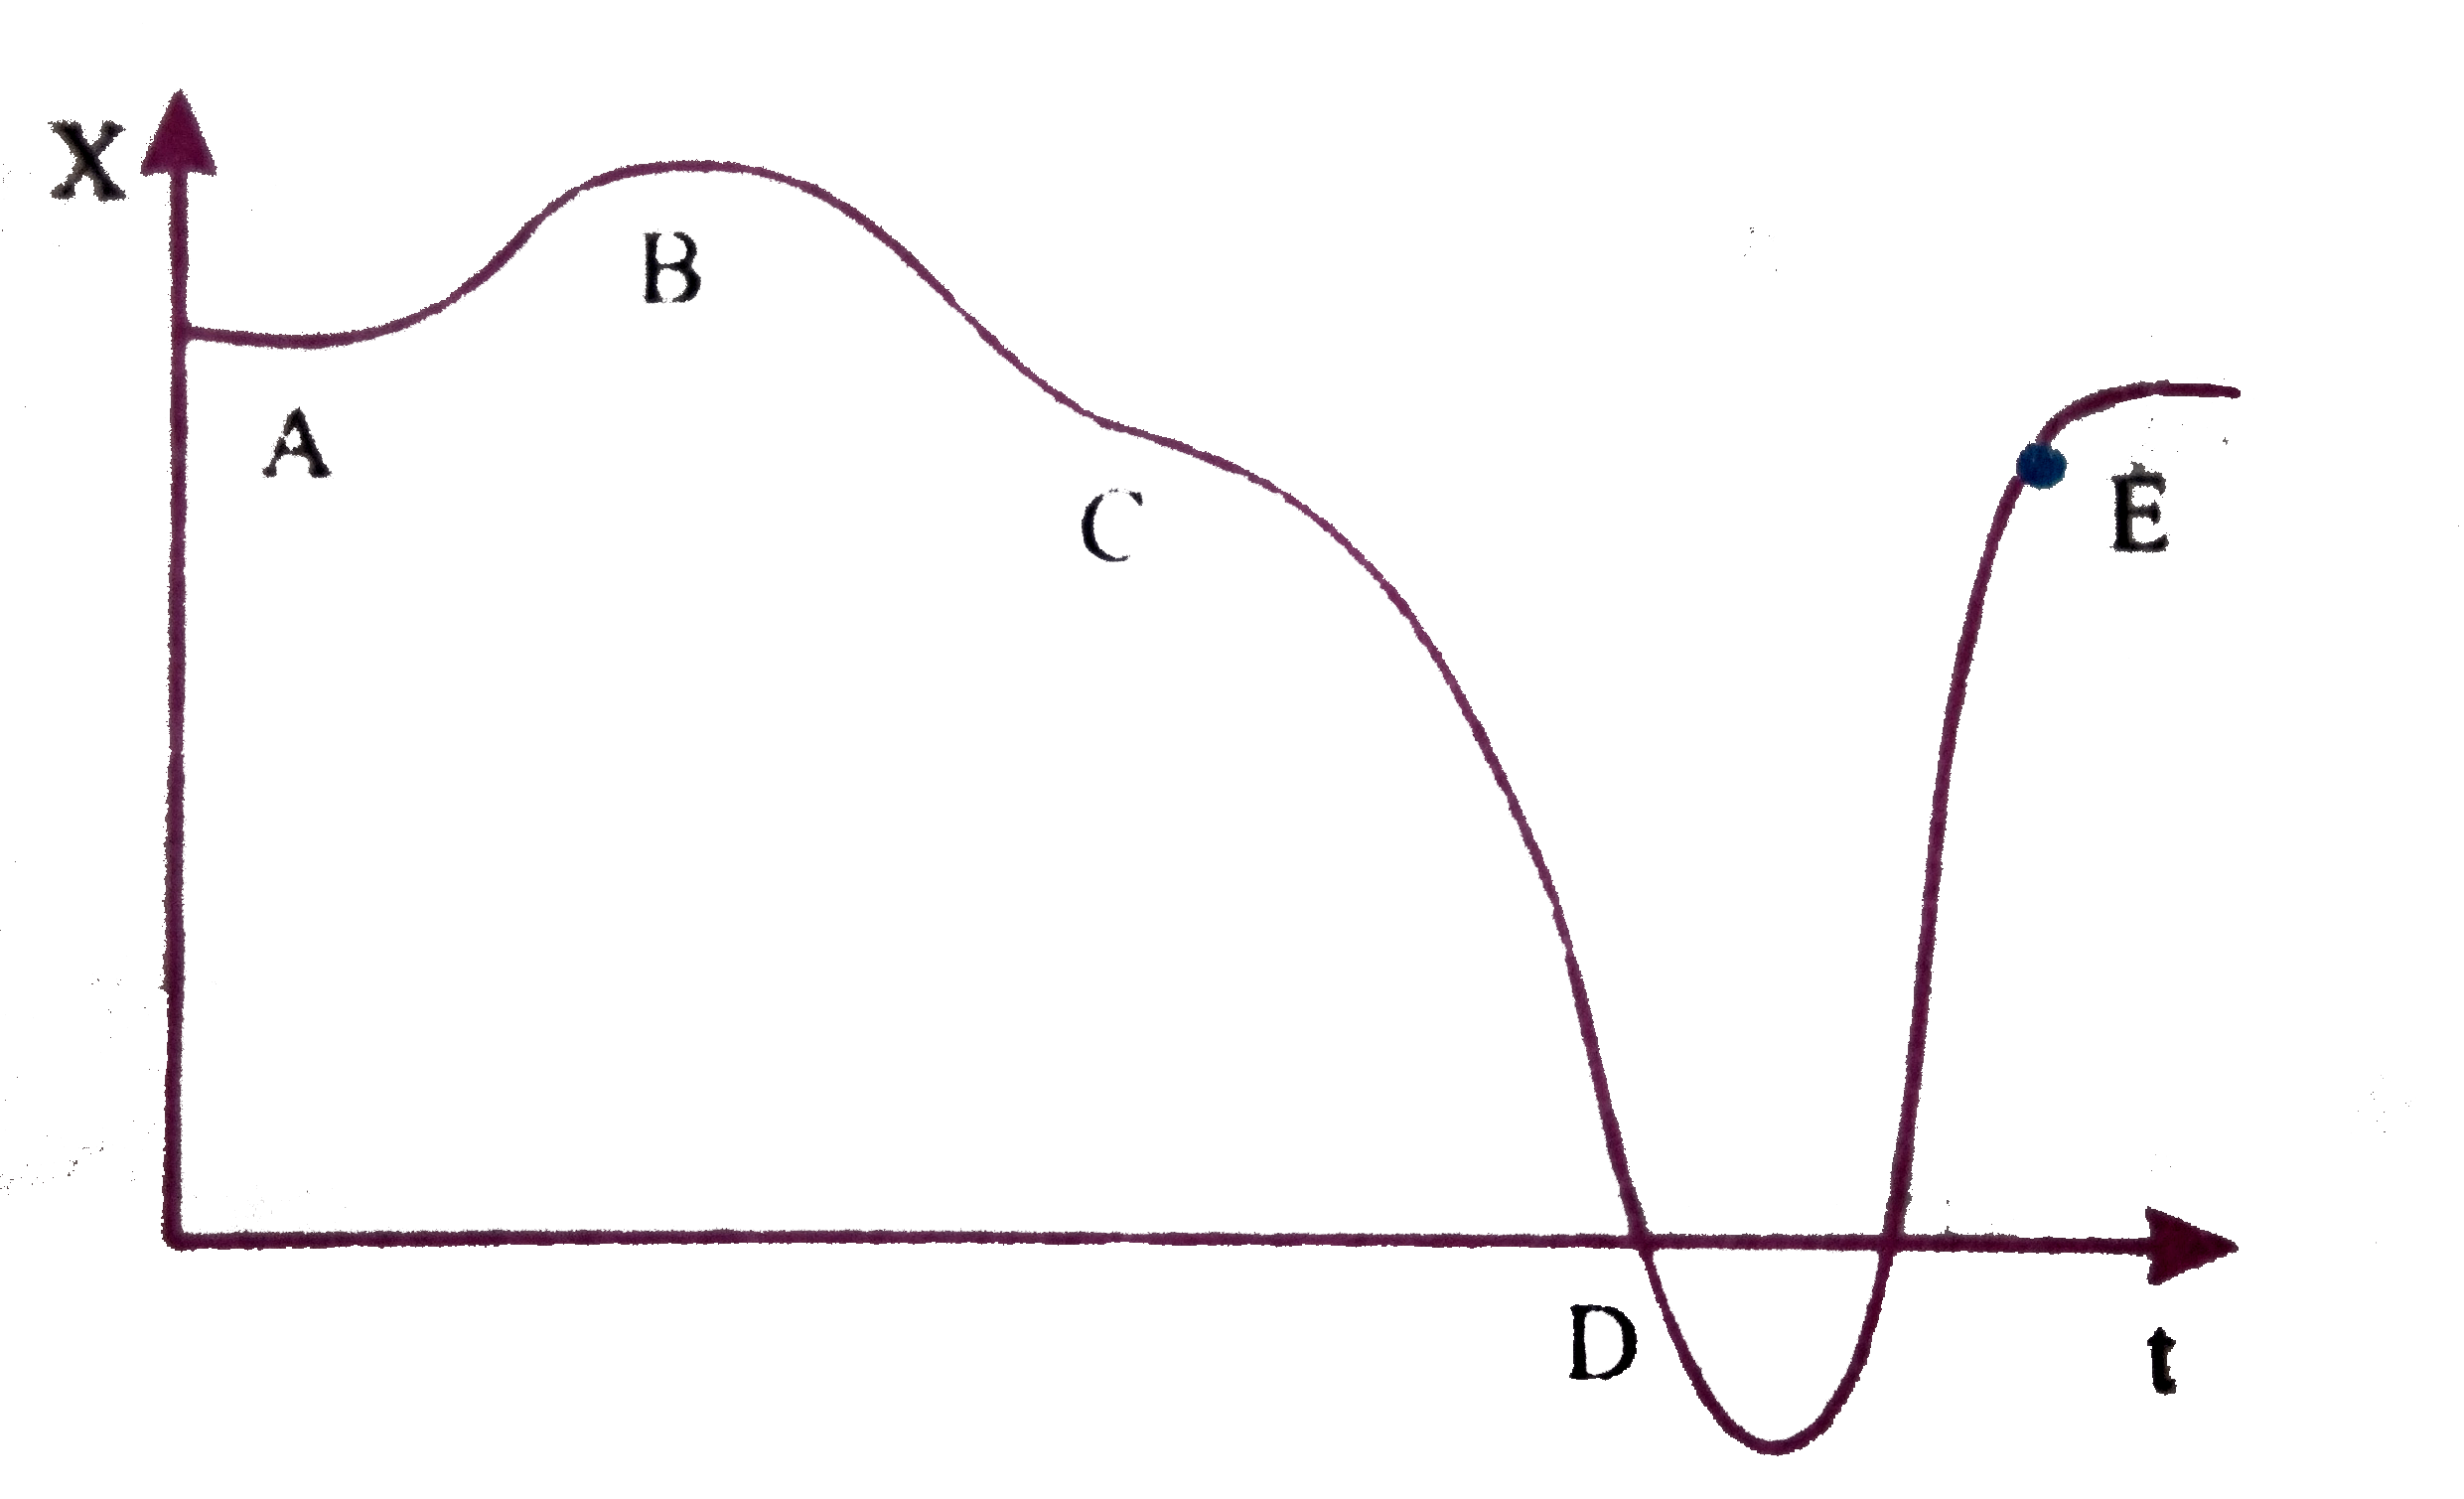
A graph of x versus t is shown in figure. Choose correct alternative from below.
The particle was released from rest at t=0
At B, the acceleration a>0
Average velocity a>0
The speed at D exceeds that at E
The correct Answer is:A, C, D
As per the diagram, at point A the graph is parallel to time axis hence, v=dxdt=0. As the starting point is A hence, we can say that the particle is starting from rest.
At C, the graph changes slope, hence, velocity also changes. As graph c is almost parallel to time axis hence, we can say that velocity vanishes.
As direction of acceleration changes hence, we can say that it may be zero in between.
From the graph it is clear that
|slope at D|>|slope at E|
Hence, speed at D will be more than at E.
Topper's Solved these Questions
- MOTION IN A STRAIGHT LINE Book:NCERT EXEMPLARChapter:MOTION IN A STRAIGHT LINE Exercise:Very Short Answer Type Qns
Explore 14 Videos
- MOTION IN A STRAIGHT LINE Book:NCERT EXEMPLARChapter:MOTION IN A STRAIGHT LINE Exercise:Very Short Answer Type Qns
Explore 14 Videos
- MOTION IN A PLANEBook:NCERT EXEMPLARChapter:MOTION IN A PLANEExercise:Multiple Choice Questions
Explore 37 Videos
- OSCILLATIONSBook:NCERT EXEMPLARChapter:OSCILLATIONSExercise:MULTIPLE CHOICE QUESTIONS (MCQs)
Explore 40 Videos
Similar Questions
Knowledge Check
A graph of x verus t is shown in the figure given below. Choose correct alternatives from below.
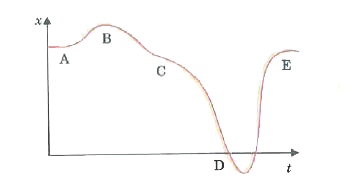 AThe particle was released from rest at t = 0 .BAt B, the acceleration a>0 .CAt C, the velocity and the acceleration vanish .DAverage velocity for the motion between A and D is positive .
A bar magnet is moved over a steel bar as shown in the figure.
Choose the correct alternative from the following
 AThe end x becomes north pole if 'p, is south pole whne moved from the end x to y.Bthe end y will become a south pole if p is south pole and moved from the end y to x.Cthe end x will be a south pole if 'p' is a south pole and moved from x to yDboth (B) and (c)
A bar magnet is moved over a steel bar as shown in the figure.
Choose the correct alternative from the following
 AThe end x becomes north pole if 'p' is south pole when moved from the end x to yBthe end y will become a south pole if p is a south pole and moved from the end y toxCthe end x will be a south pole if 'p' is a south pole and moved from x to yDBoth (b) and (c)
Circuit as shown in figure below, choose the correct statement

View SolutionThe heating curve of a paritcular substance in solid state is as shown in the figure .choose the correct alternative
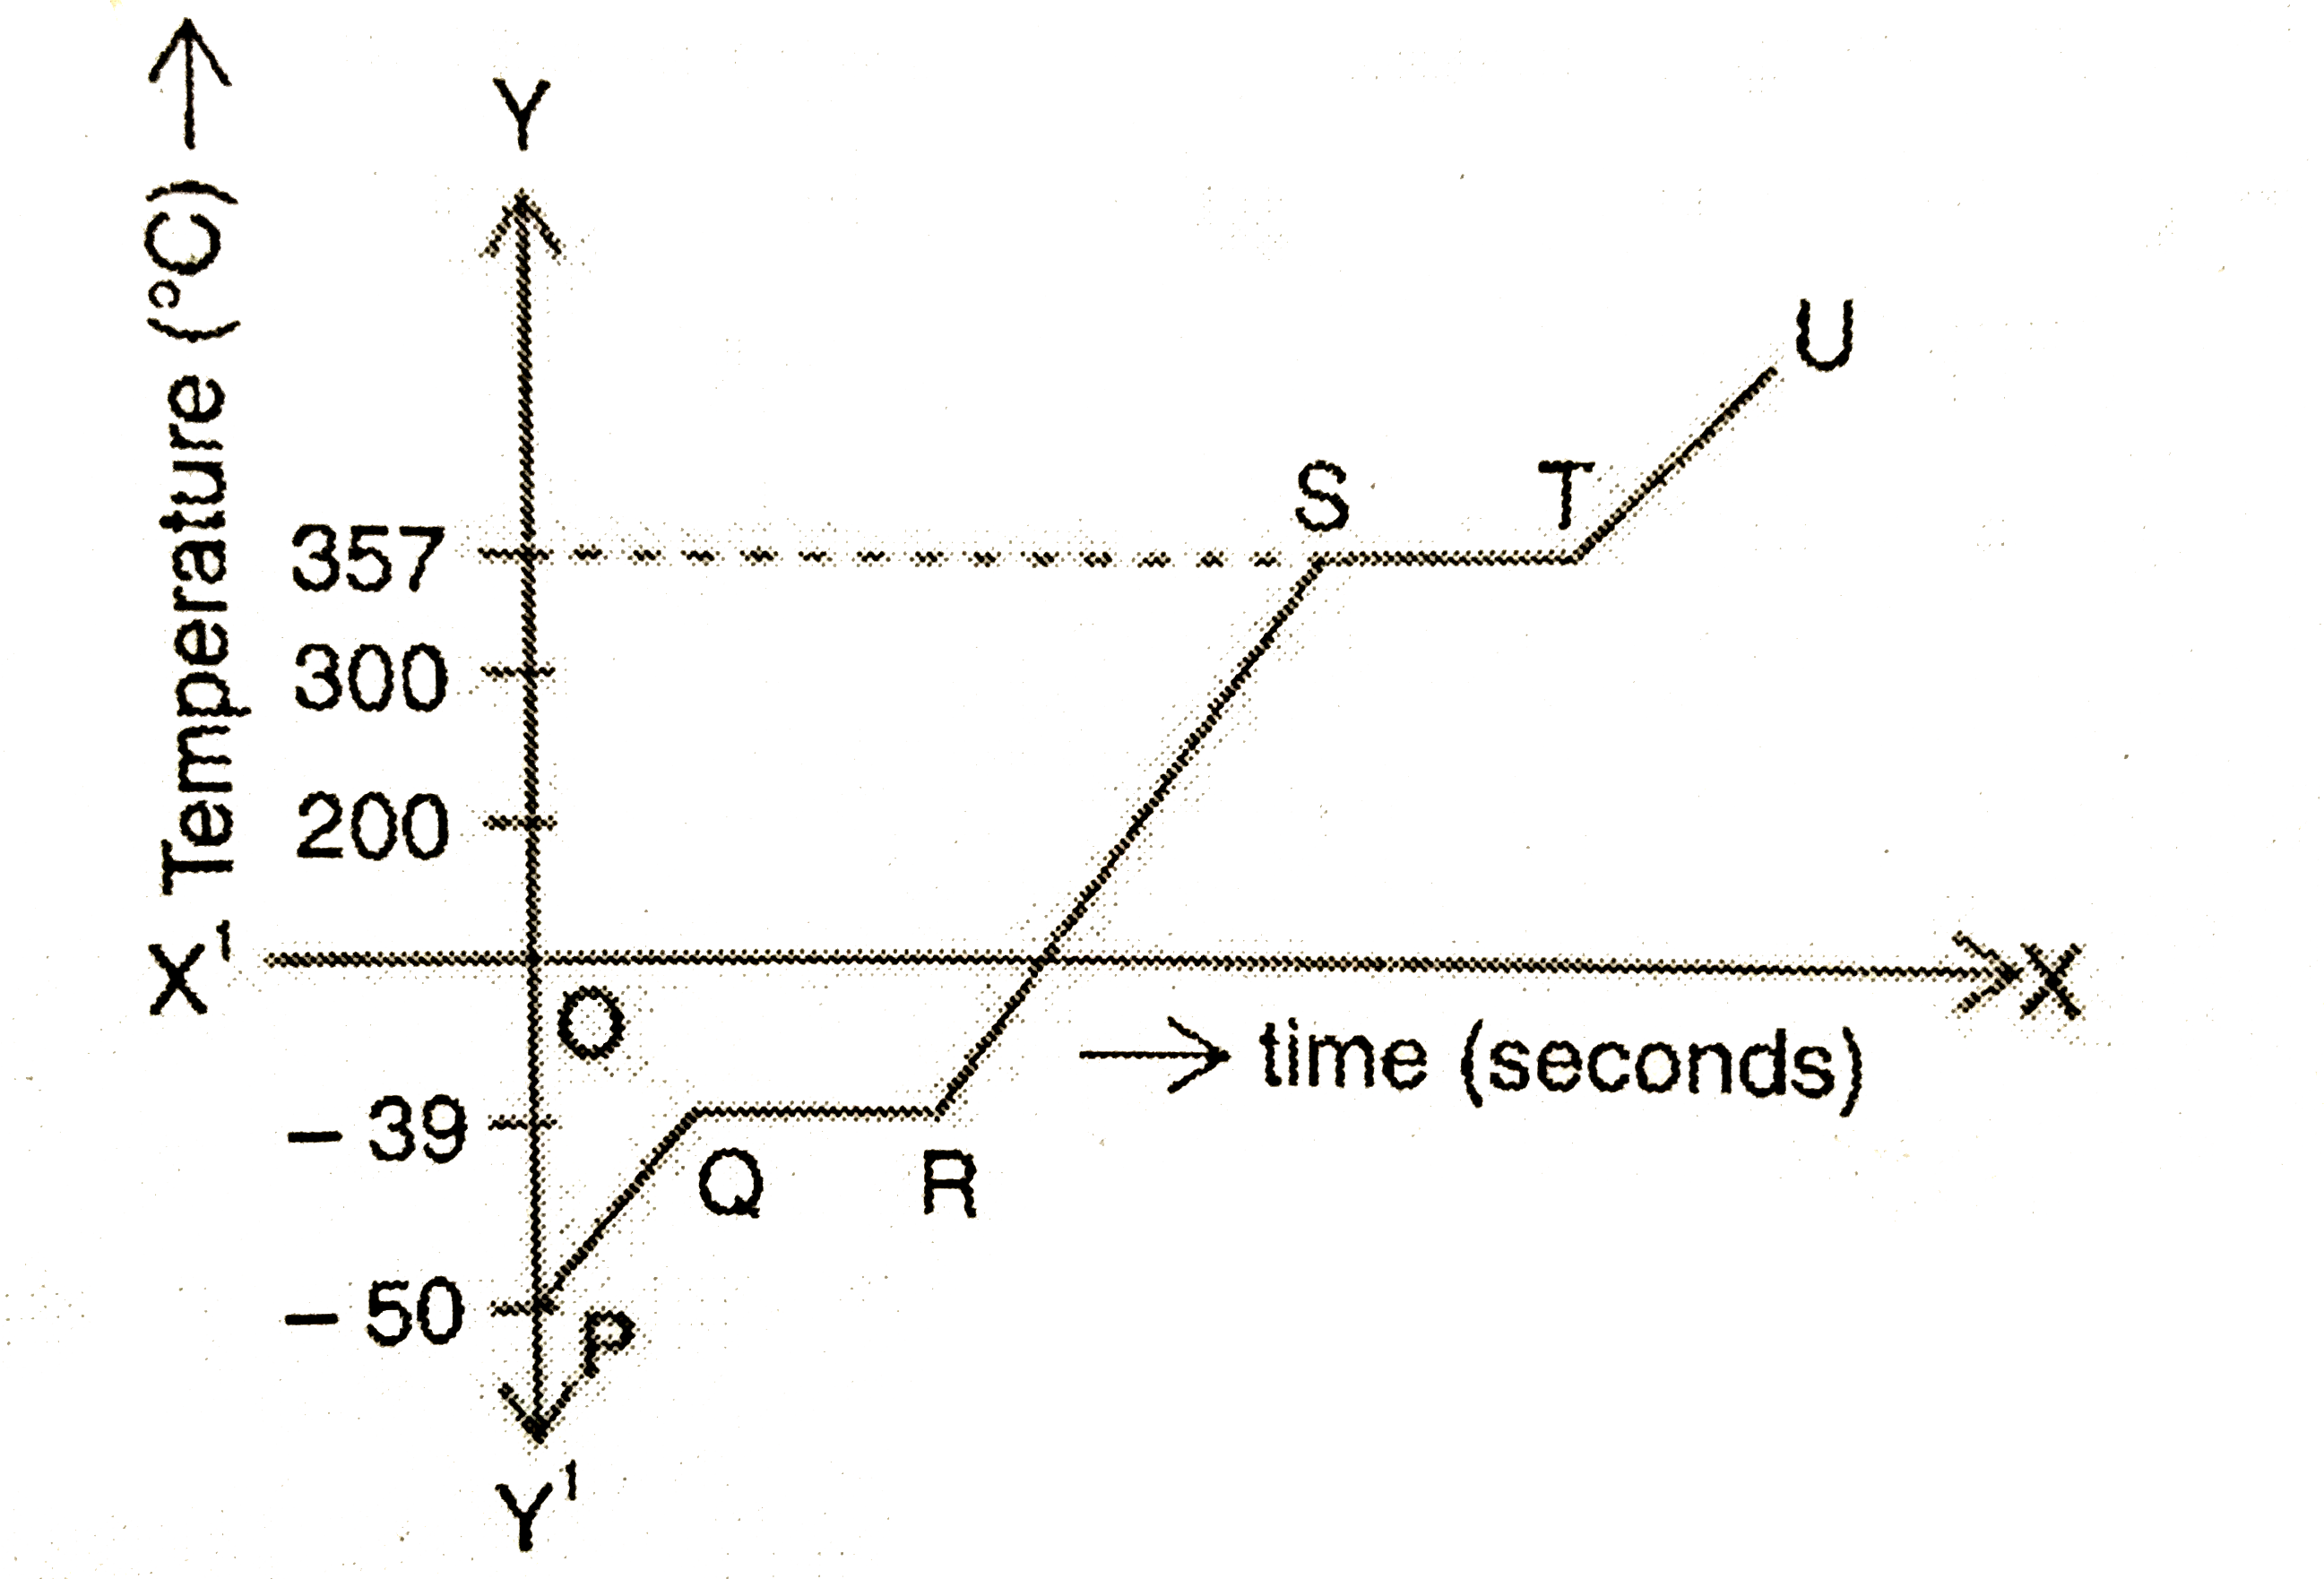
The porition QR of the graph indicates
View SolutionThe heating curve of a paritcular substance in solid state is as shown in the figure .choose the correct alternative

The porition QR of the graph indicates
View SolutionThe heating curve of a particular substance in solid state is as shows in the figure.Choose the correct alternative
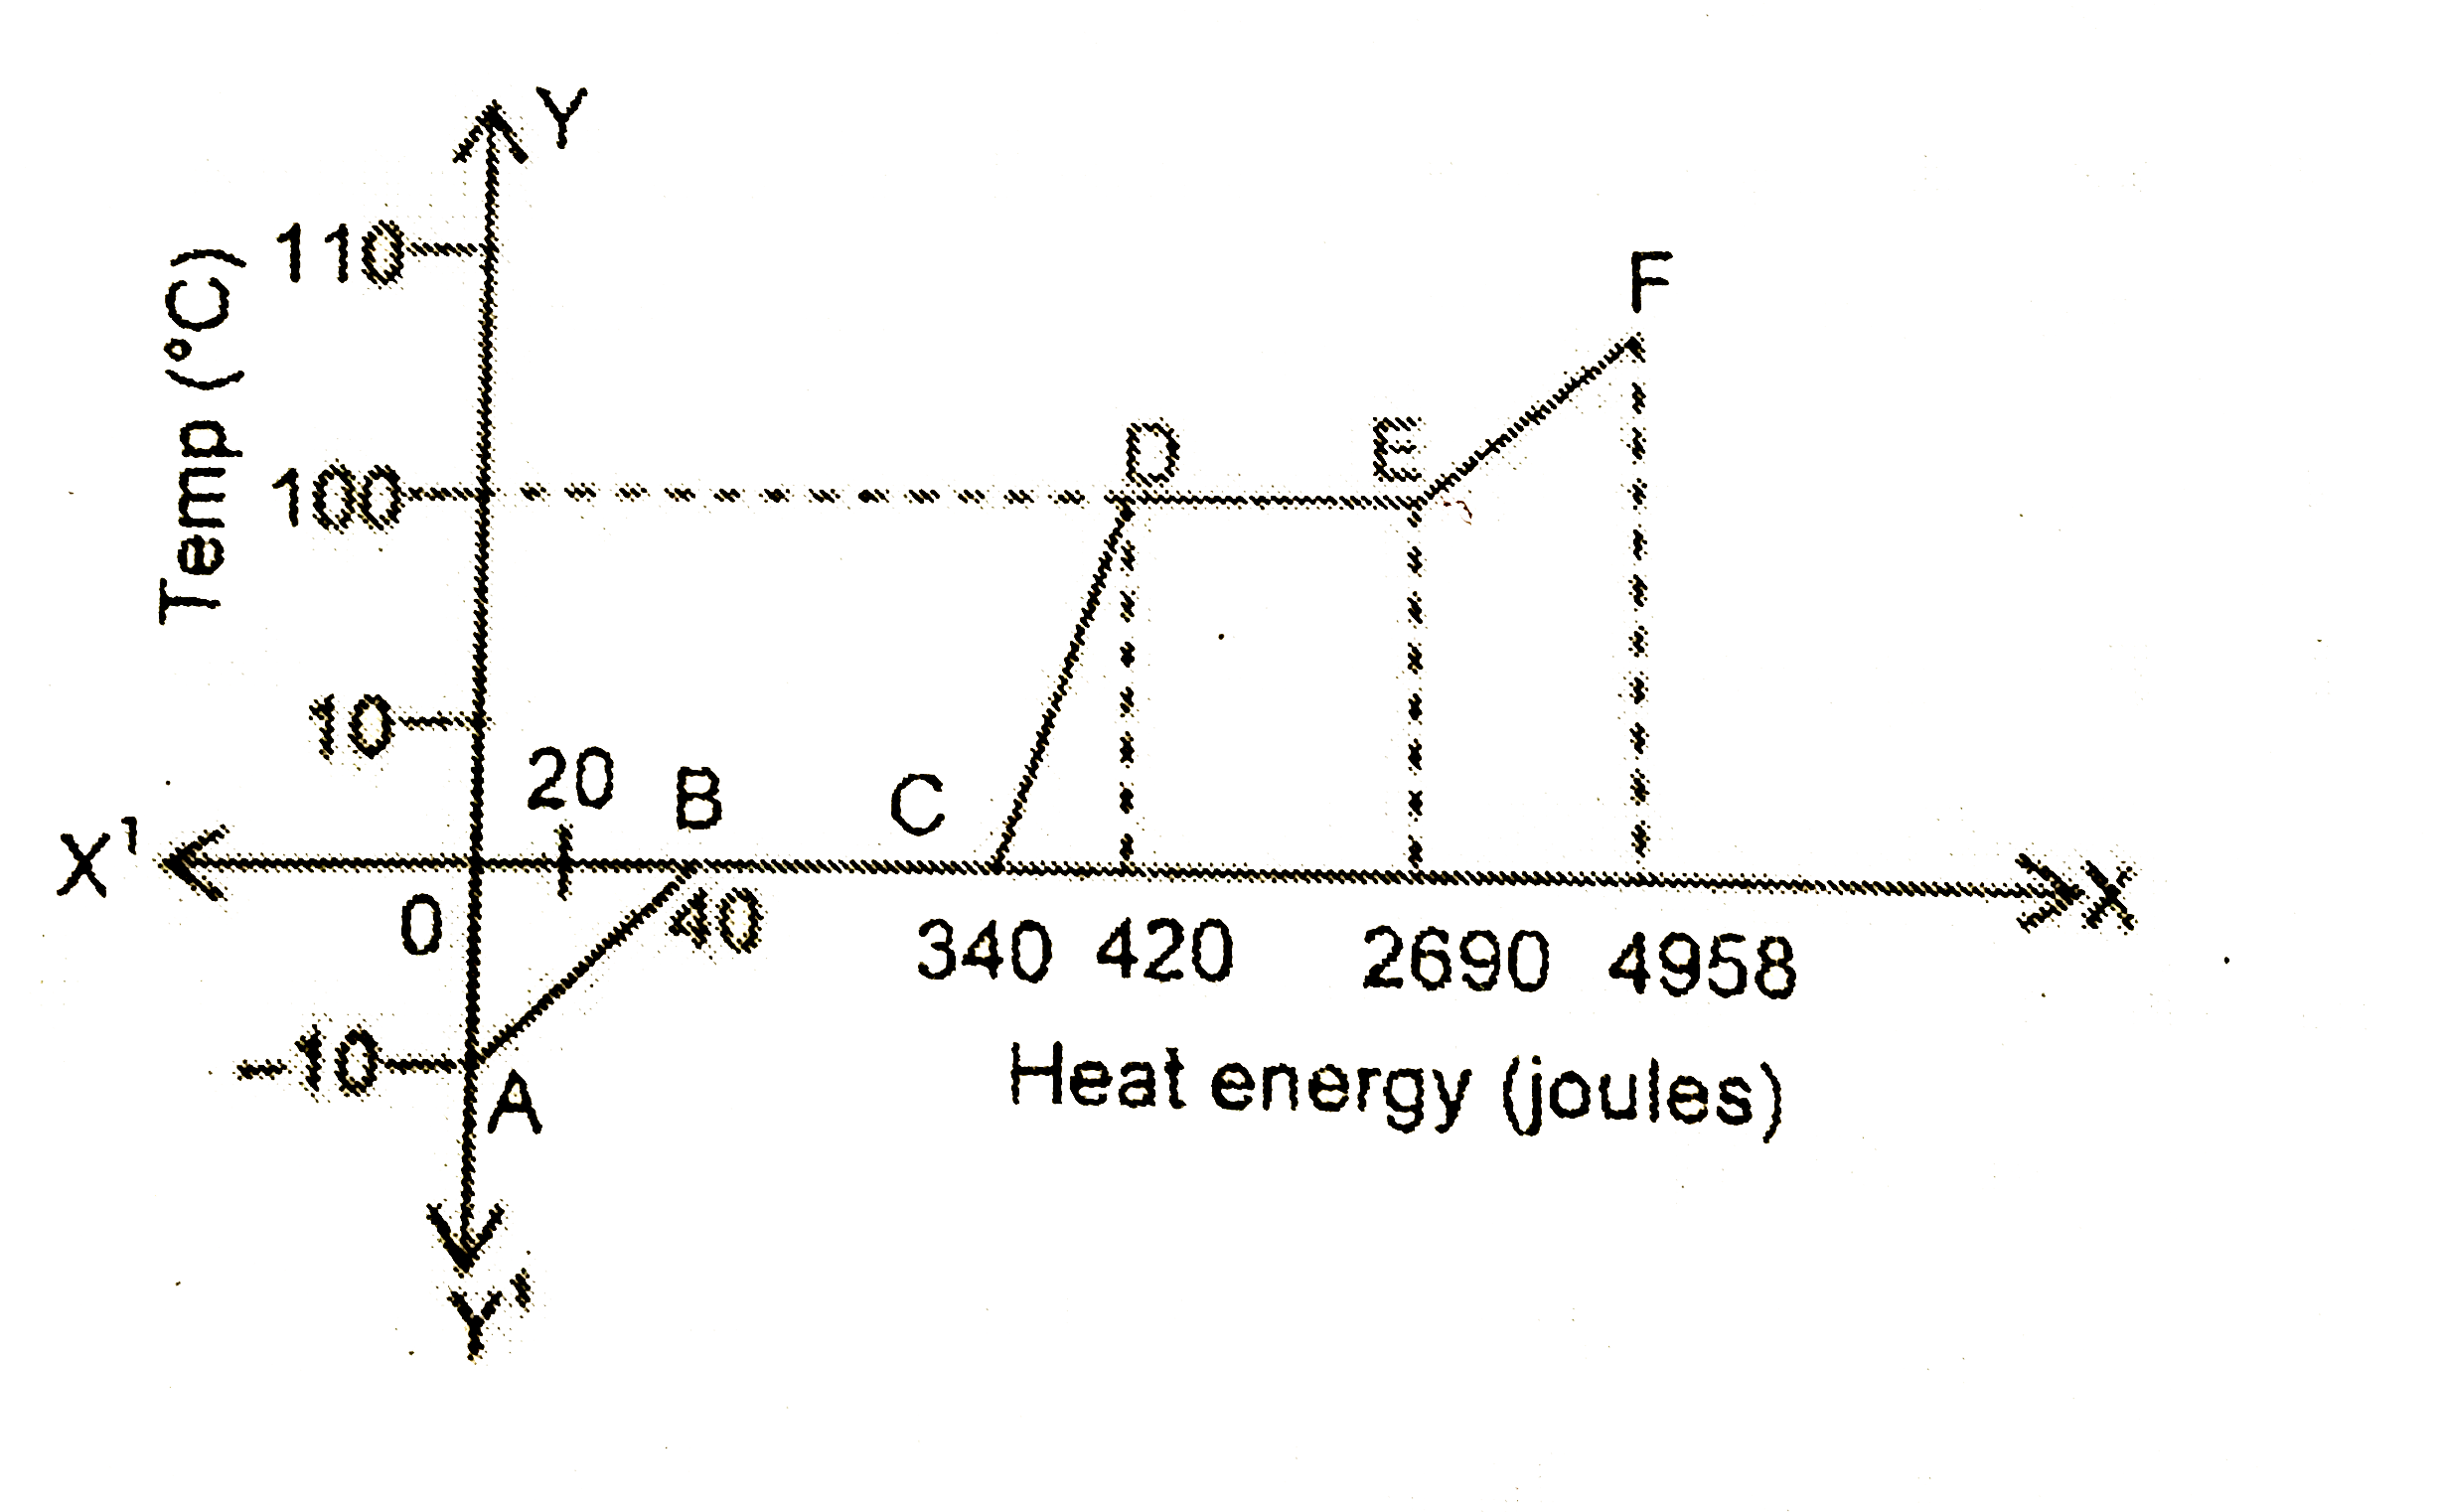
The change of state in the graph is represented by ________part.
View SolutionThe heating curve of a particular substance in solid state is as shows in the figure.Choose the correct alternative

The change of state in the graph is represented by ________part.
View Solution

