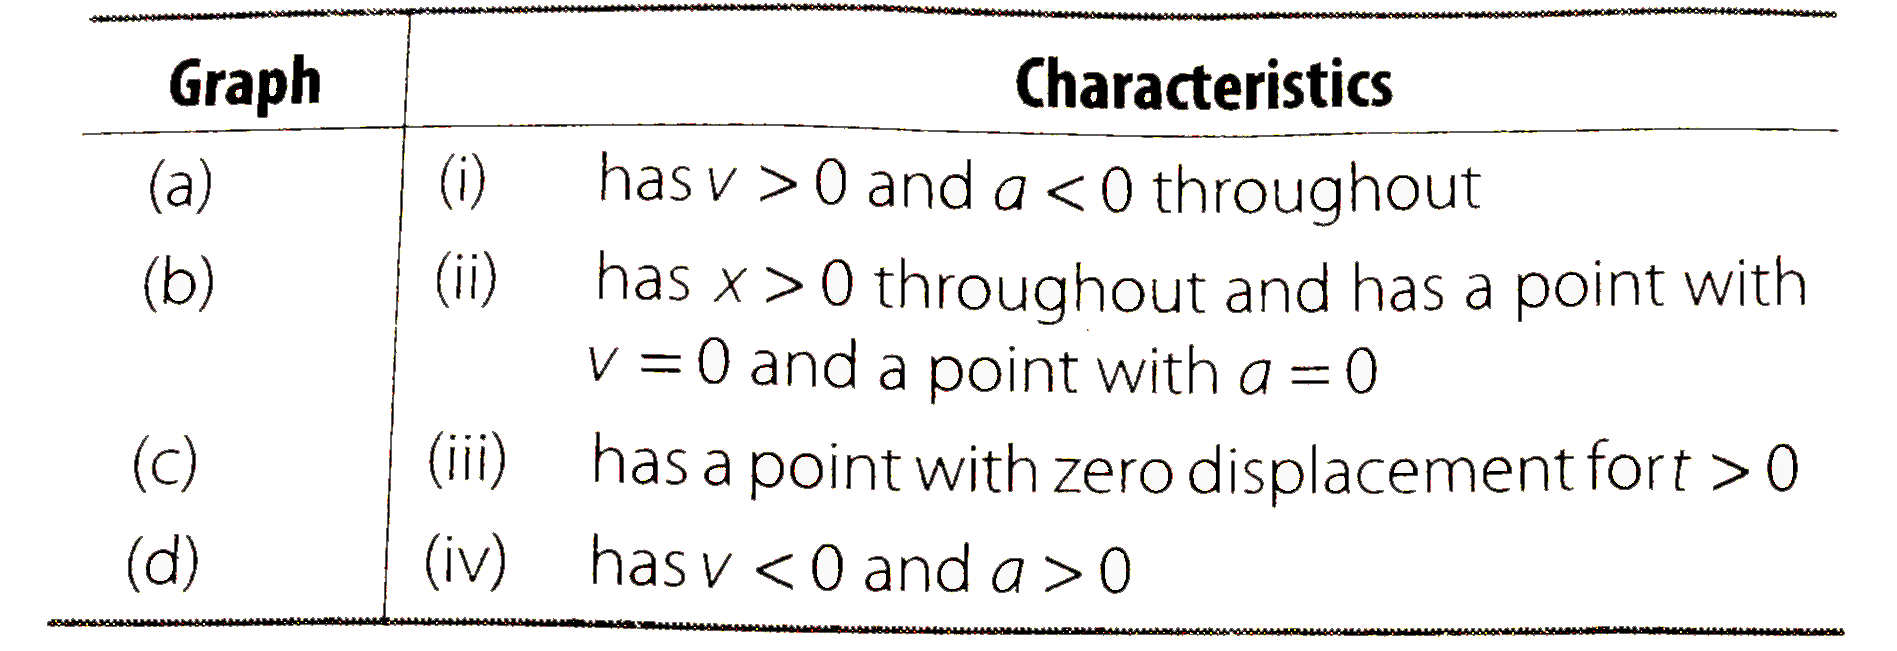
Refer to the graph in figure. Match the following
A
B
C
D
Video Solution
Text Solution
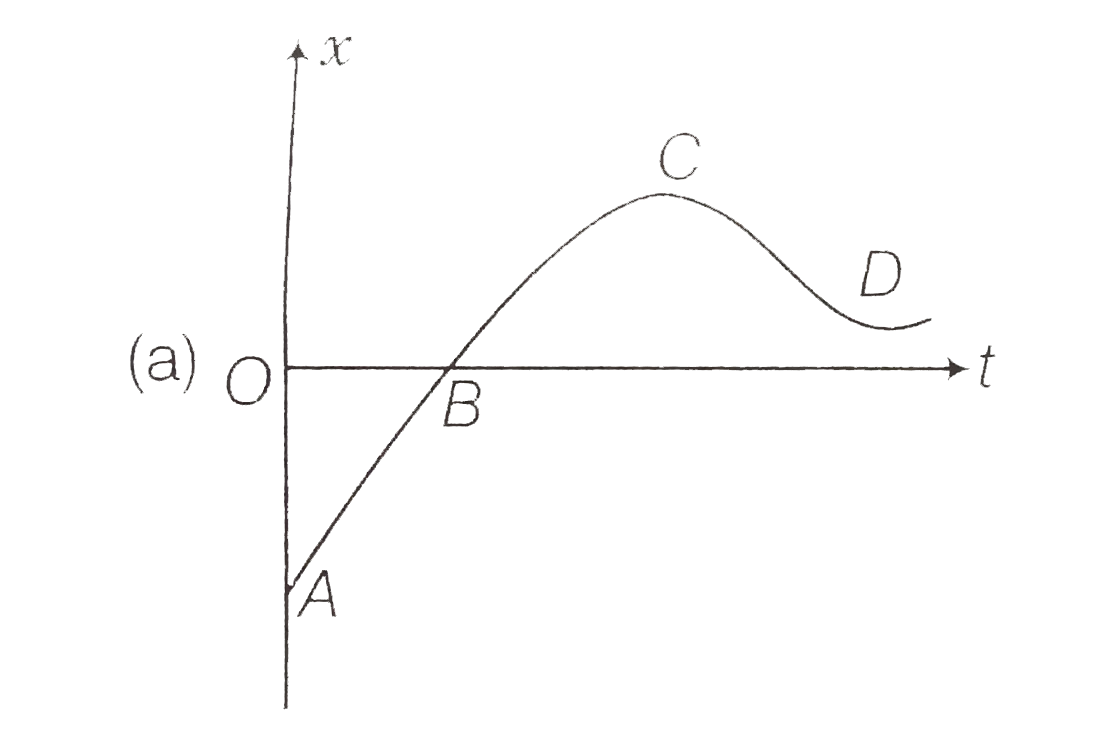
We have to analyse slope of each curve i.e., dxdt For peak points dxdt will be zero as x is maximum at peak points.
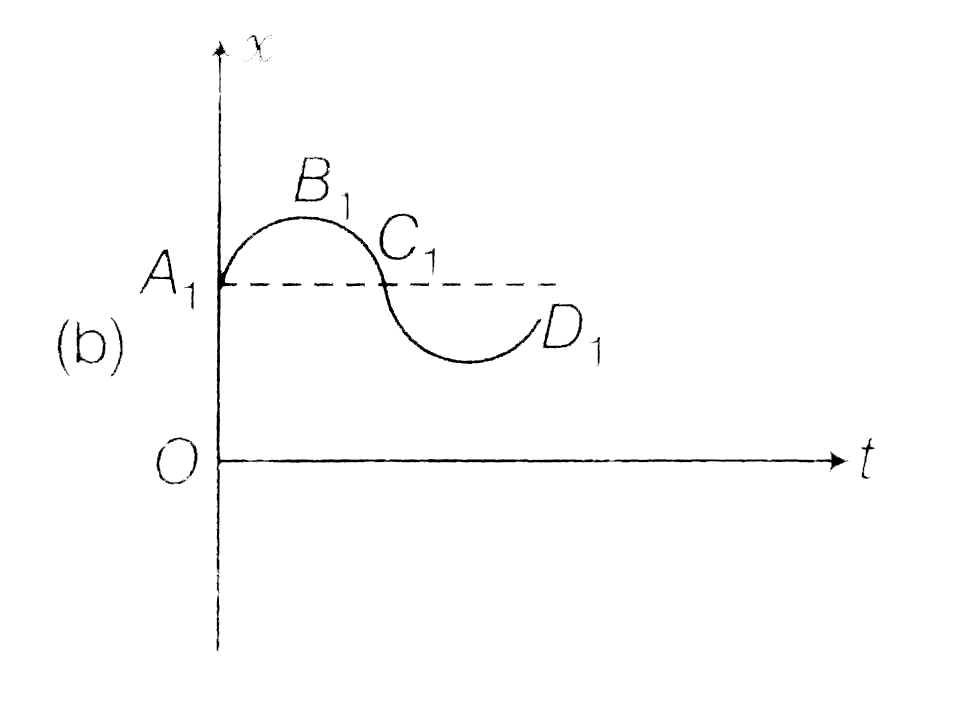
For graph(a), there is a point (B) for which displacment is zero. So, a matches with (iii) in graph (b) , x is positive (>0) throughout and at point B, V=dxdt=0.
since, at point of curvature changes a=0, So b matches with (ii)
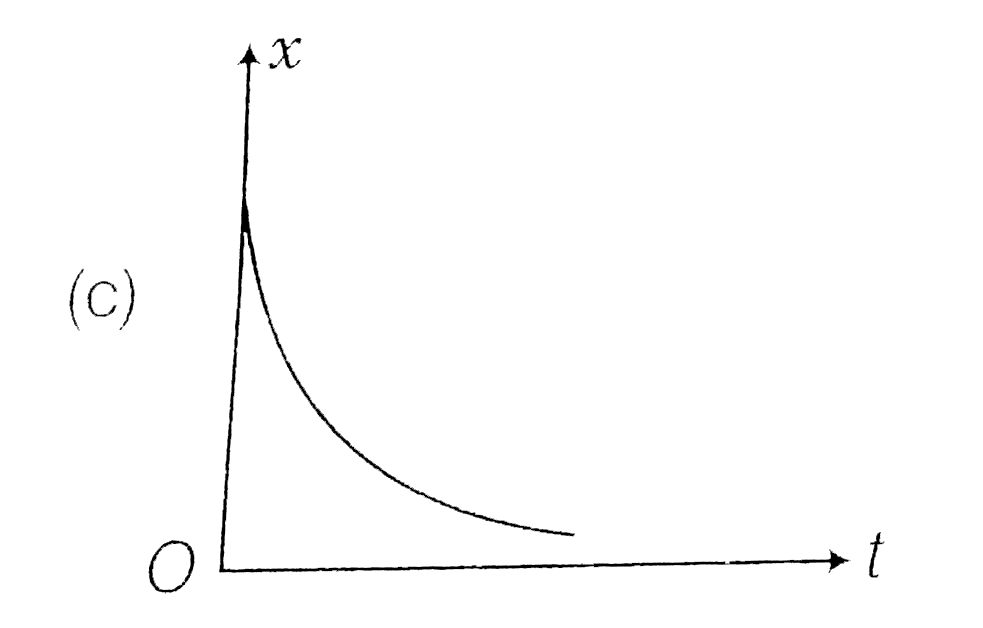
In graph (c), slope V=dxdt is negative hence, velocity will be negative.
so matches with (iv)
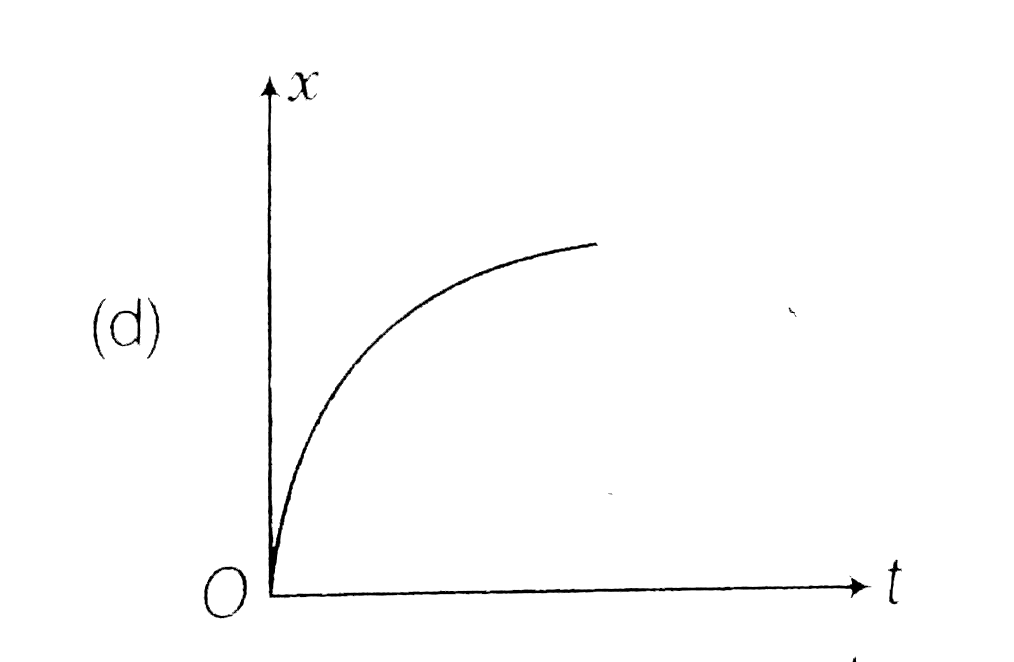
In graph (d), as slope V=dxdt is negative hence, V>0
Hence, d matches with (i)
|
Topper's Solved these Questions
- MOTION IN A STRAIGHT LINE BOOK - NCERT EXEMPLARCHAPTER - MOTION IN A STRAIGHT LINE EXERCISE - Very Short Answer Type Qns
14 Videos
- MOTION IN A STRAIGHT LINE BOOK - NCERT EXEMPLARCHAPTER - MOTION IN A STRAIGHT LINE EXERCISE - Very Short Answer Type Qns
14 Videos
- MOTION IN A PLANEBOOK - NCERT EXEMPLARCHAPTER - MOTION IN A PLANEEXERCISE - Multiple Choice Questions
37 Videos
- OSCILLATIONSBOOK - NCERT EXEMPLARCHAPTER - OSCILLATIONSEXERCISE - MULTIPLE CHOICE QUESTIONS (MCQs)
40 Videos
Similar Questions
Knowledge Check
Refer to the given figure.
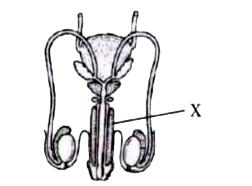
Which of the following is correct about the part labelled as X ?AIt is a muscular and erectile tissue.BIt aids in delivering the sperms into the vagina of the female.CIt produces the sperms.DBoth (a) and (b)Refer to the given figure
AKLMN5'endPhosphodiester bondThymineRibose sugarBKLMN3'endGlycosidic bondGuanineDeoxyribose sugarCKLMN5'endHydrogen bondAdenineRibose sugarDKLMN5'endHydrogen bondAdenineDeoxyribose sugarRefer to the given figure and answer the following questions
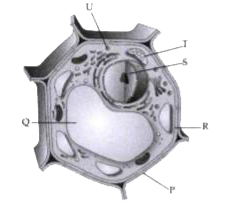
Which of the following statement is correct?APart marked as P is present in all prokaryotes and eukaryotes.BBoth the parts P and Q are present in animal cells.CPlant cells lack the part marked as S.DPart marked as R is selectively permeable in both prokaryotes and eukaryotes.
Refer to the graph given here.
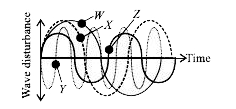
Which of the following sound waves is low-pitched but loud?
View SolutionIn the V-T graph shown in figure match the following.
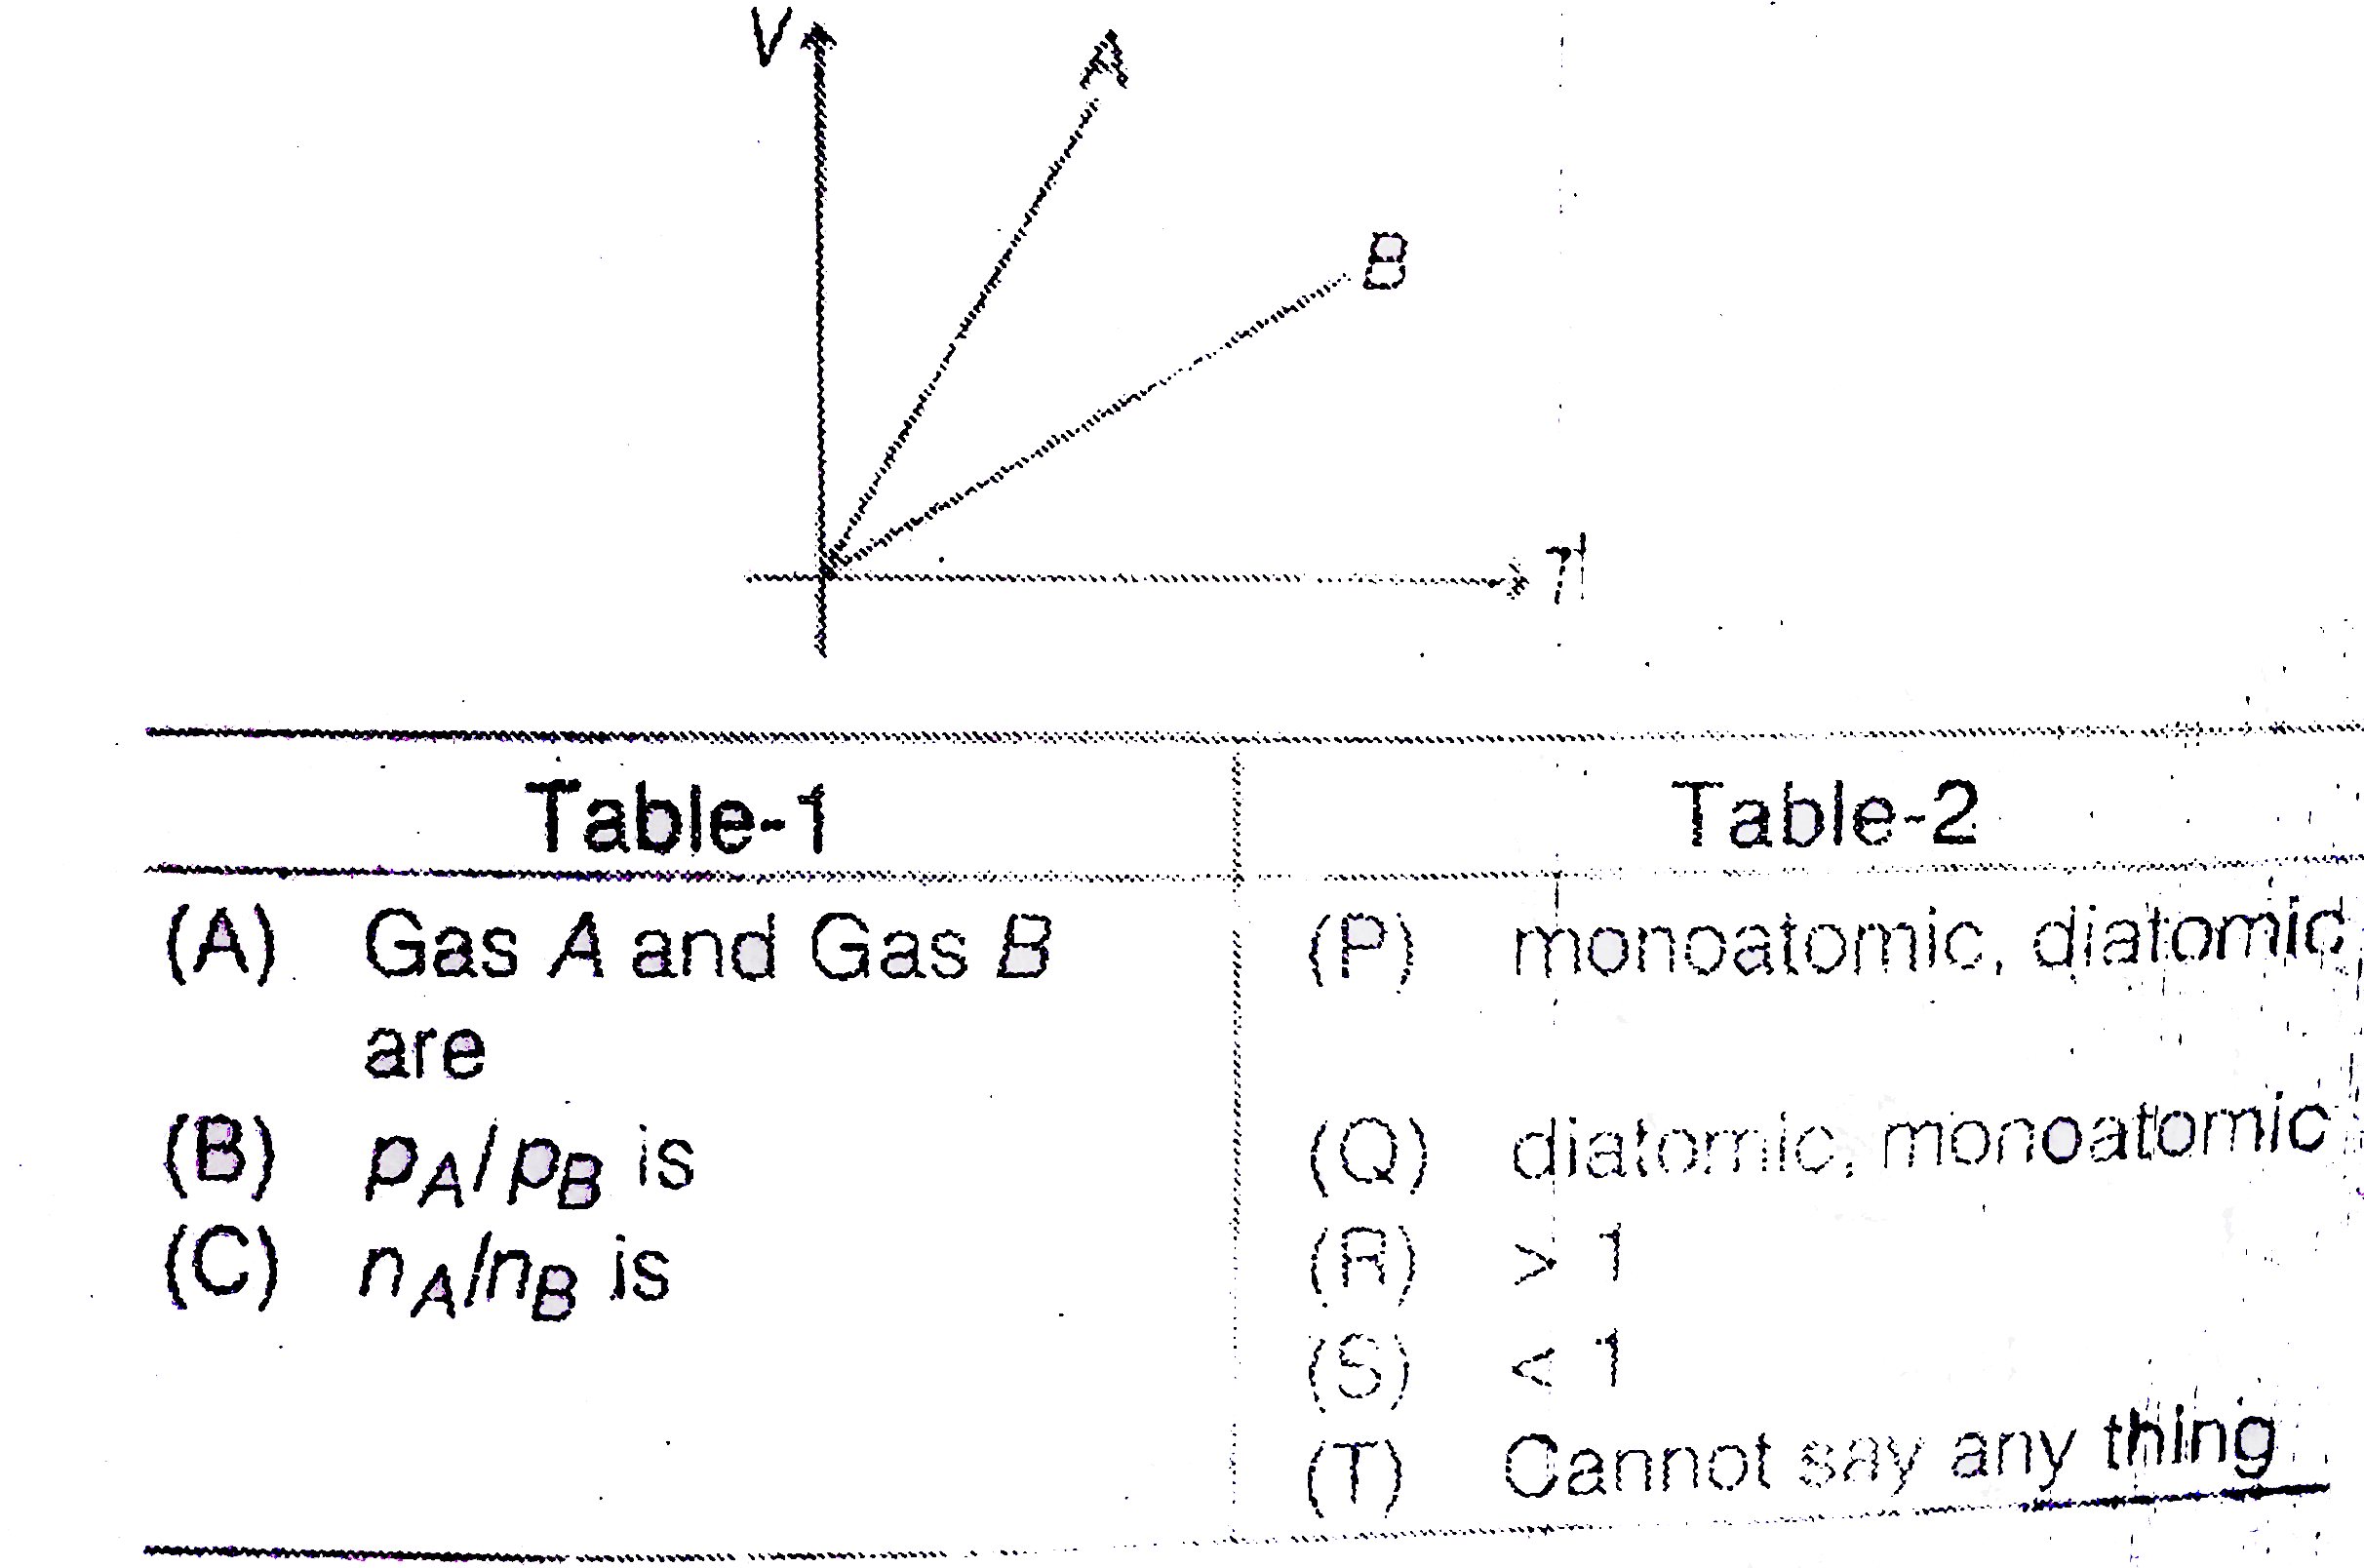
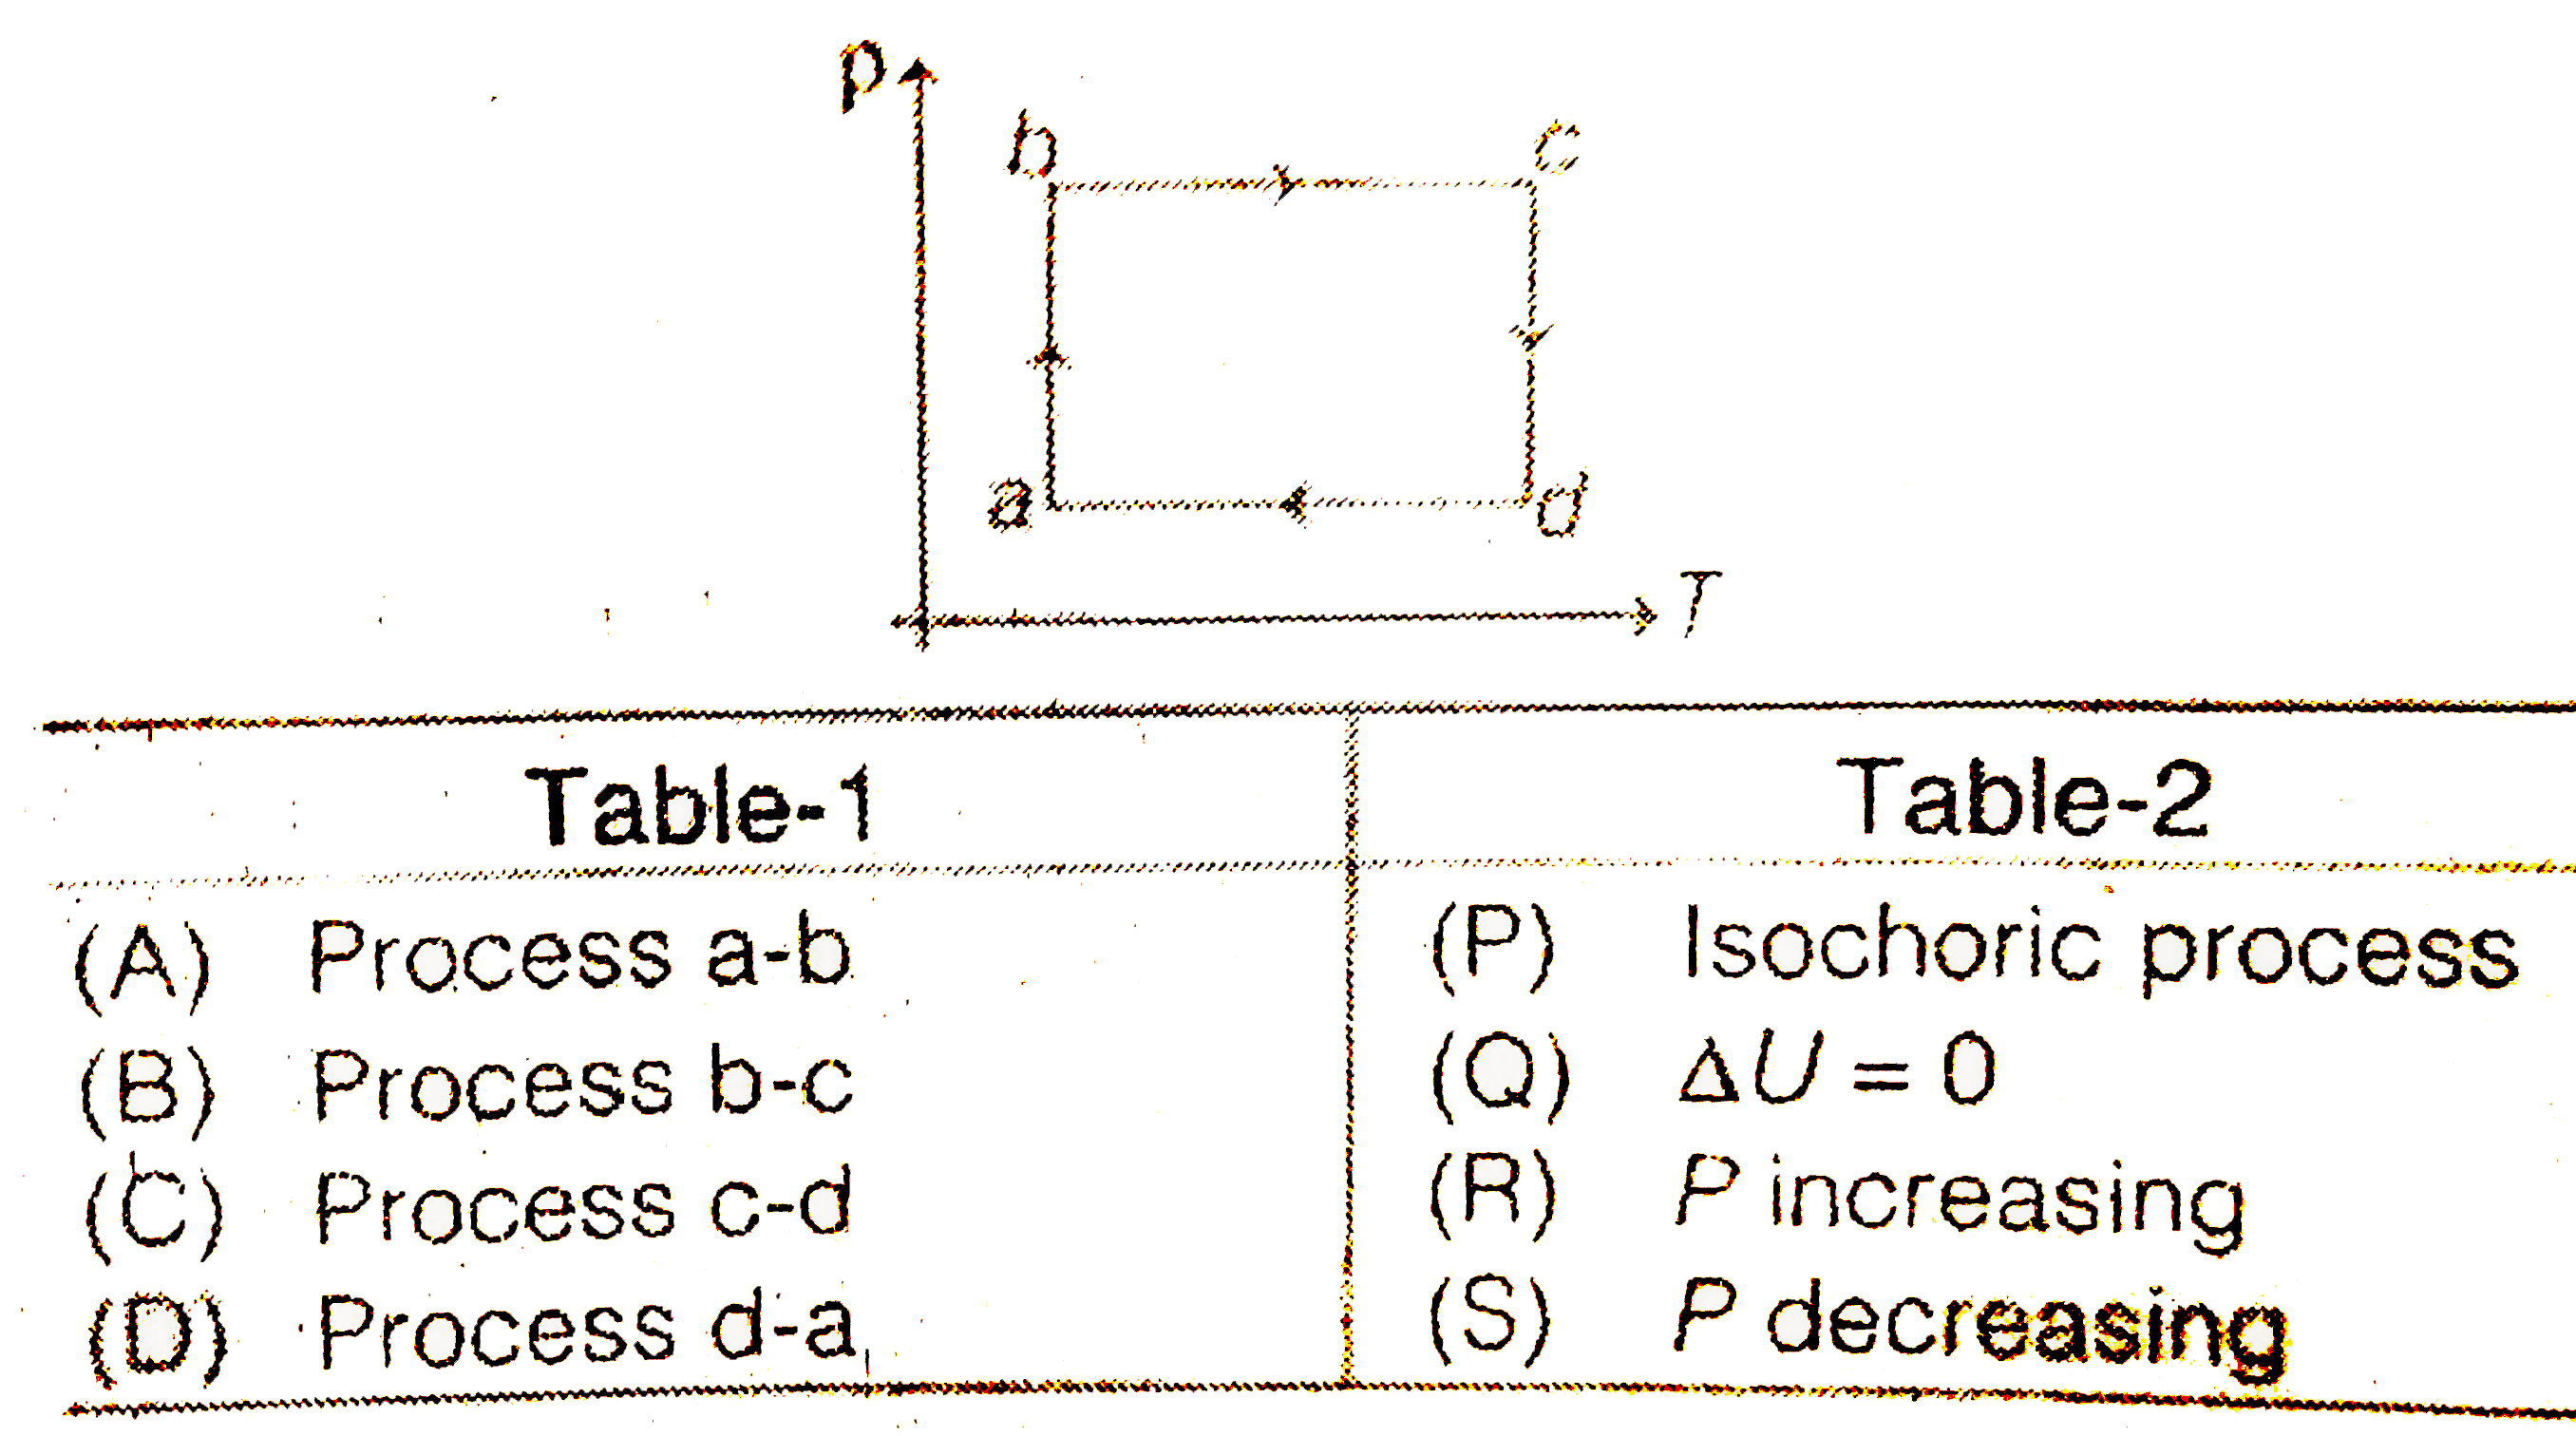
View SolutionIn the ρ-T graph shown in figure, match the following.
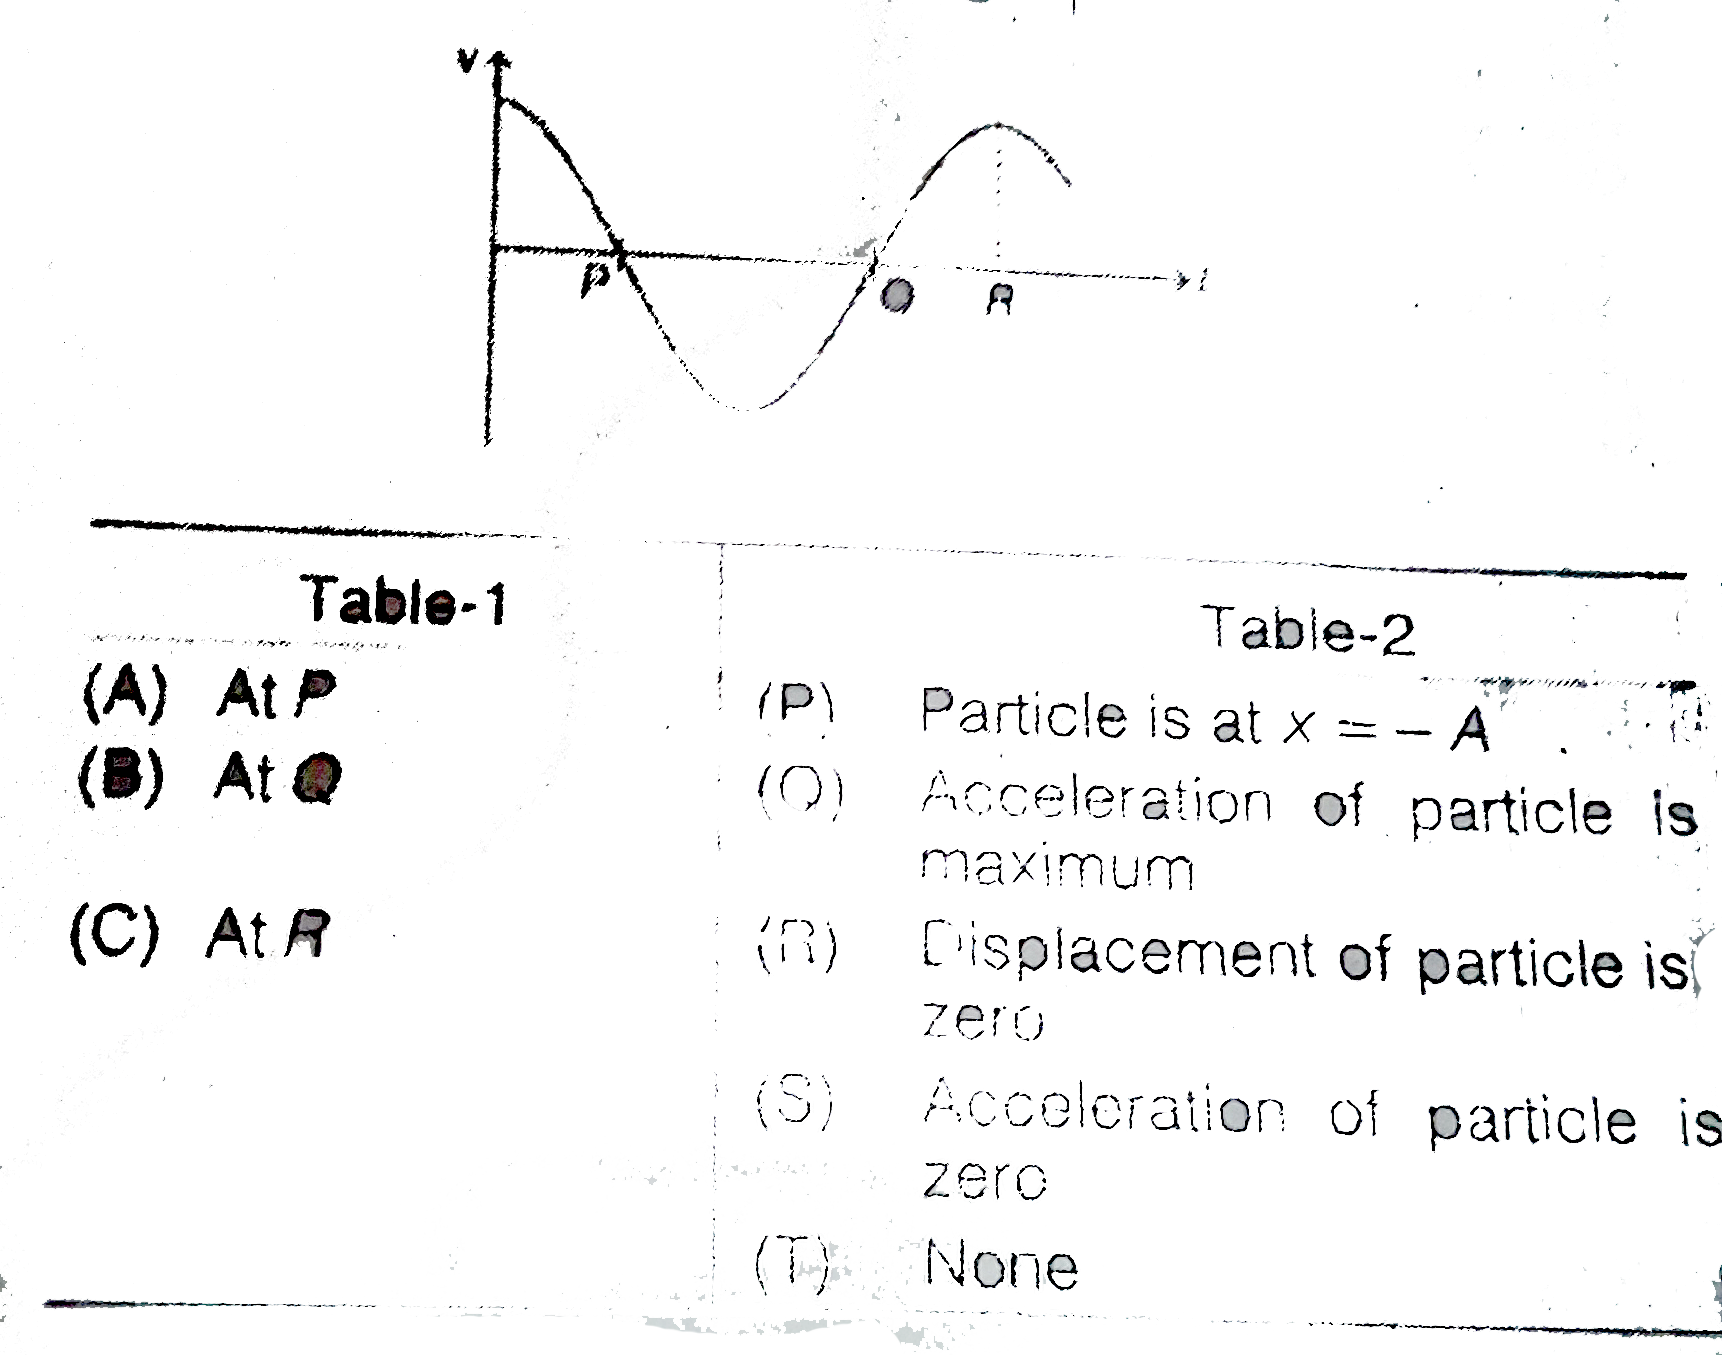
View SolutionVelocity-time graph of a particle in SHM is as shown in figure. Match the following
View SolutionRefer to the graph given here:
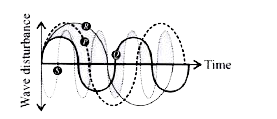
Which of the following sound waves is high-pitched but soft ?
View Solution

