A ball is dropped and its displacement vs time graph is as shown in Fig. 2 (EP) .7 displacement (x) is from ground and all quantities are +ve upwards. (a) Plot qualitatively velocity vs time graph. (b) plot qualitatively acceleration vs time graph .
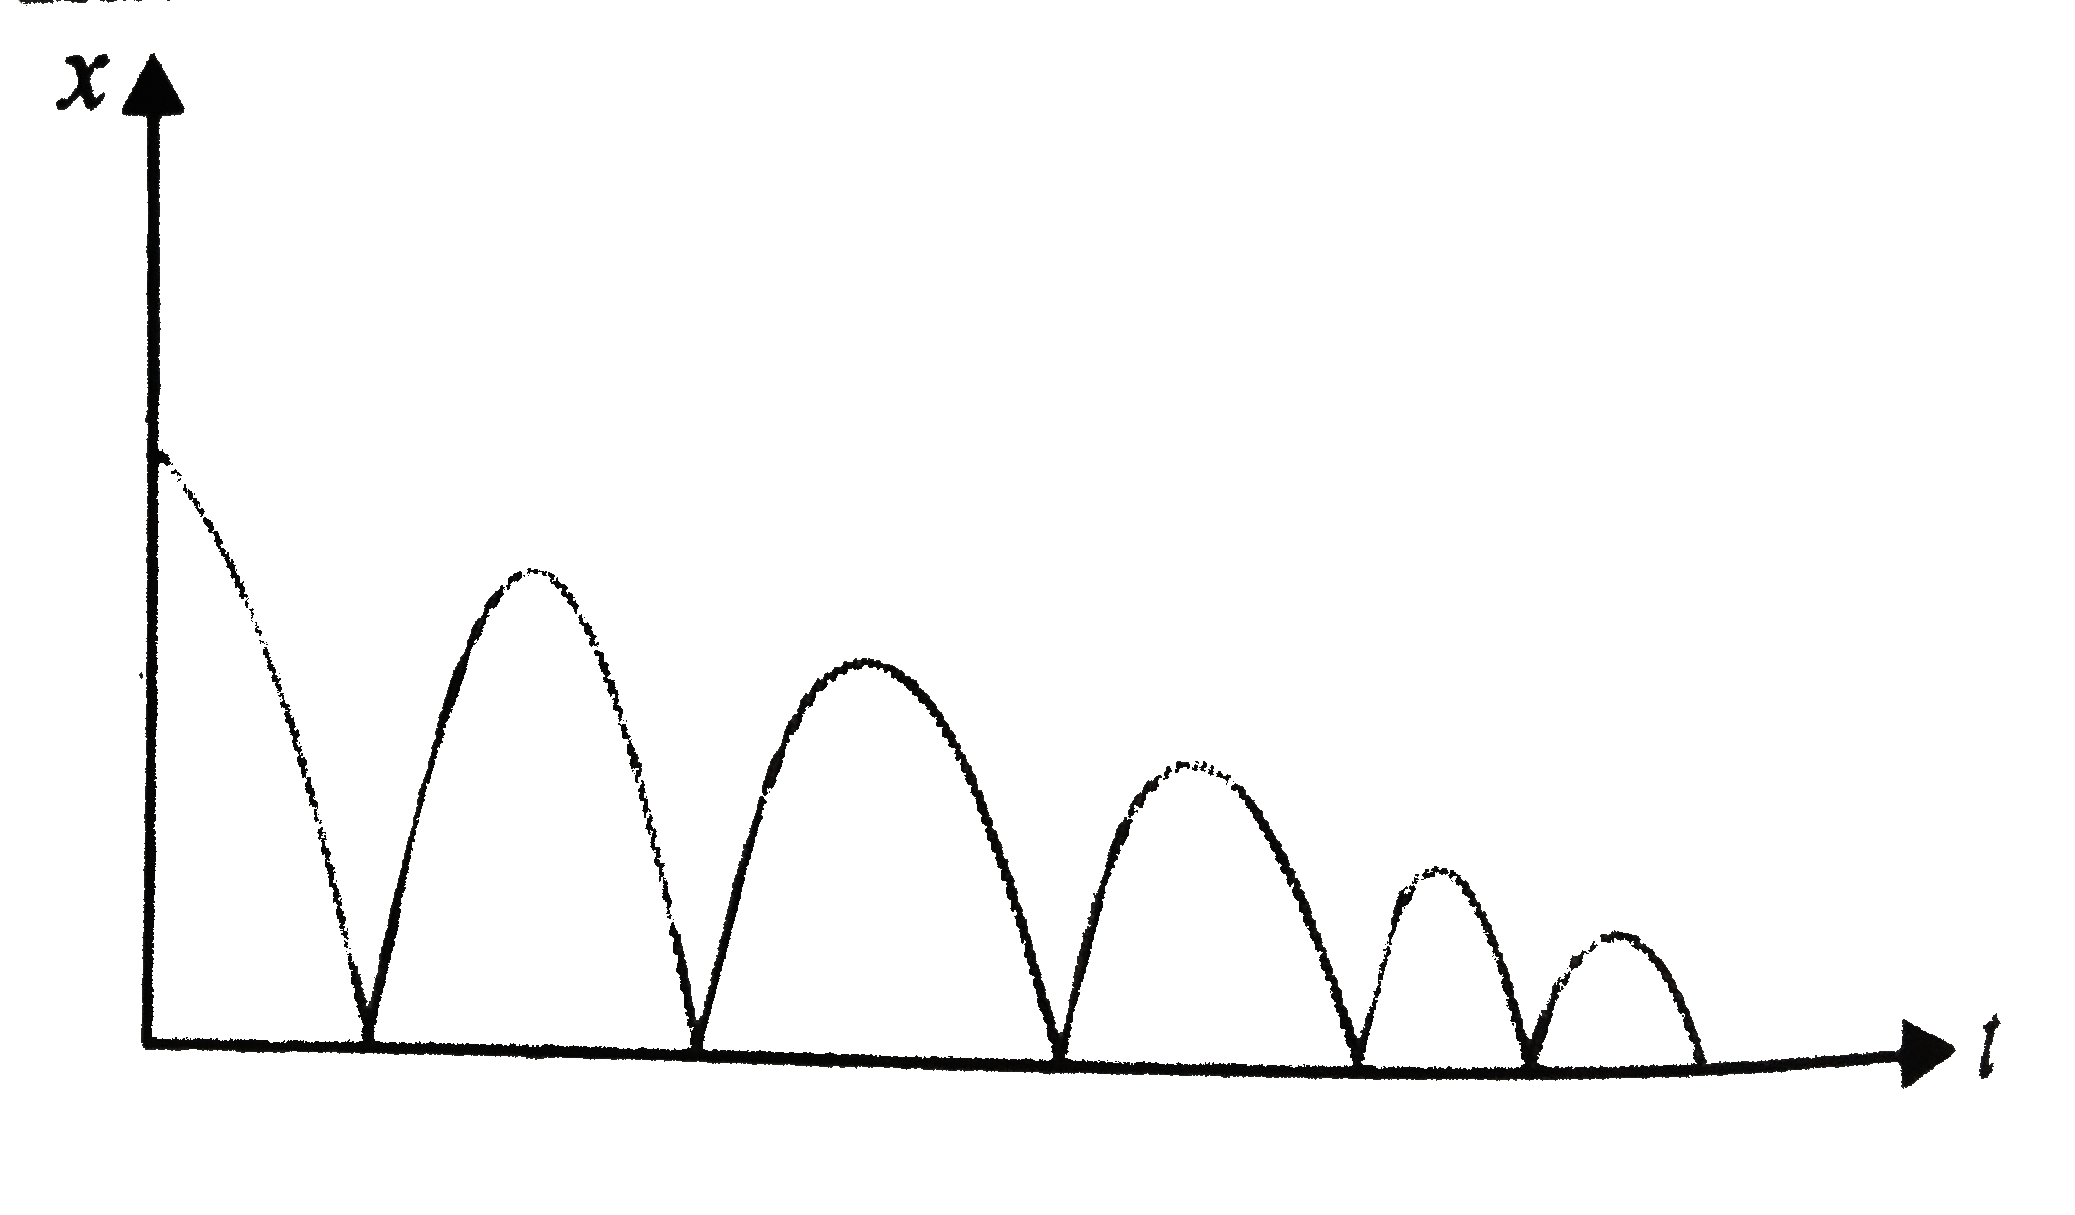
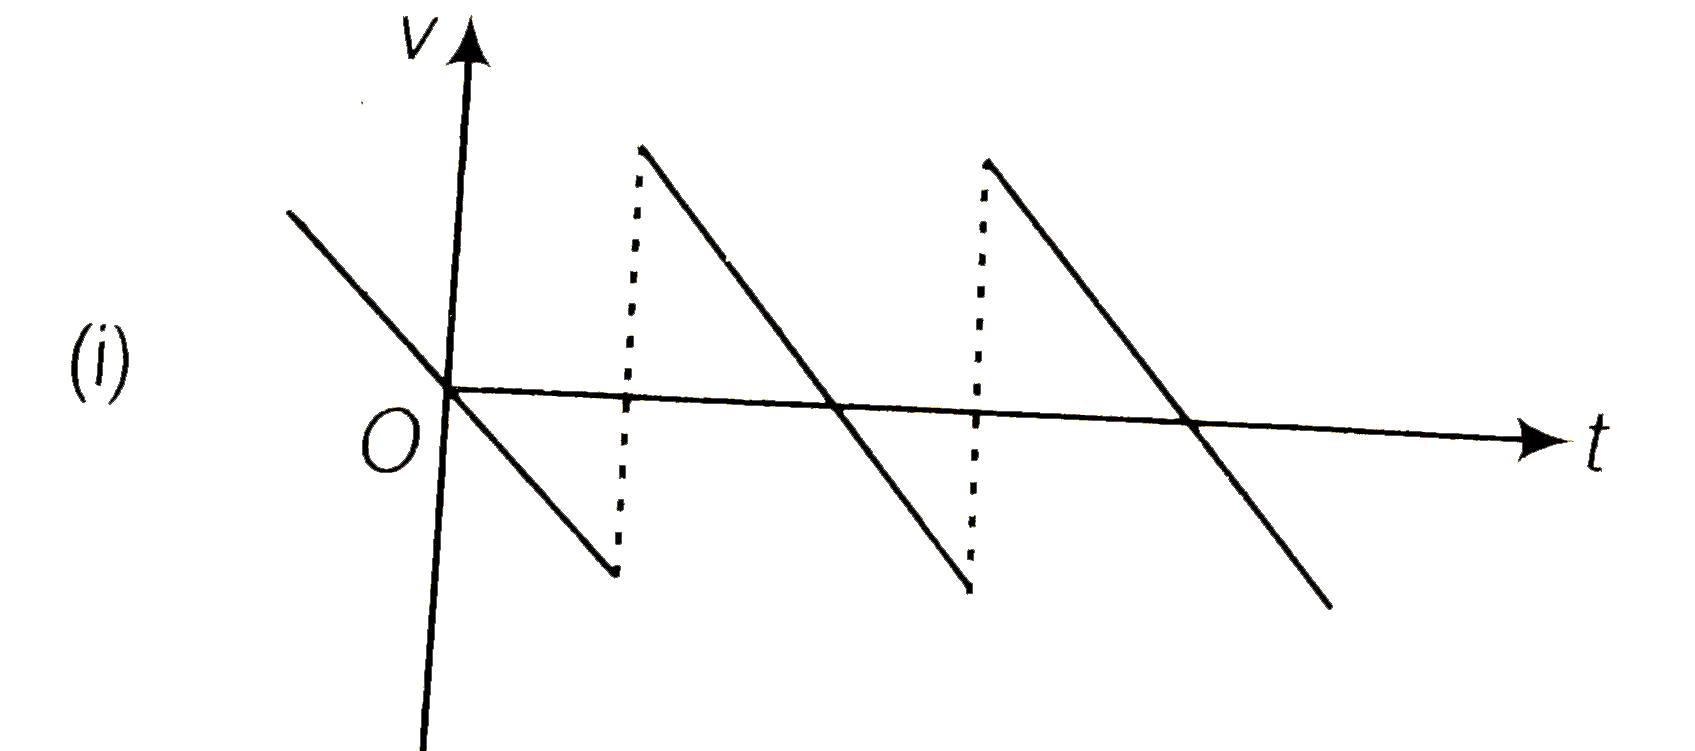
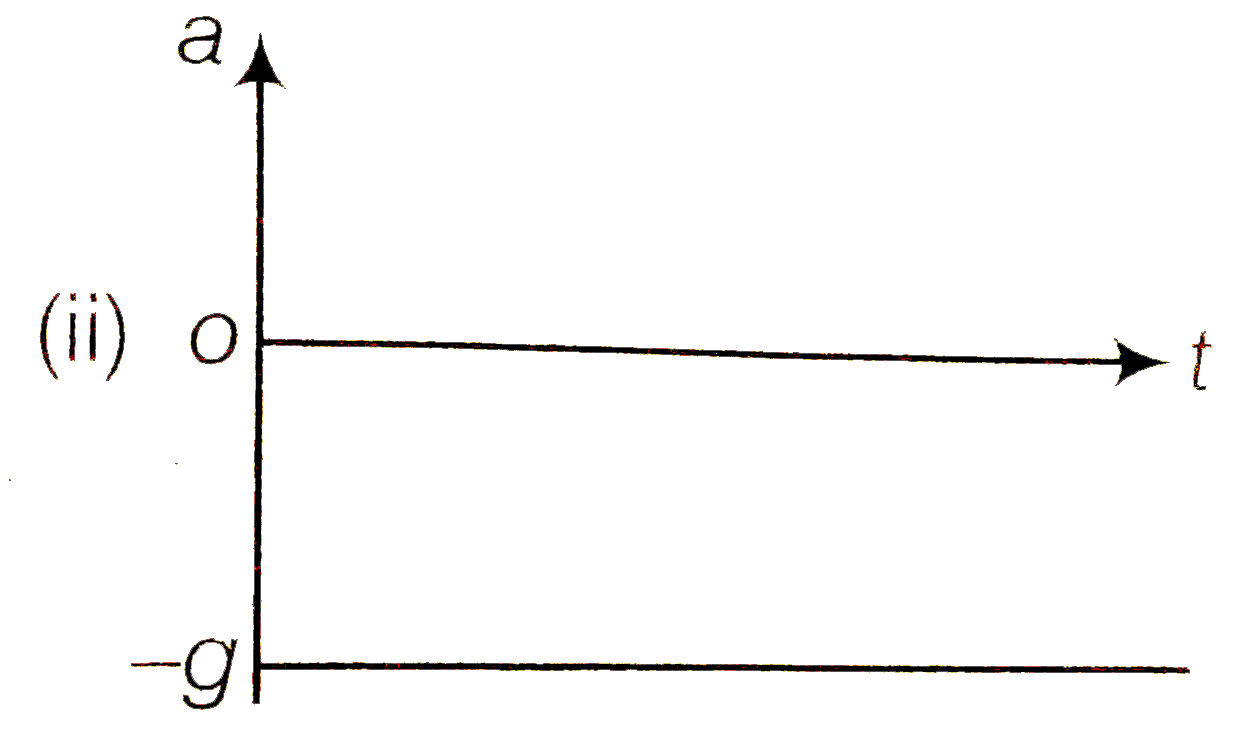
It is clear from the graph that displacement x is positive throughout. Ball is dropped from a height and its velocity increases in downward direction due to gravity pull. In this condition v is negative but accleration of the ball is equal to accleration due to gravity i.e.,
When ball rebounds in upward direction its velocity is positive but acceleration is .
(a) The velocity-time graph of the ball is shown in fig. (i)
(b) The acceleation-time graph of the ball is shown in fig.
Topper's Solved these Questions
- MOTION IN A STRAIGHT LINE BOOK - NCERT EXEMPLARCHAPTER - MOTION IN A STRAIGHT LINE EXERCISE - Multiple Choice Question (More Than One Qns)
6 Videos
- MOTION IN A PLANEBOOK - NCERT EXEMPLARCHAPTER - MOTION IN A PLANEEXERCISE - Multiple Choice Questions
37 Videos
- OSCILLATIONSBOOK - NCERT EXEMPLARCHAPTER - OSCILLATIONSEXERCISE - MULTIPLE CHOICE QUESTIONS (MCQs)
40 Videos
Similar Questions
A ball is dropped and its displacement vs time graph is as shown in Fig. 2 (EP) .7 (displacement (x) is grom ground and all quantities are +ve upwards). (a) Plot qualitvely velocity vs time graph). (b) plot qualitatively acceleration vs time graph .

View SolutionDisplacement-time graph is shown in the figure. Displacement
The corresponding distance-time graph is
View Solution
Knowledge Check
velocity time graph of a particle is shown in figure. Find displacement of the particle.
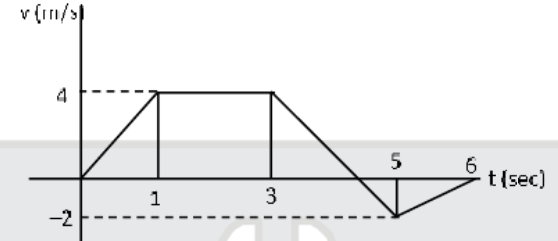 A7B11C5D15
The velocity-time graph of a body is shown in .
The displacement of the body in 8s is.
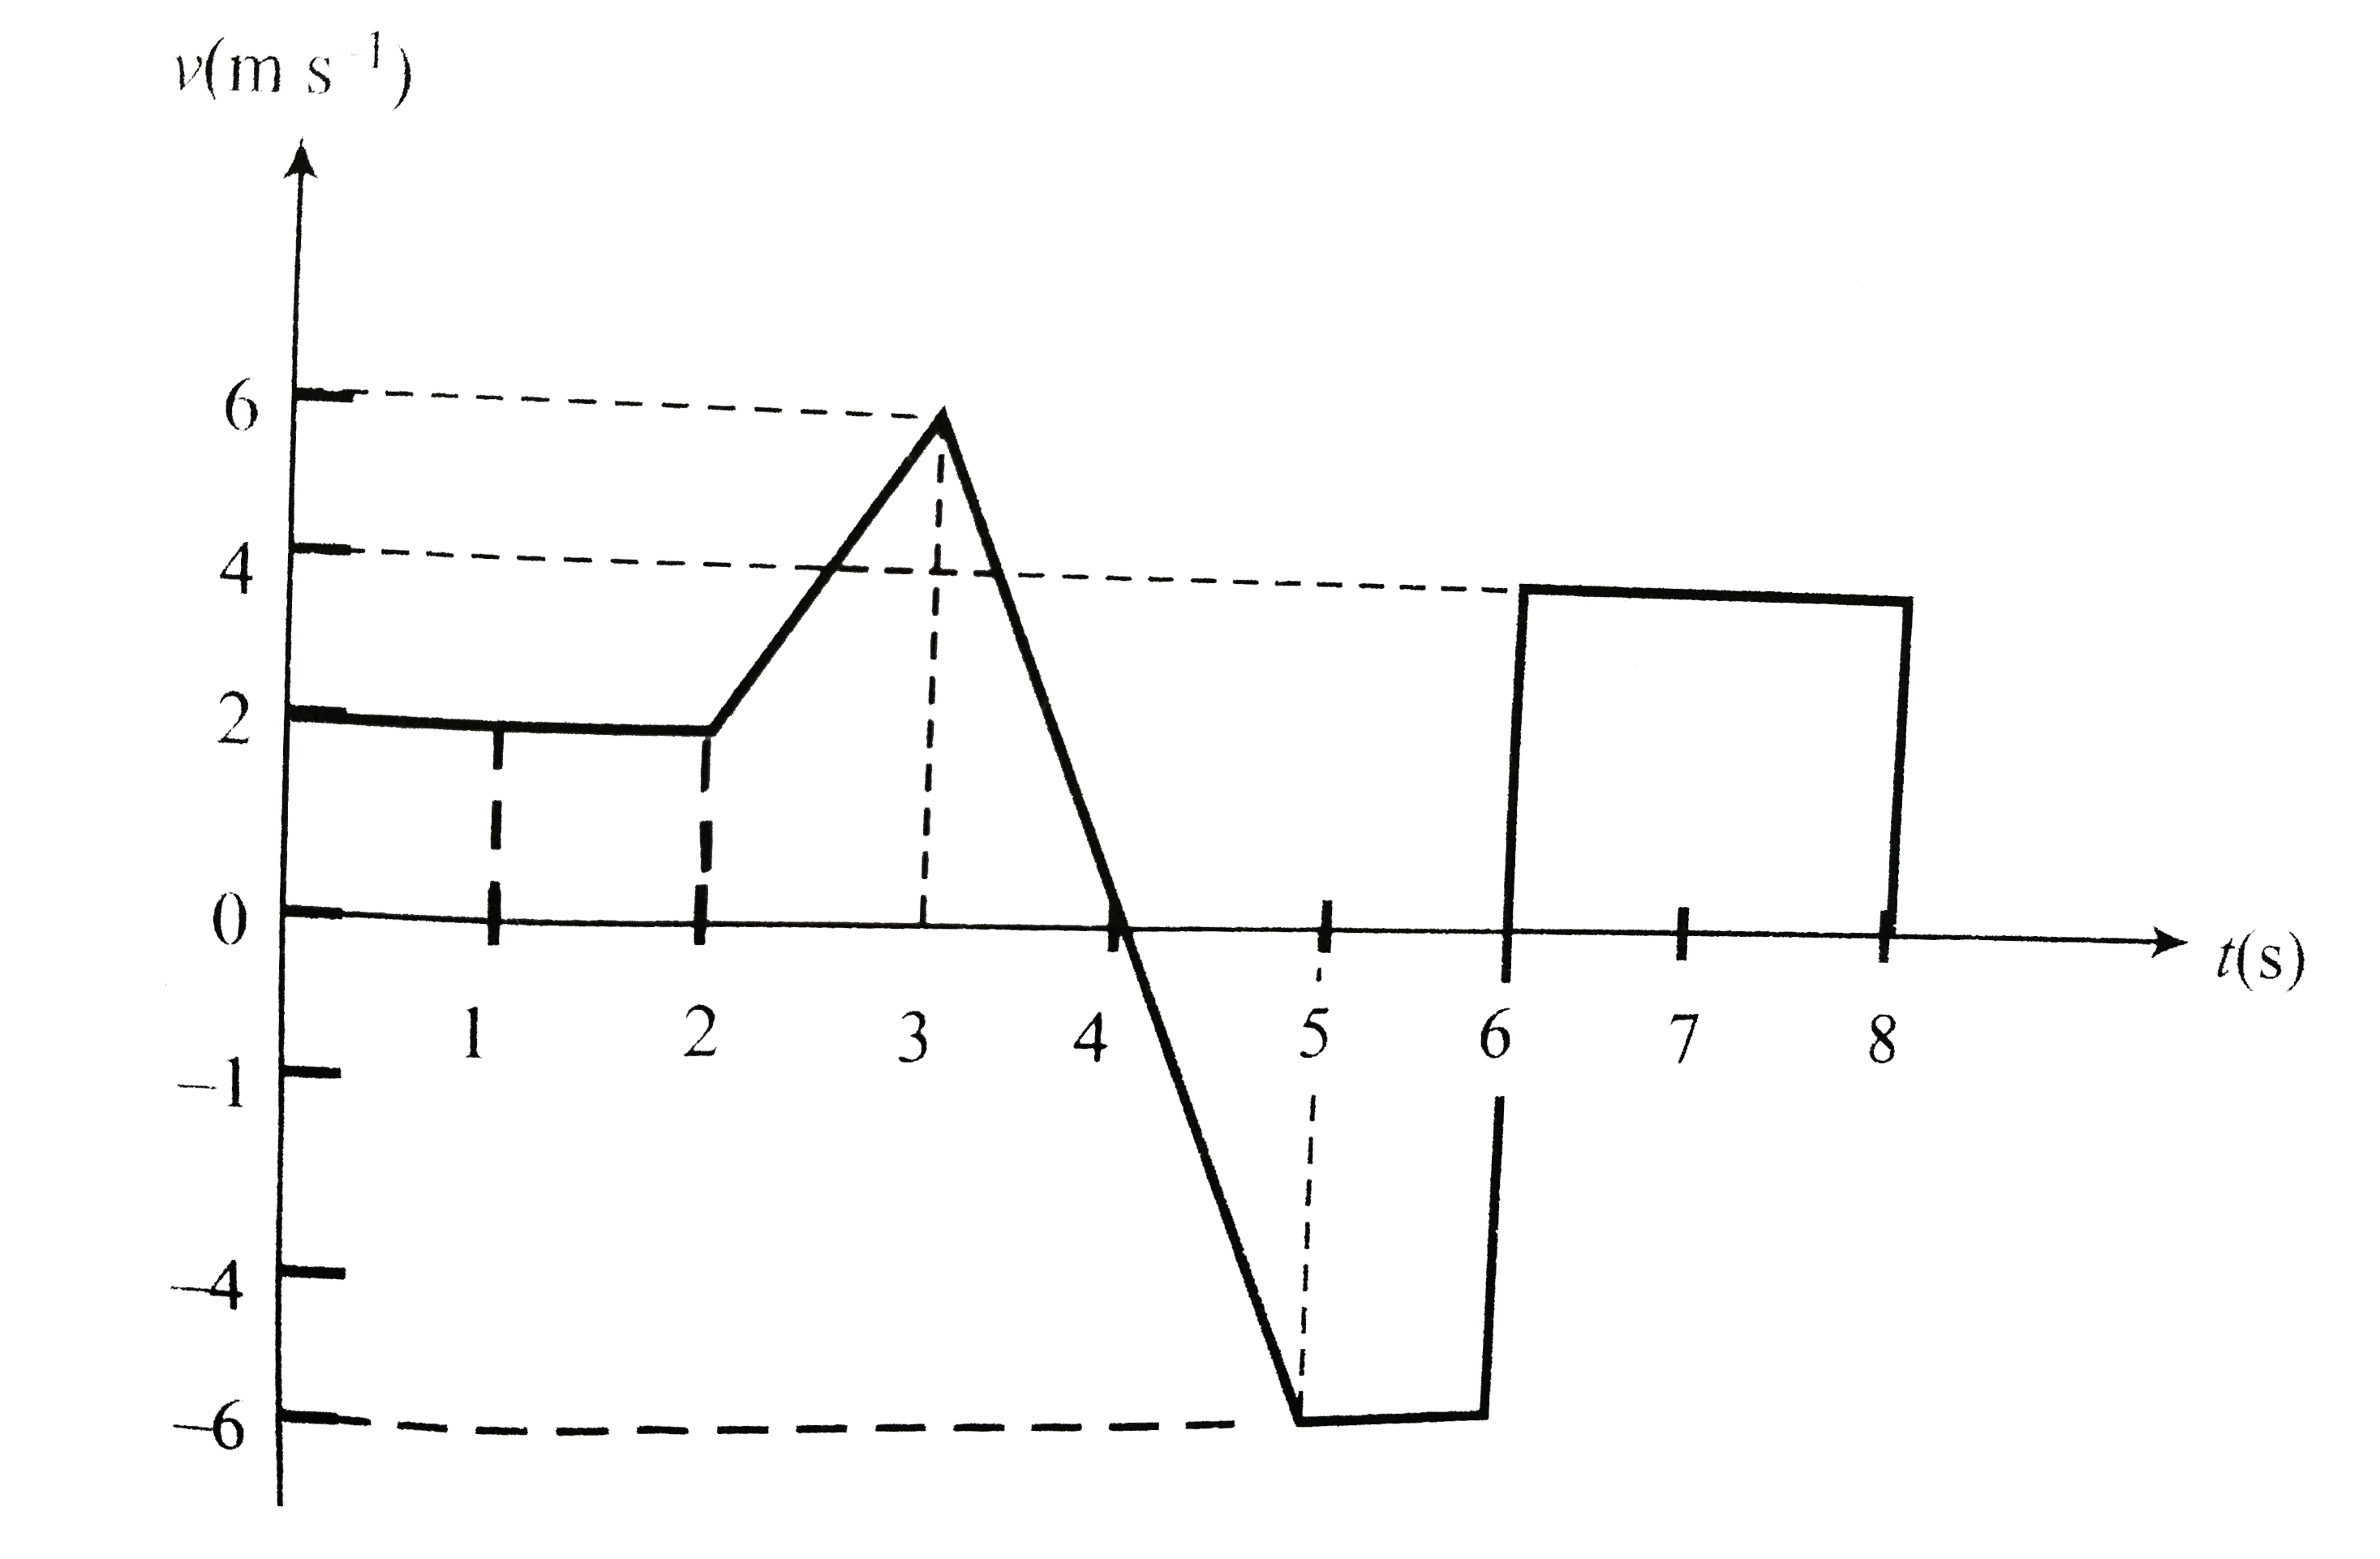 .A9mB12mC10mD28m
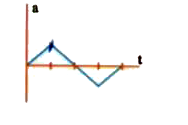
Which of the following v Vs t graph are correct representation for the acceleration Vs time graph shown below
 A
A B
B C
C D
D
The velocity of particle (whose displacement time graph is shown) at t=3
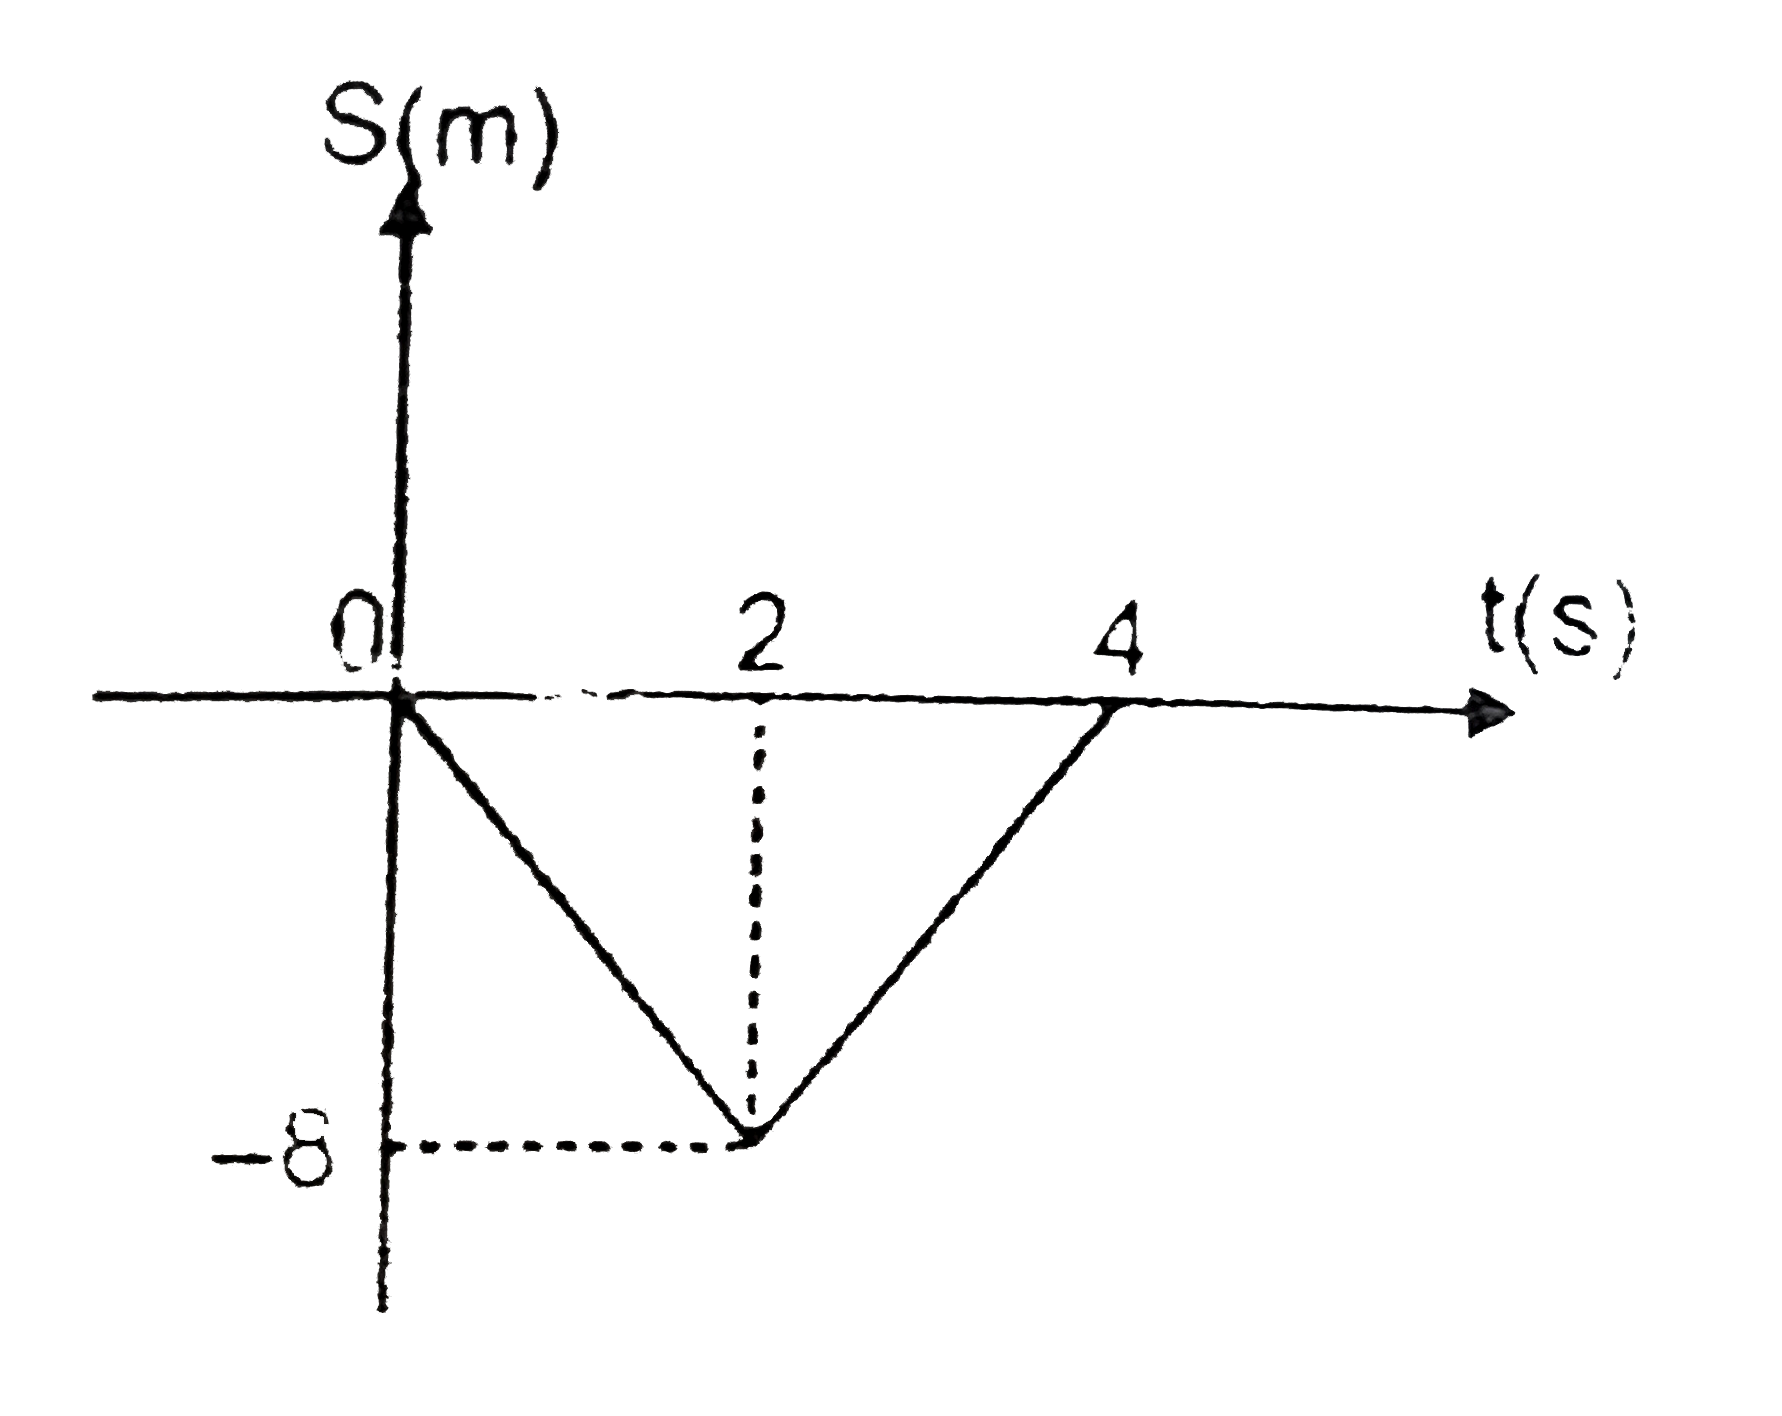 .
.
View Solution" Find corresponding velocity - time graph for given displacement-time graph "
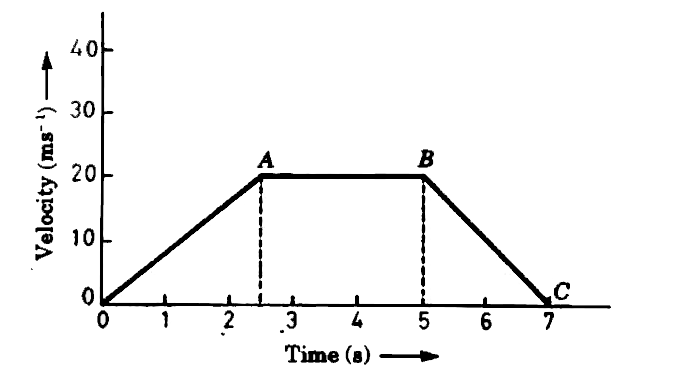
View Solutionthe velcoity - time graph for a vehicle is shown if fig 3.24. drow acceleration - time graph from it .
View SolutionAn object is thrown upward with a velocity u, then displacement -time graph is
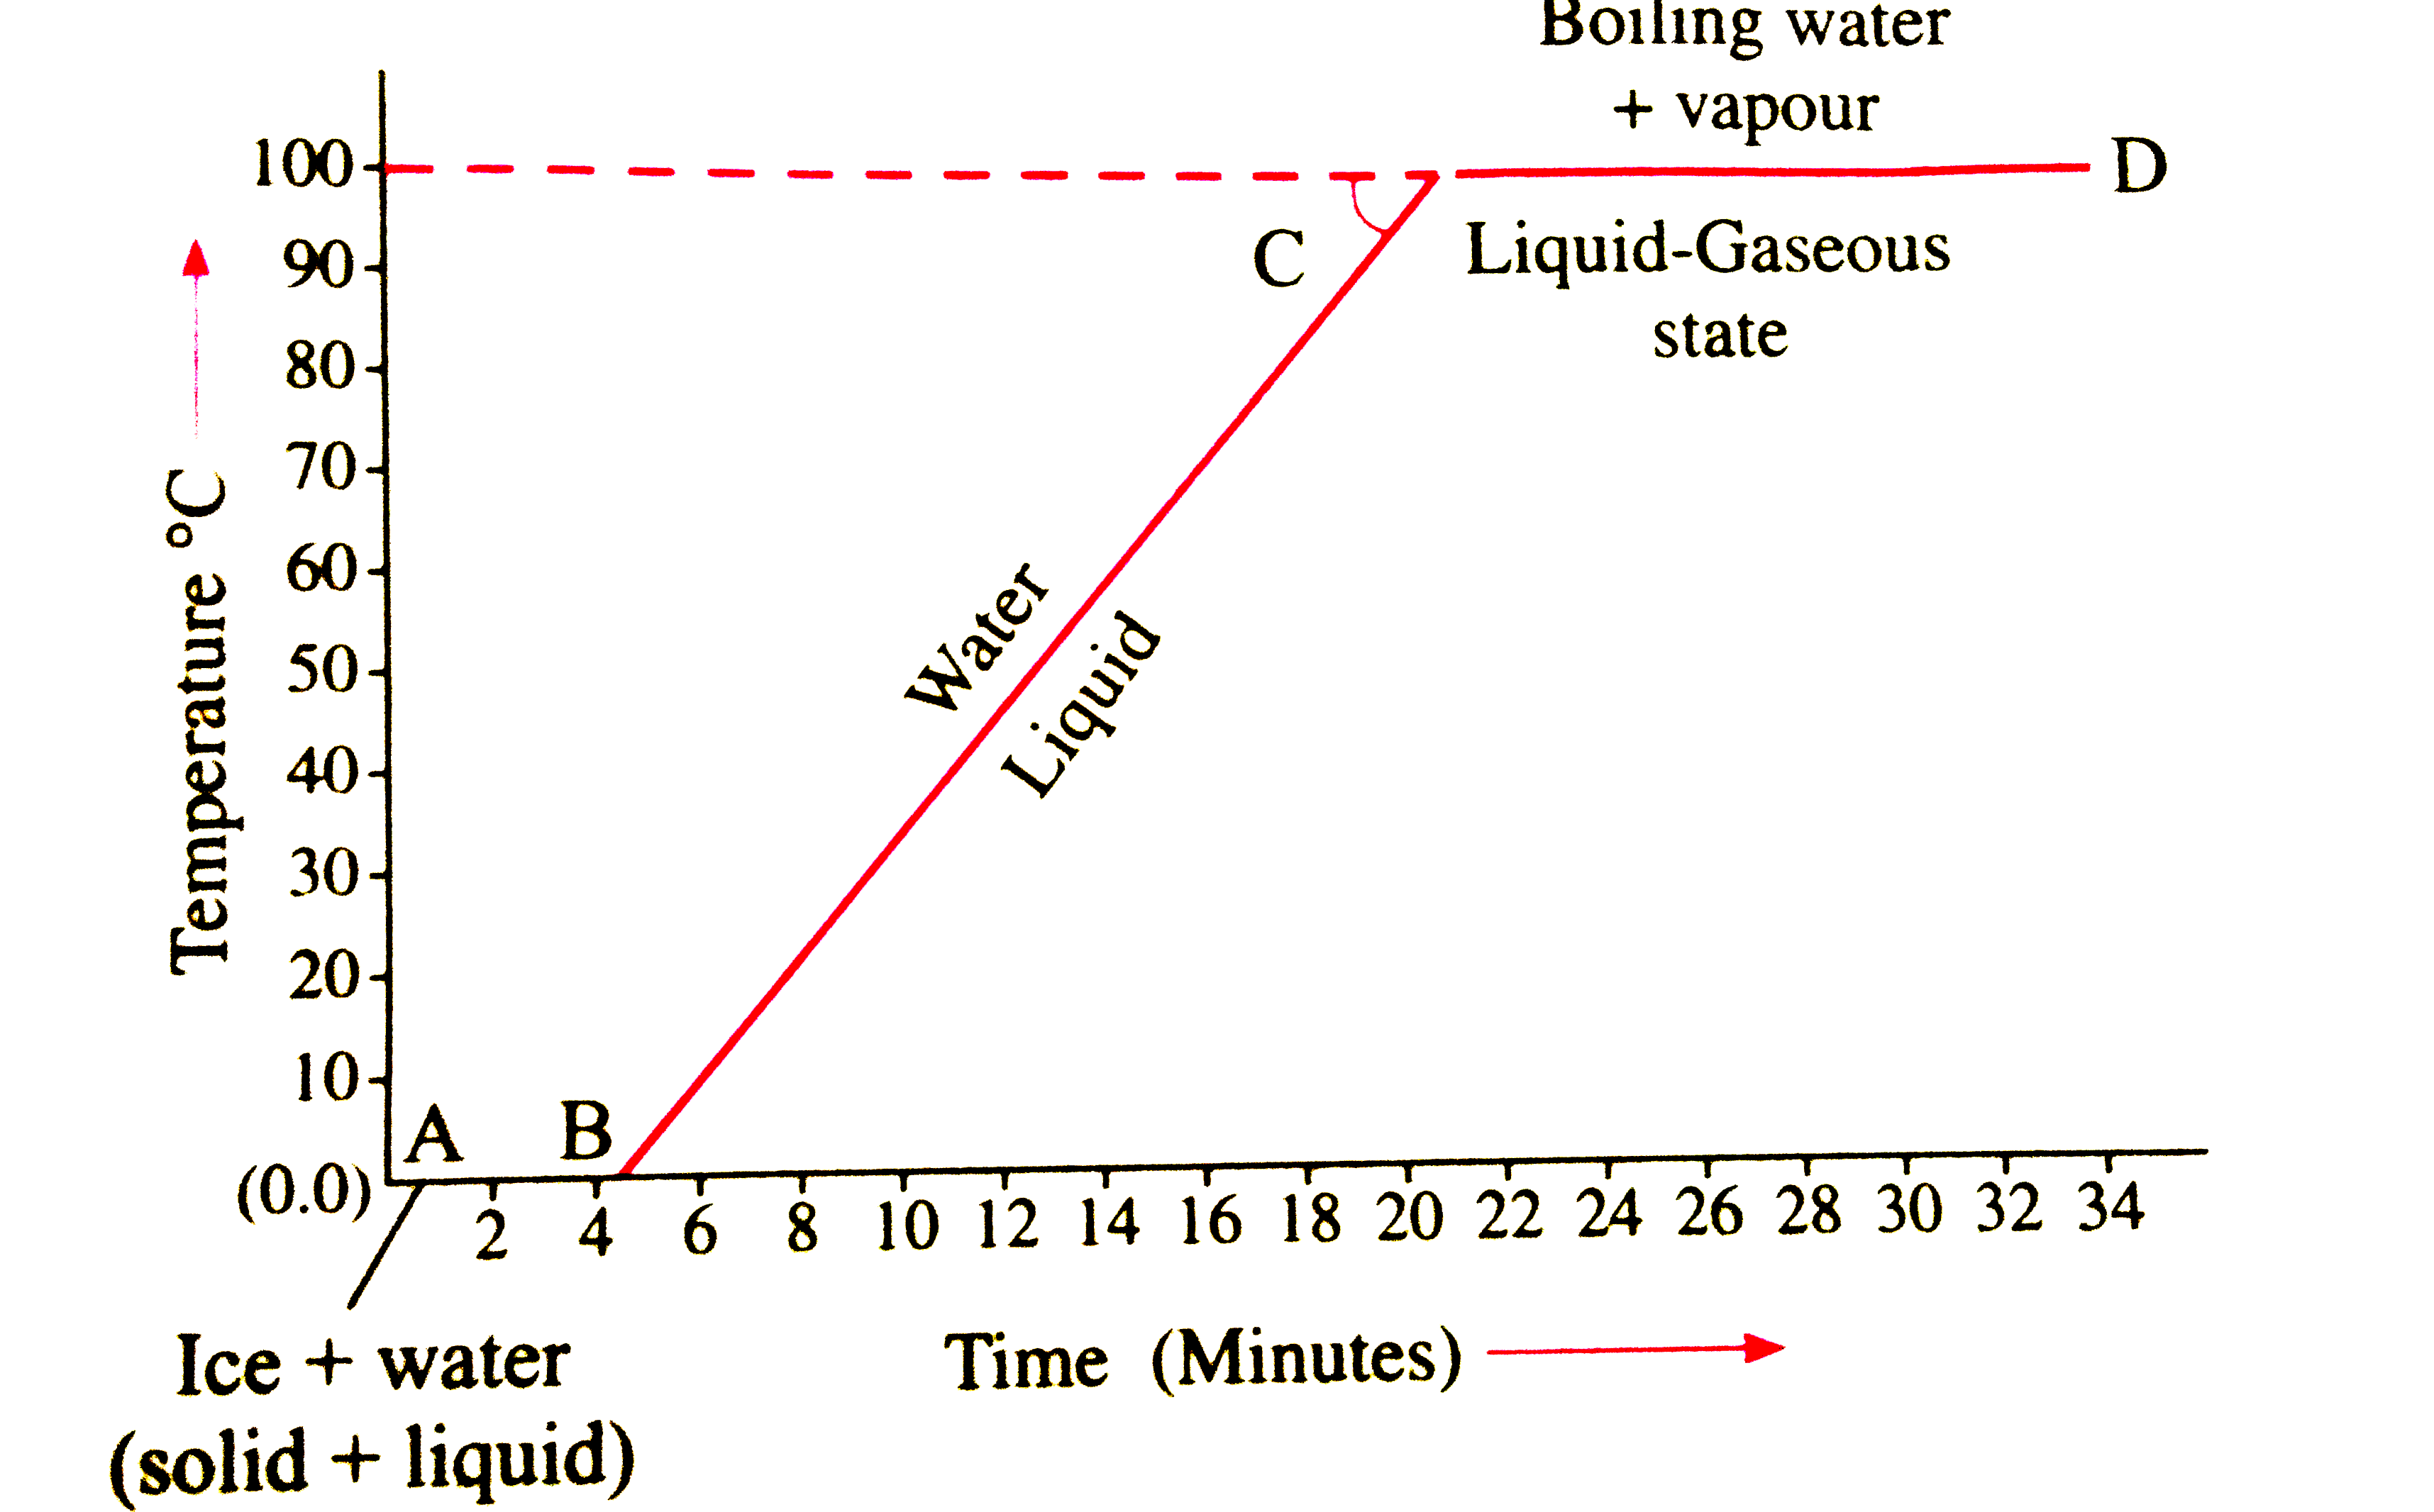
View SolutionExplain the following temperature Vs. time graph:
View Solution
