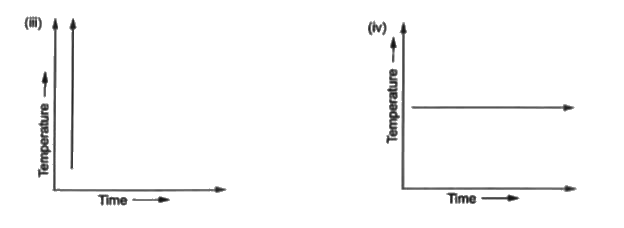
Explain the following temperature Vs. time graph:
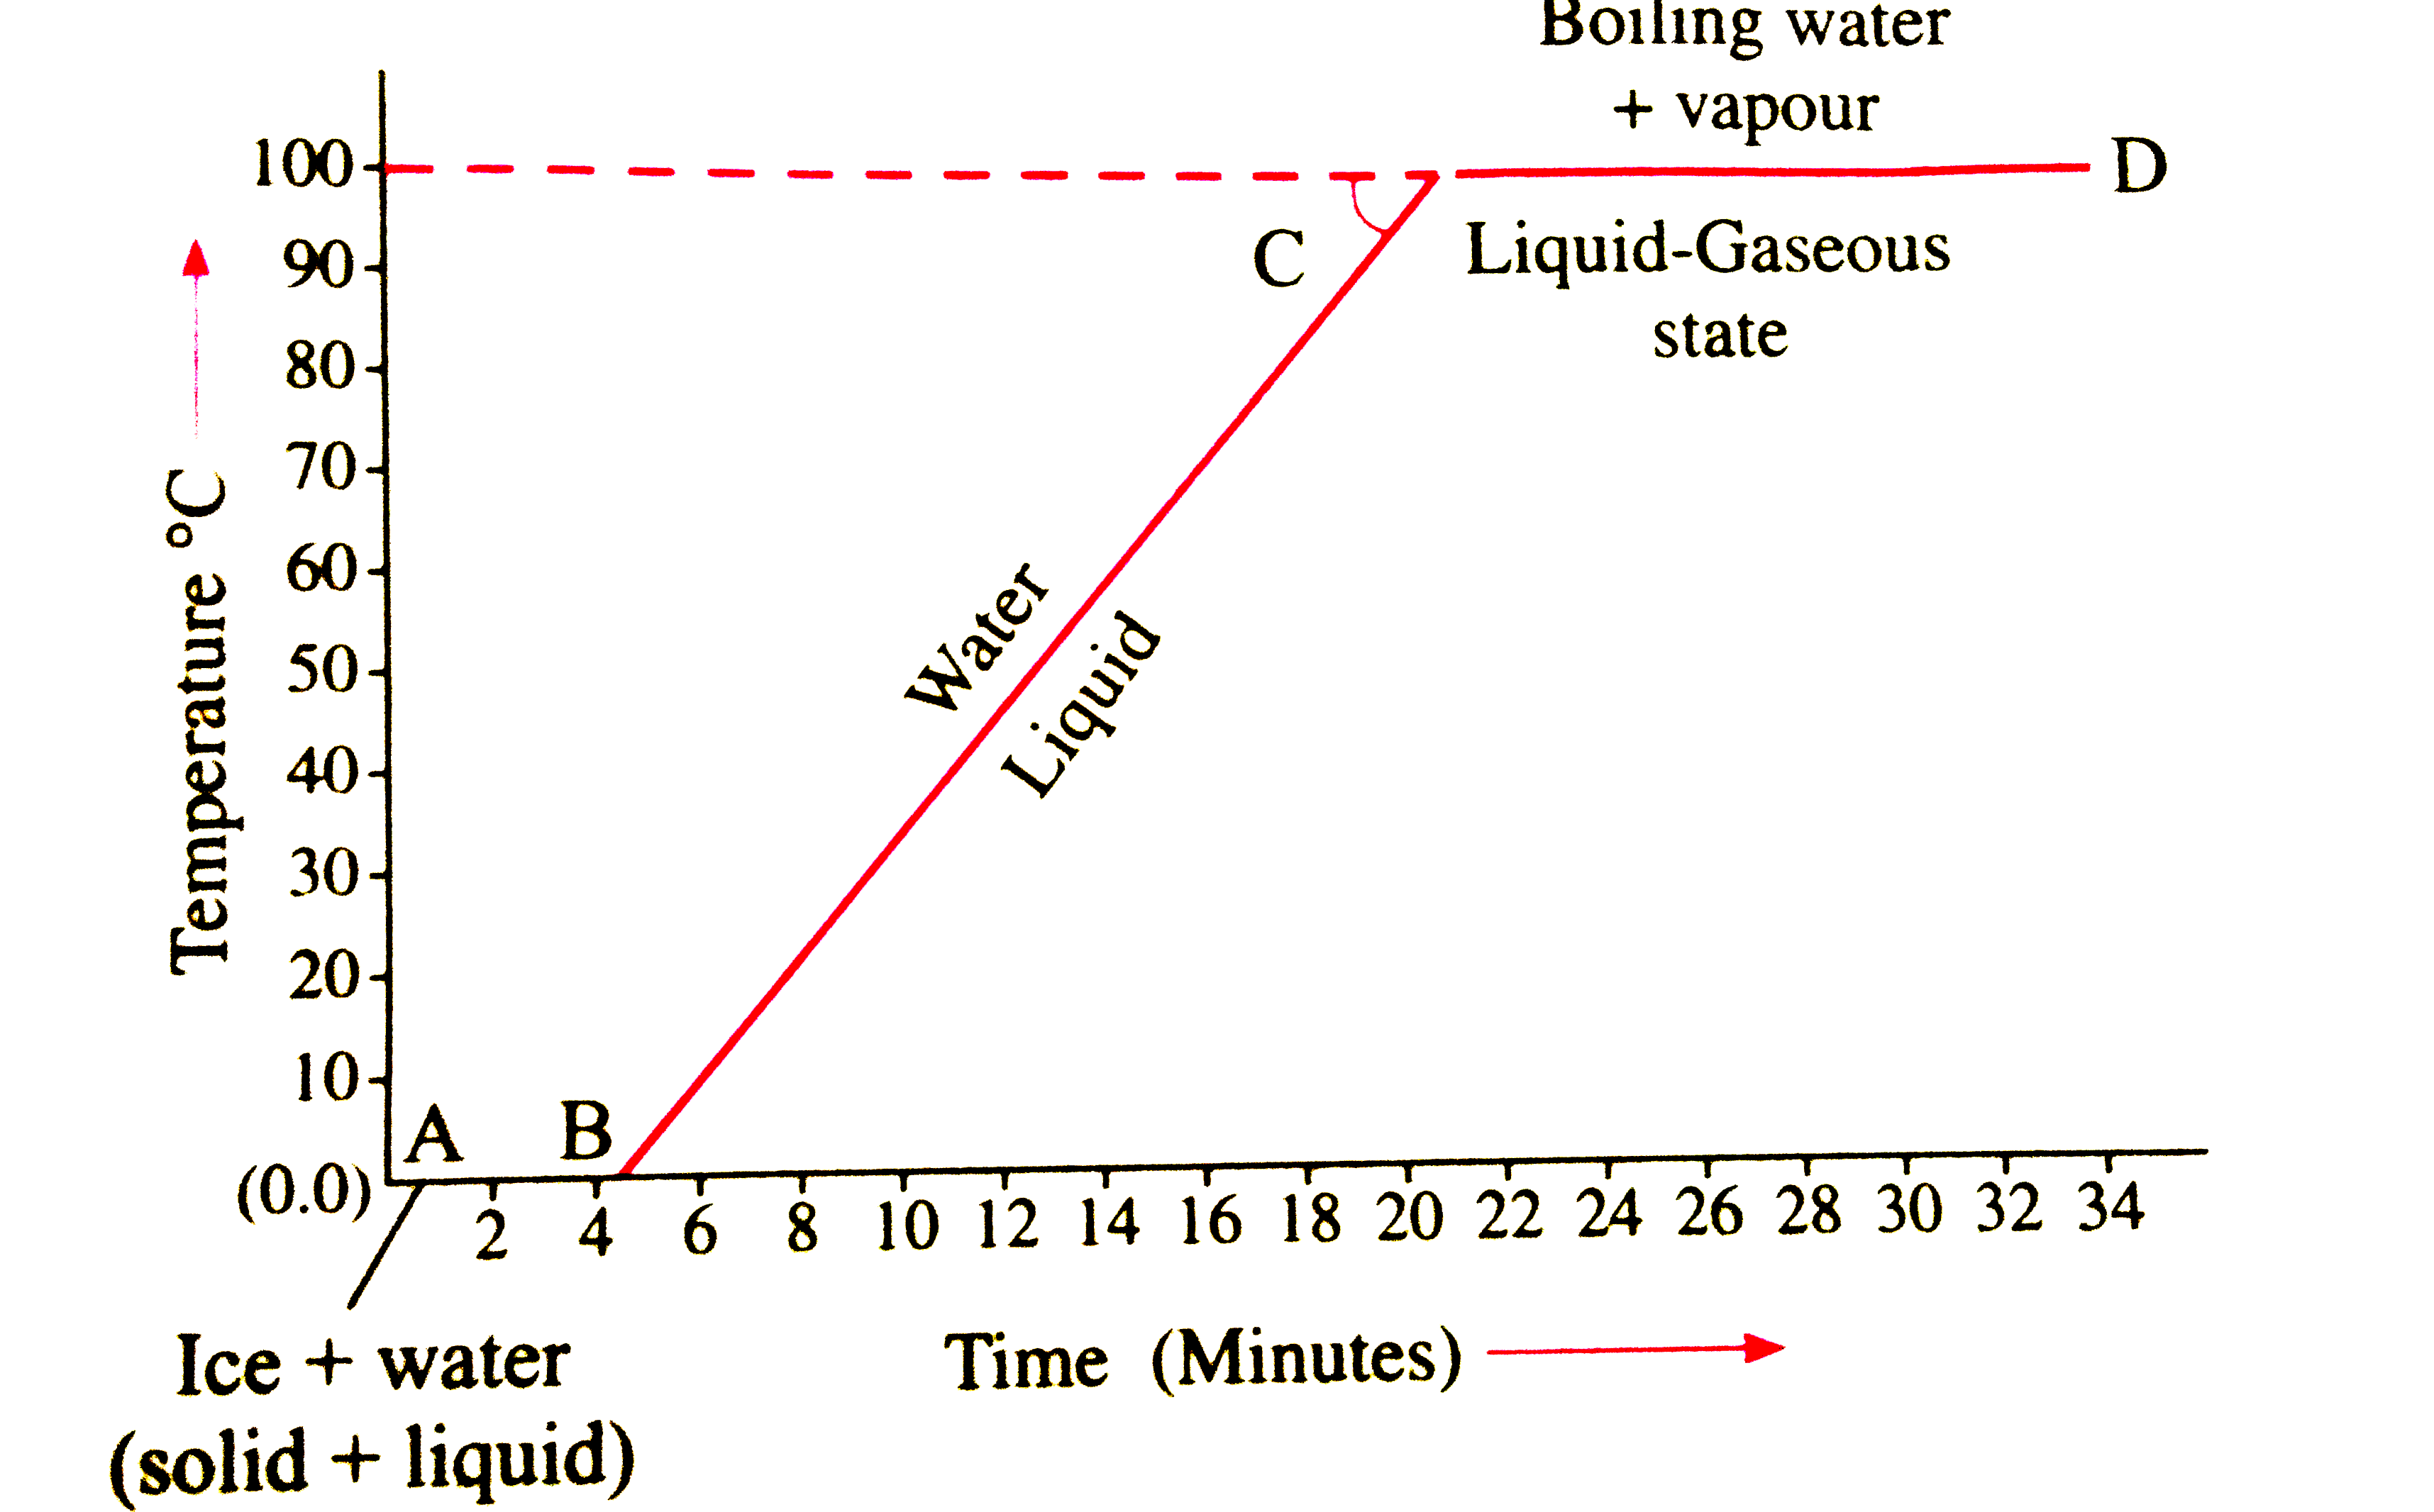
Step by step video & image solution for Explain the following temperature Vs. time graph: by Physics experts to help you in doubts & scoring excellent marks in Class 10 exams.
Updated on:21/07/2023Topper's Solved these Questions
- BOARD ACTIVITY SHEET:MARCH 2019BOOK - NAVNEET PUBLICATION - MAHARASHTRA BOARDCHAPTER - BOARD ACTIVITY SHEET:MARCH 2019EXERCISE - Answer any one of the following question (4)
3 Videos
- BOARD ACTIVITY SHEET:MARCH 2019BOOK - NAVNEET PUBLICATION - MAHARASHTRA BOARDCHAPTER - BOARD ACTIVITY SHEET:MARCH 2019EXERCISE - Attempt any five of the following question :(2)
5 Videos
- ANSWER THE QUESTIONSBOOK - NAVNEET PUBLICATION - MAHARASHTRA BOARDCHAPTER - ANSWER THE QUESTIONSEXERCISE - Disaster Management
7 Videos
- BOARD'S QUESTION PAPER (MARCH 2019)BOOK - NAVNEET PUBLICATION - MAHARASHTRA BOARDCHAPTER - BOARD'S QUESTION PAPER (MARCH 2019)EXERCISE - QUESTIONS
4 Videos
Similar Questions
Knowledge Check
For the following temperature-time graph, in which region the state of material changes
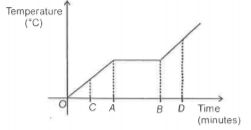 AOCBABCBODCA
Which of the substances A, B or C has the highest specific heat ? The temperature vs time graph is shown
 AABBCCDAll have equal specific heat
In the following displacement (x) vs time (t) graph, at which among the point P,Q and R is the object speed increasing ?
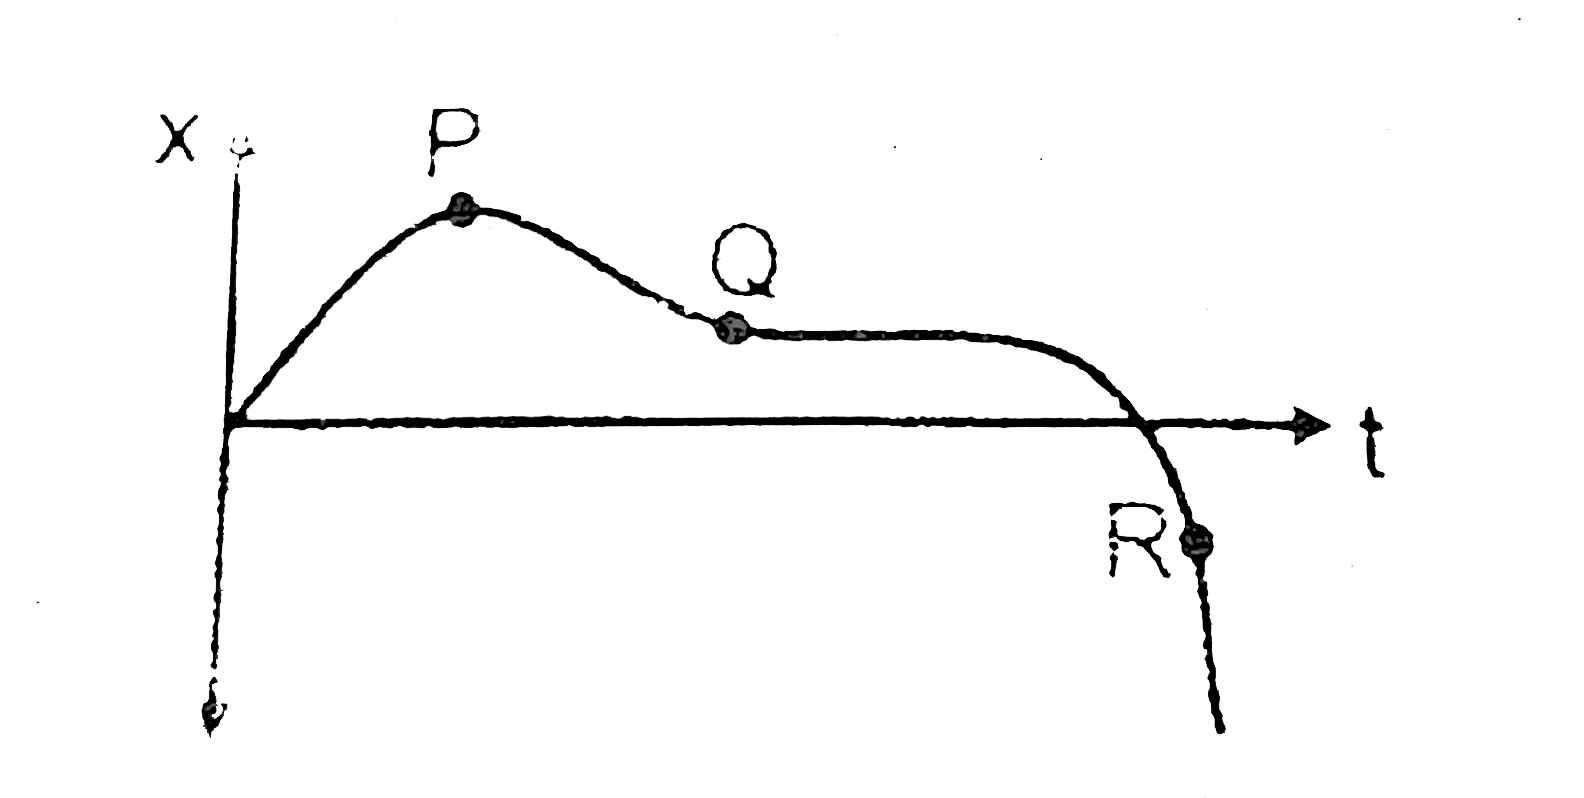 AR onlyBP onlyCQ and R onlyDP,Q,R
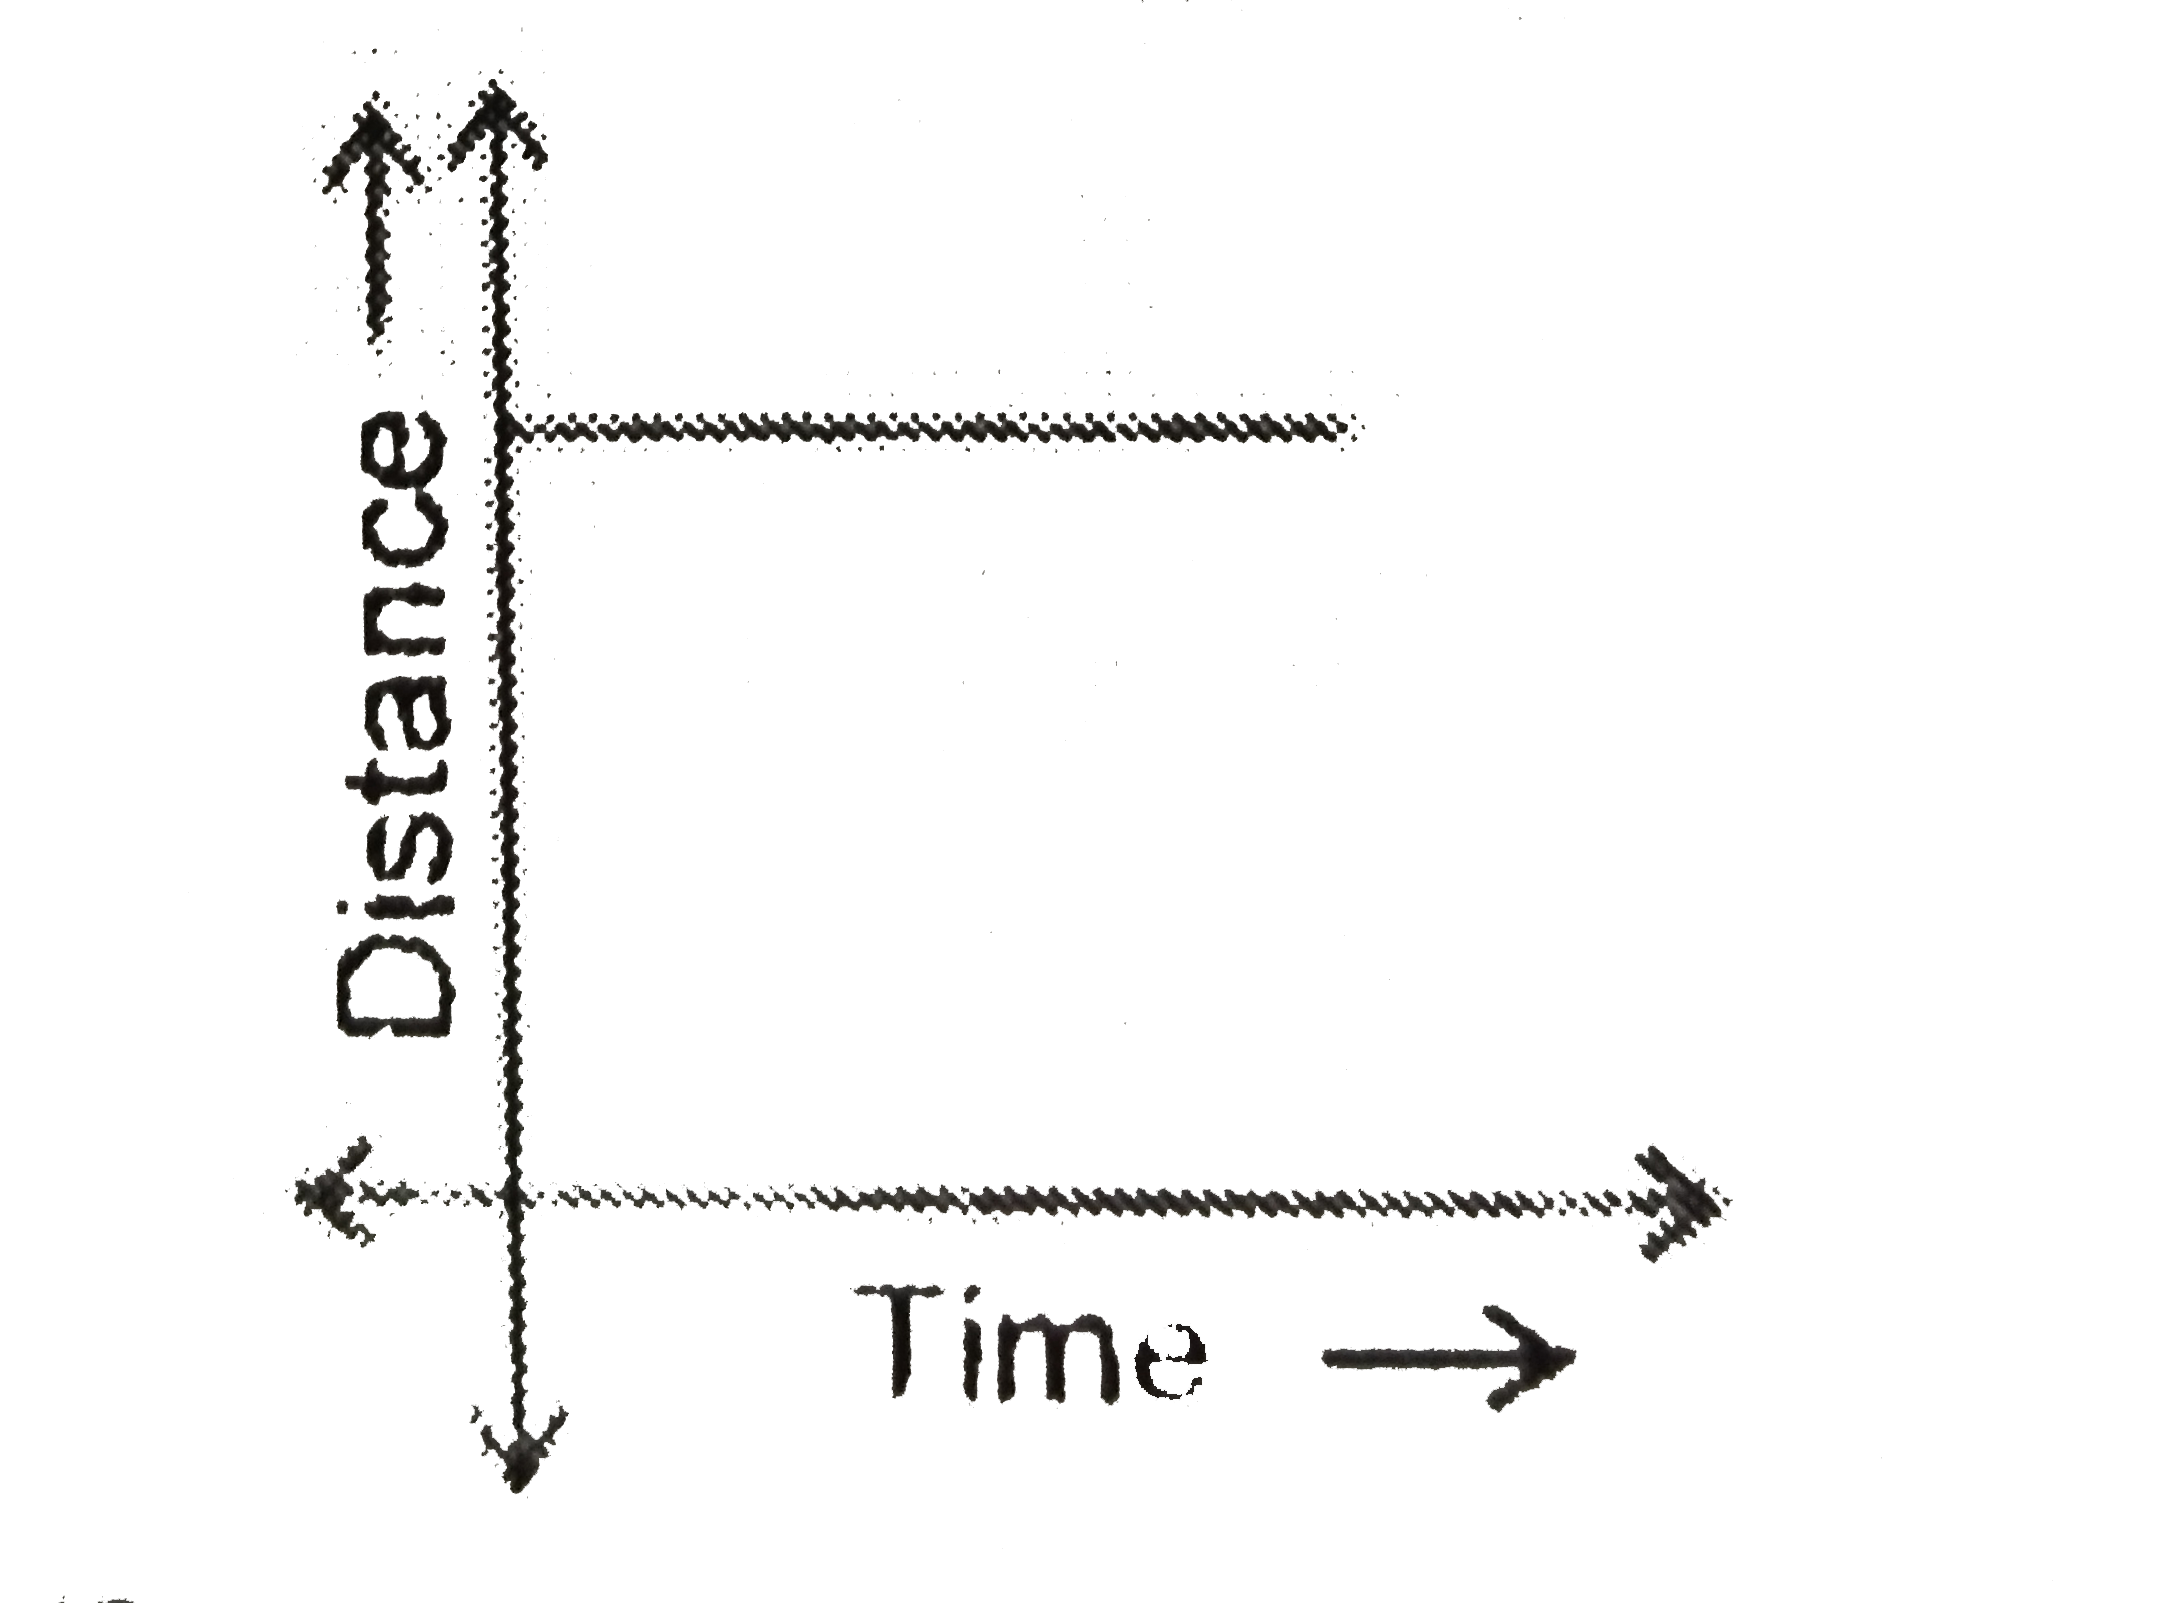
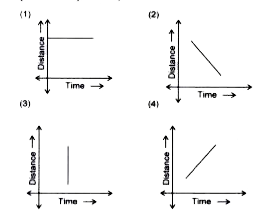
Which of the following distance - time graph is not possbile ? Explain why?
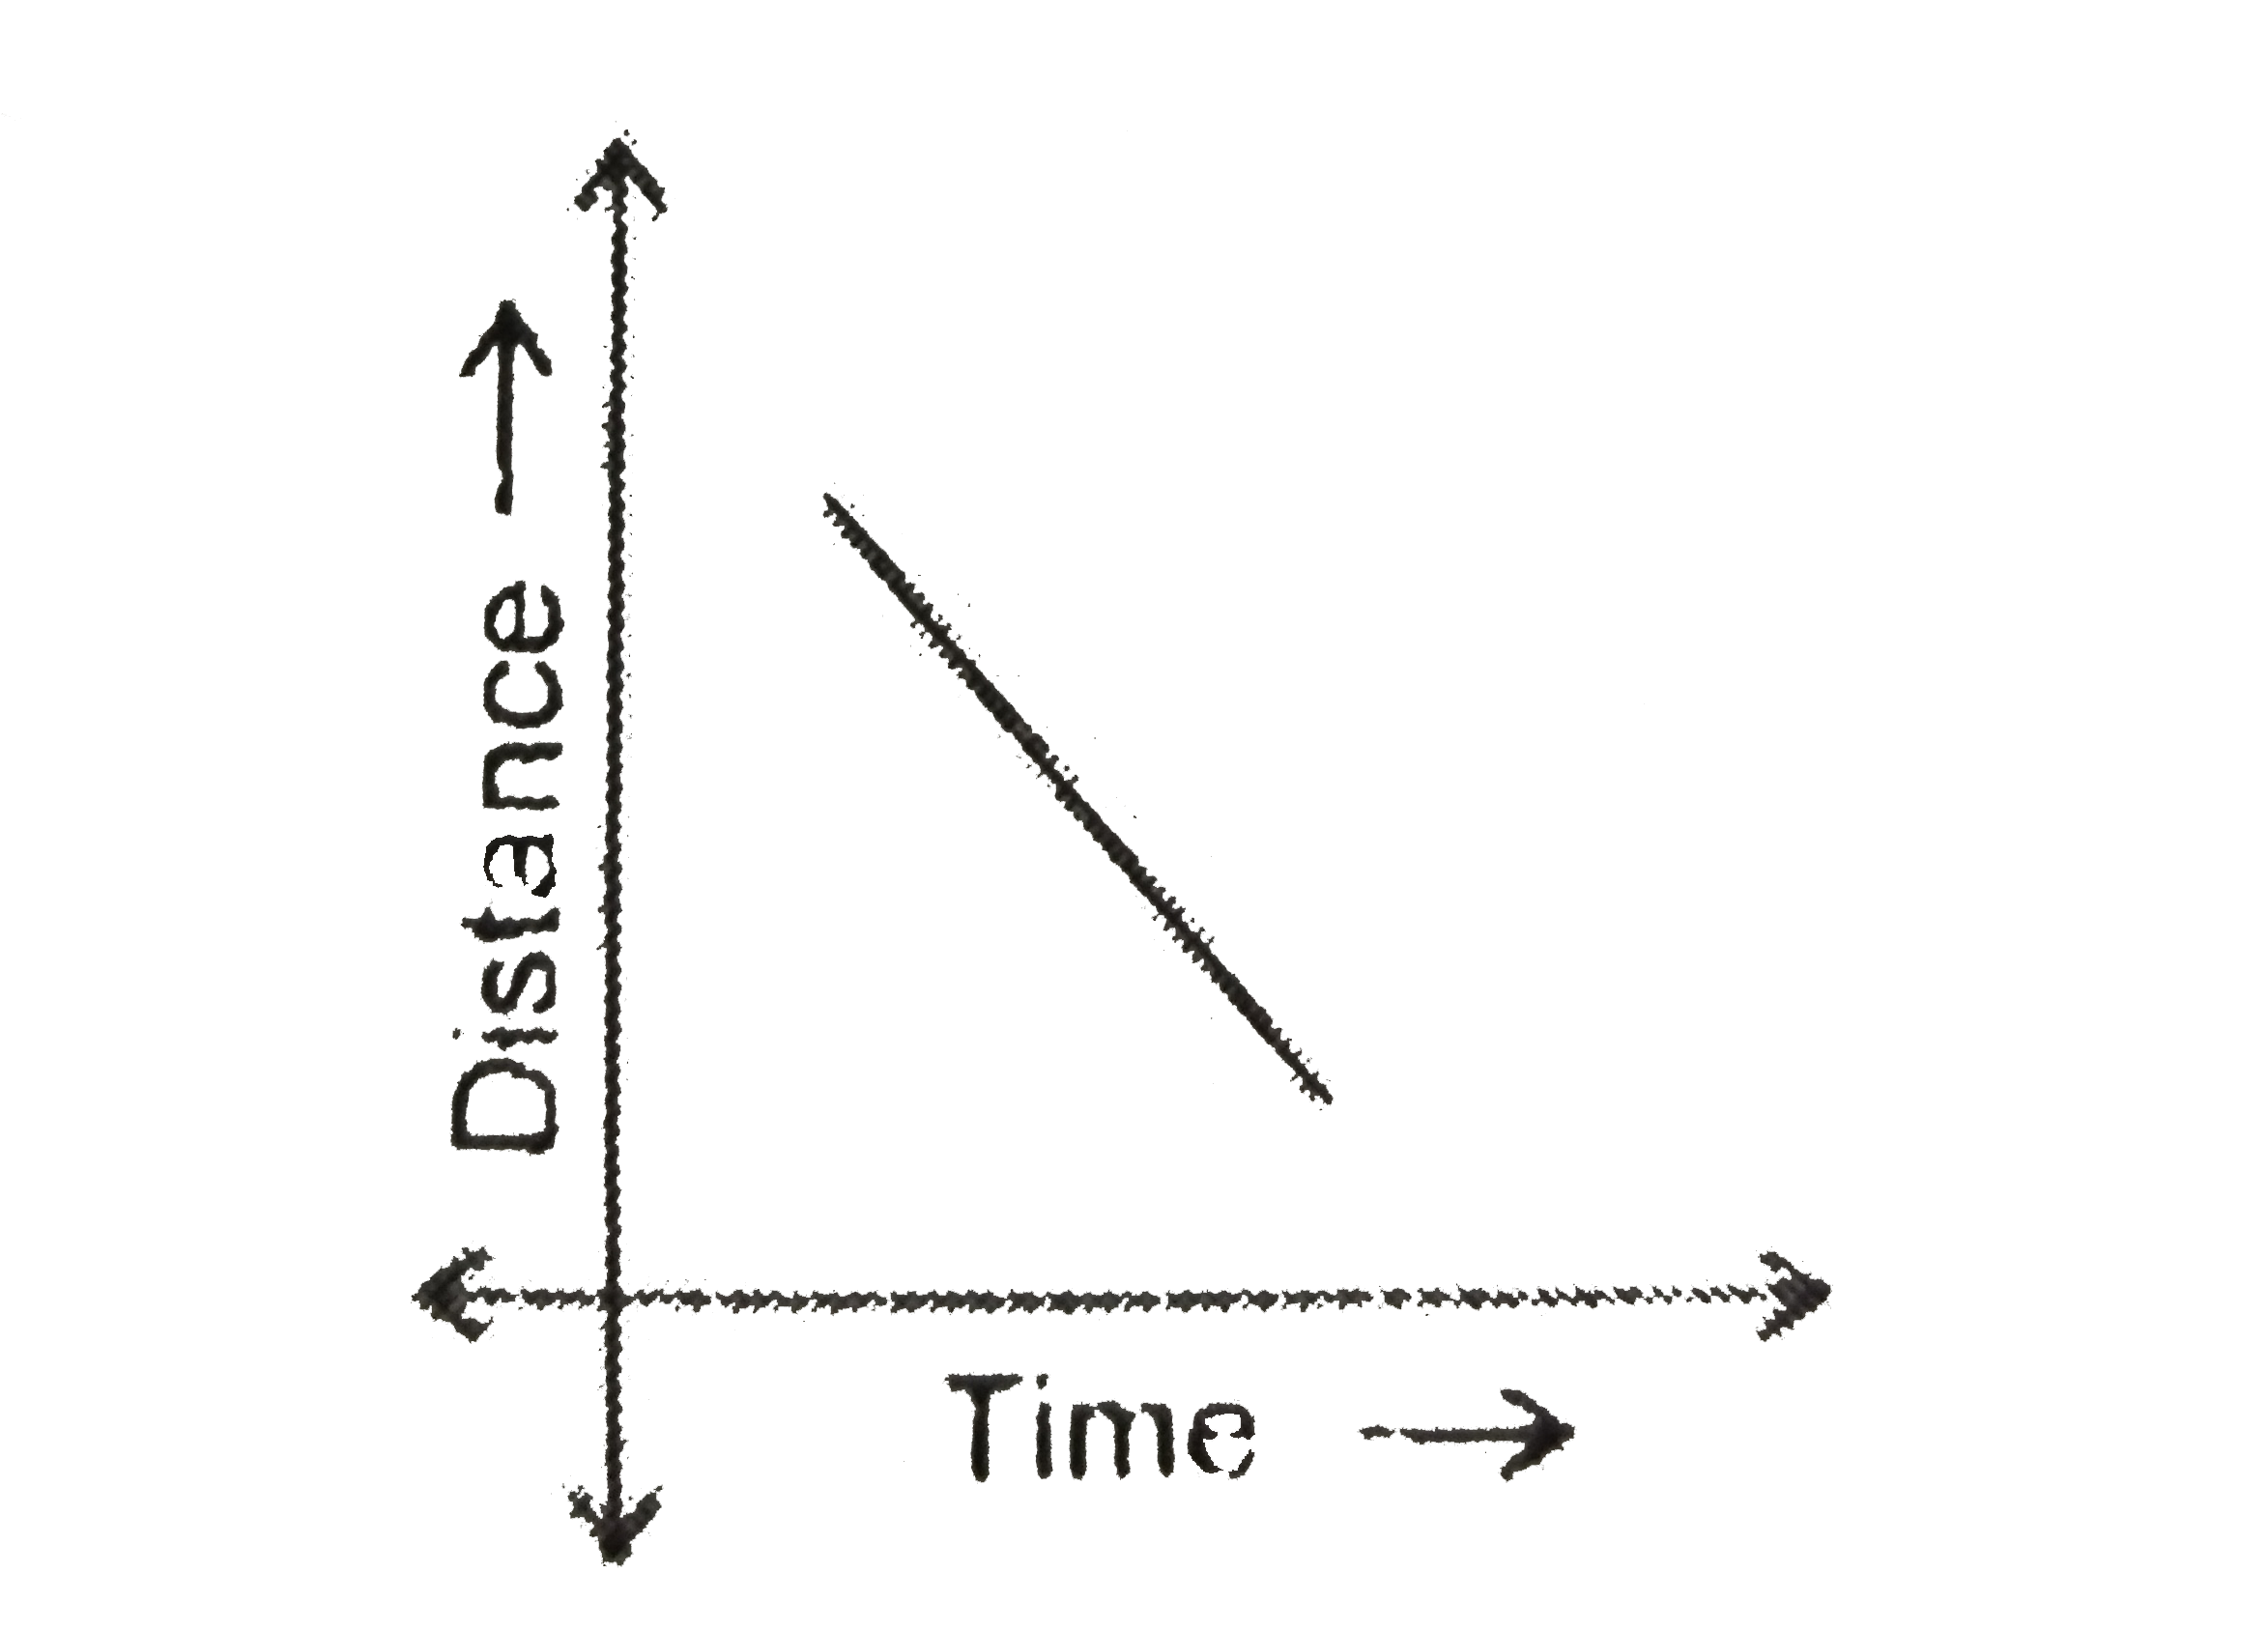
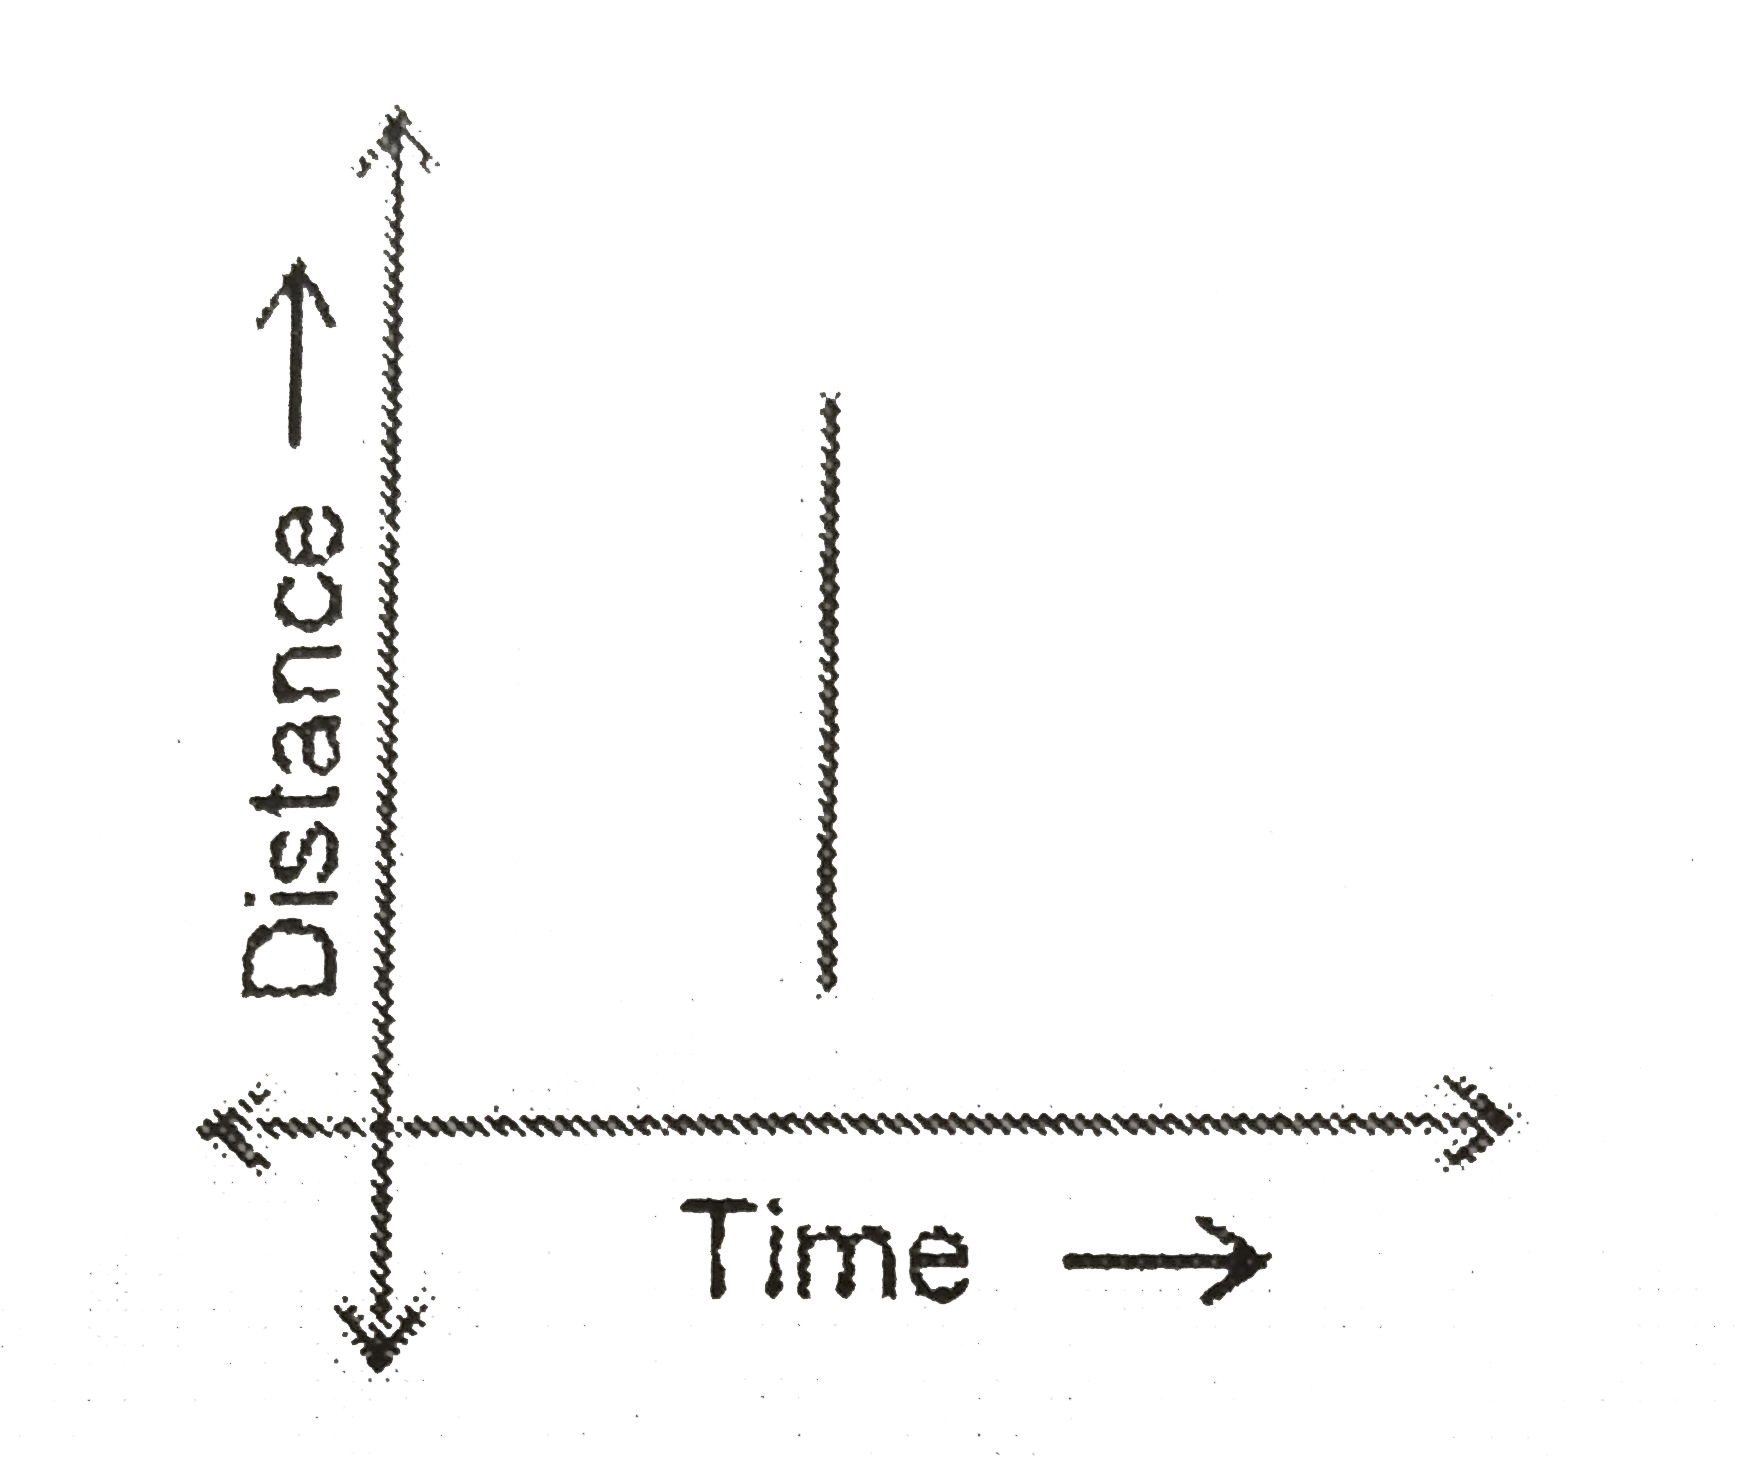
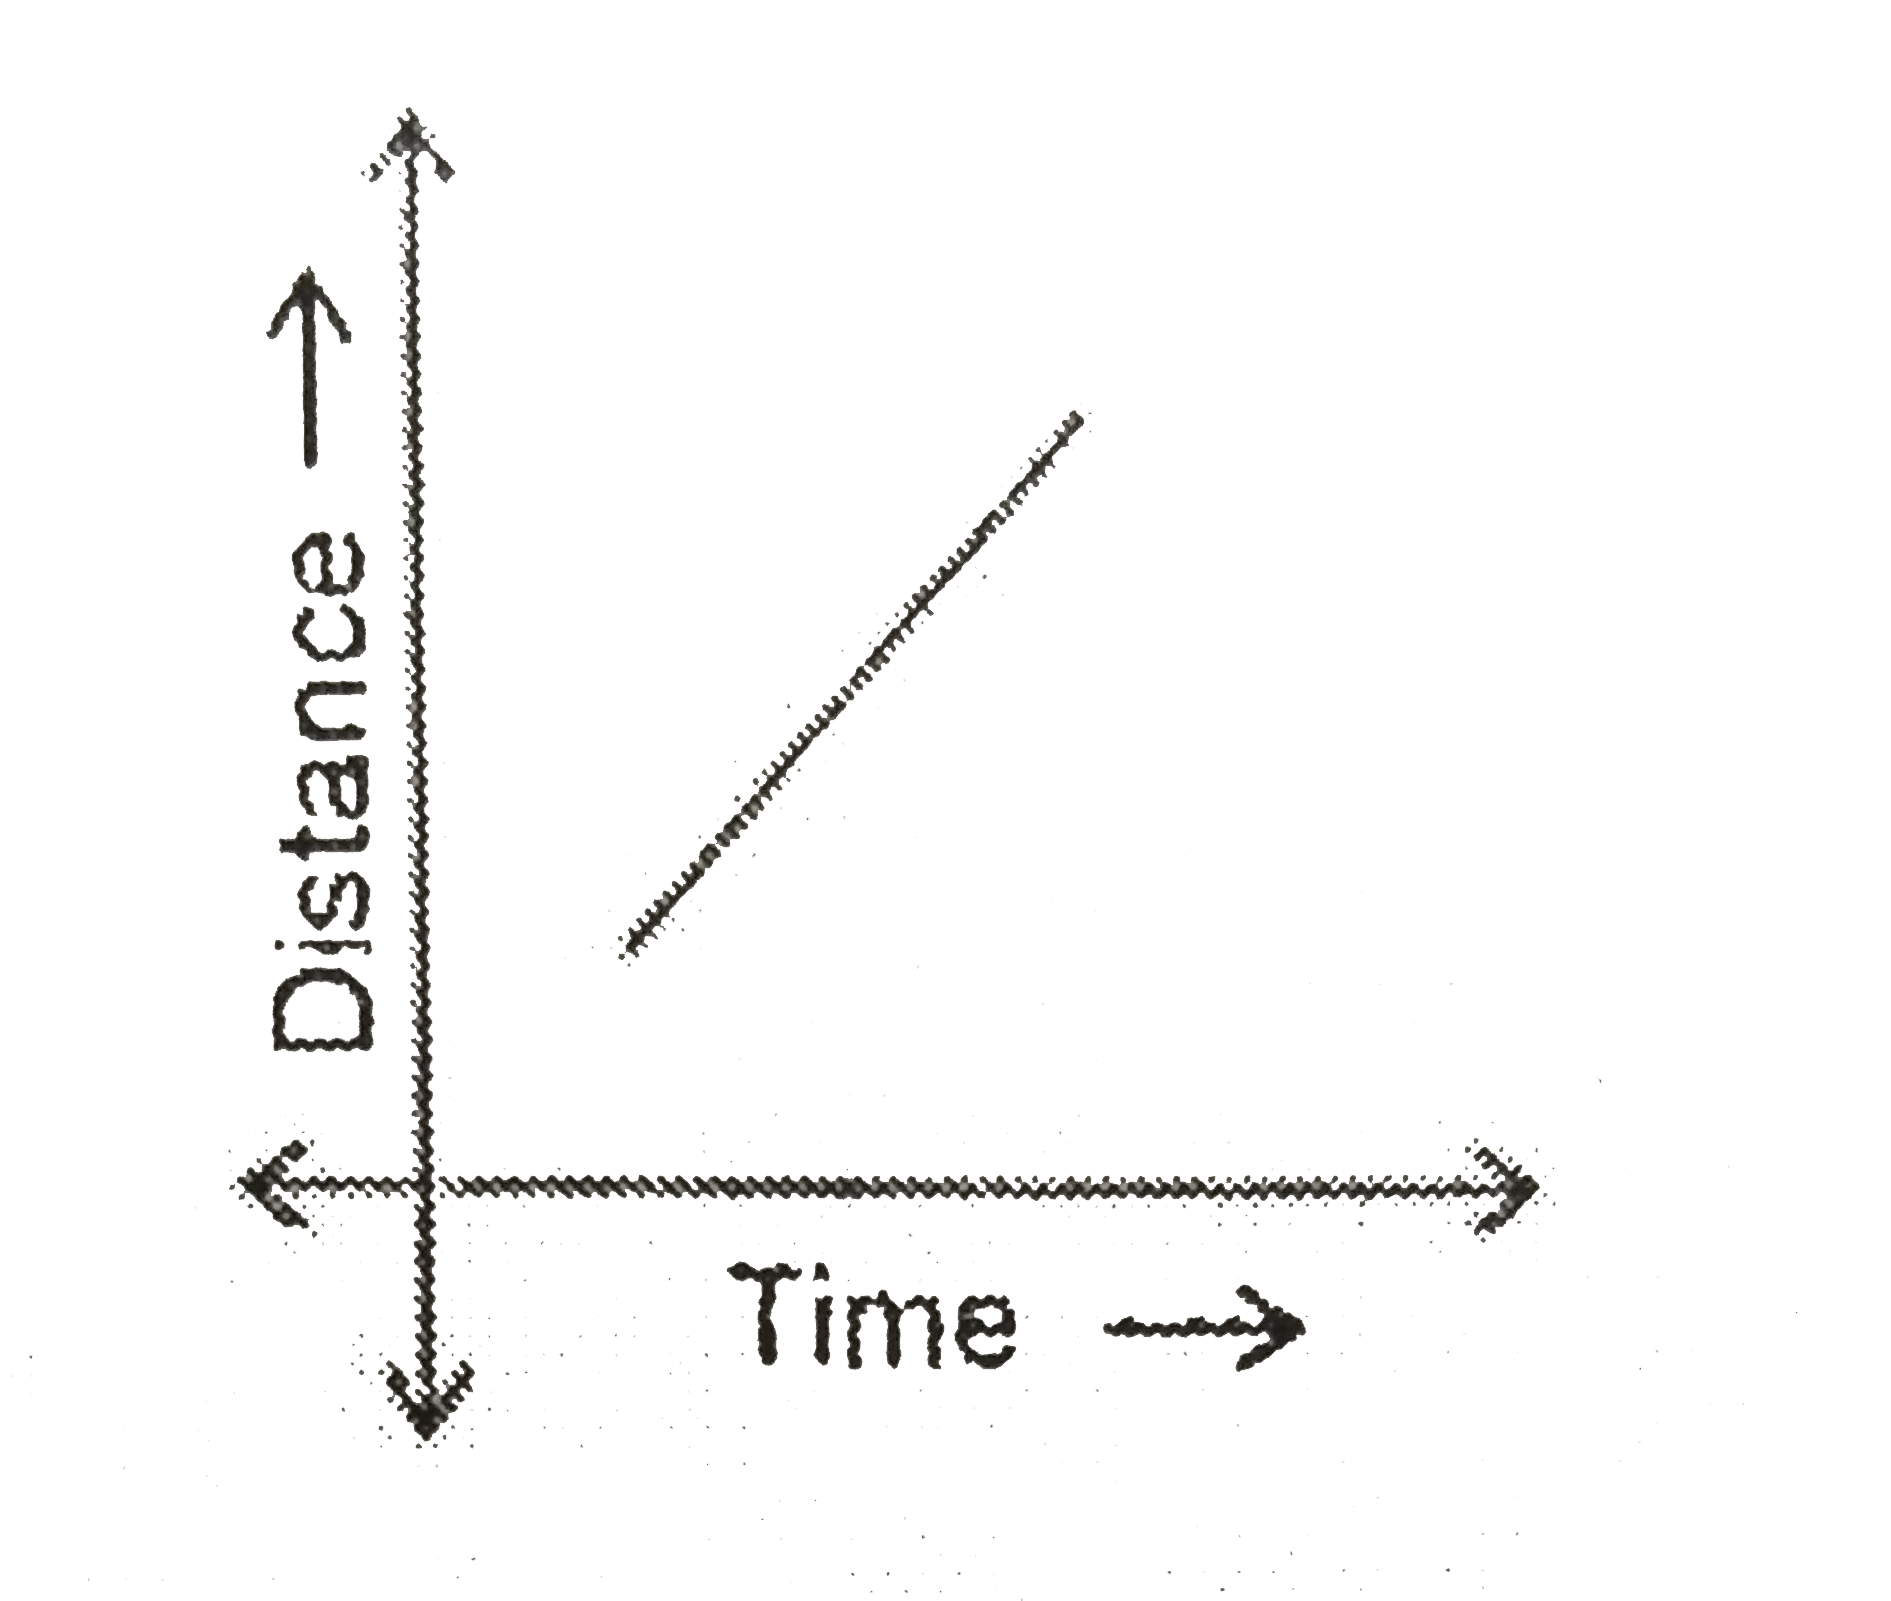
View SolutionWhat could be explained from the straight horizontal line observed at the beginning and end of the temperature v/s time graph of water when heated continuously and uniformly?
View SolutionCan there be a temperature- time graph as follows ? Justify your answer.
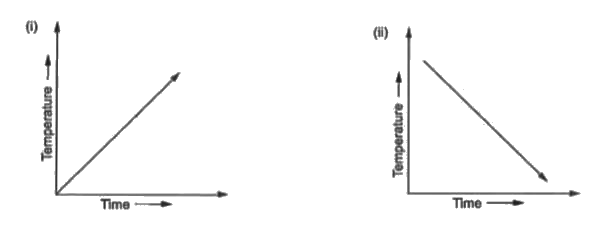
View SolutionWhich of the following distance-time graphs is not possible? Explain why?
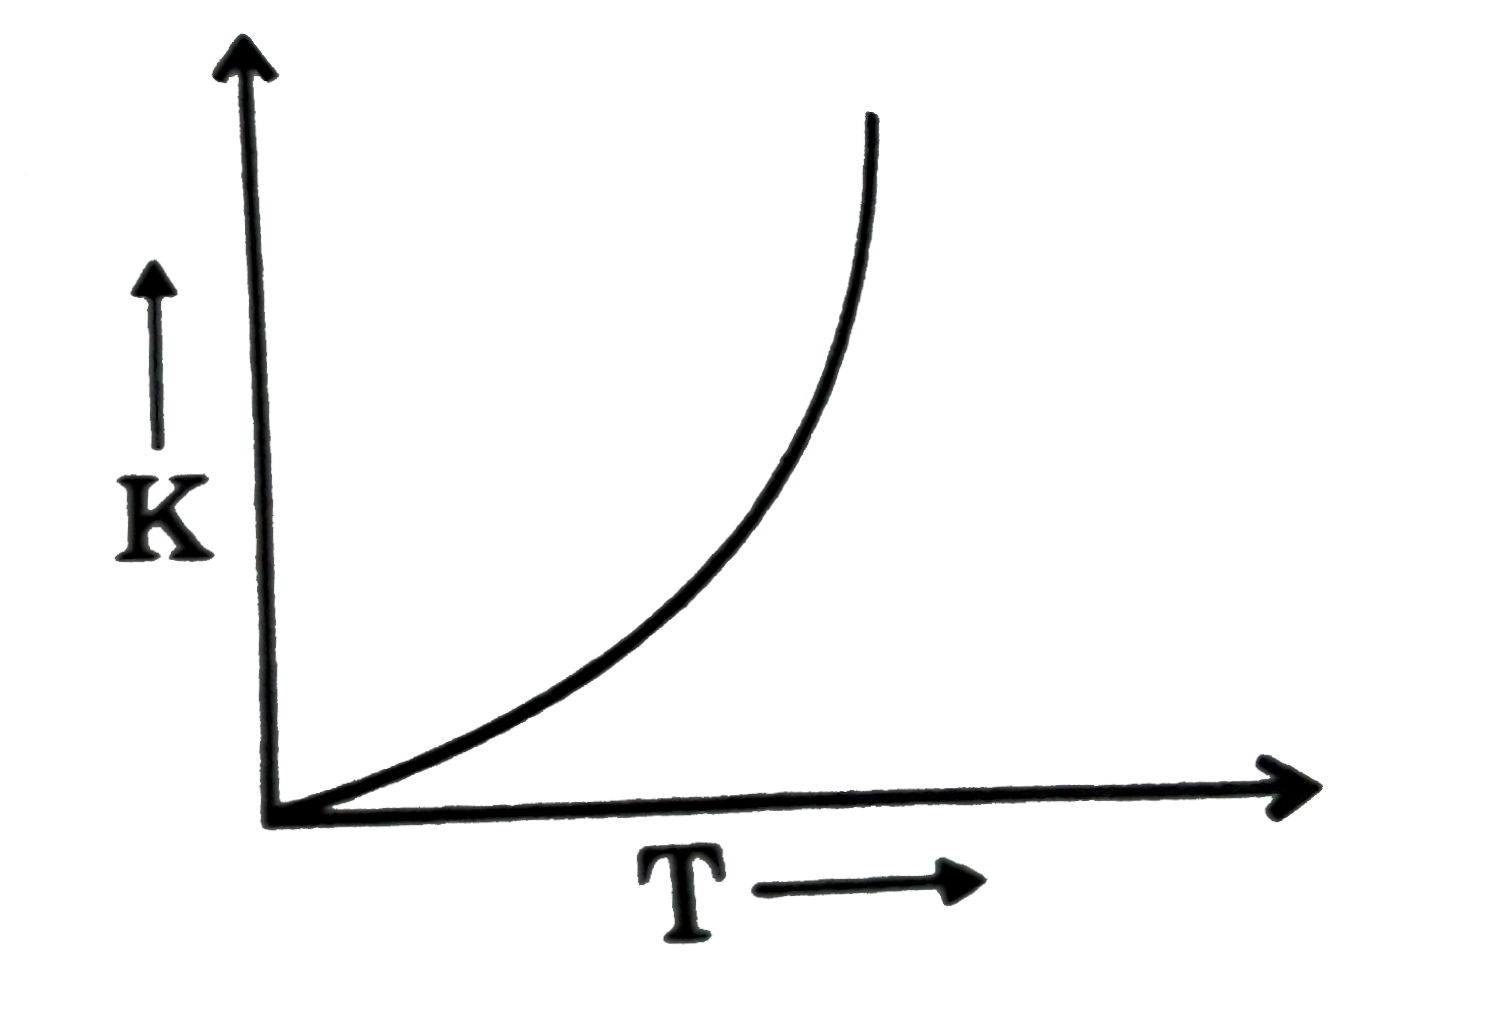
View SolutionRate constant vs temperature graph looks like: If the activation energy for the reaction is 100 kJ/mol, then what is the maximum temperature for this graph trend to be valid ? (R=253J/mol/K)
View Solution
