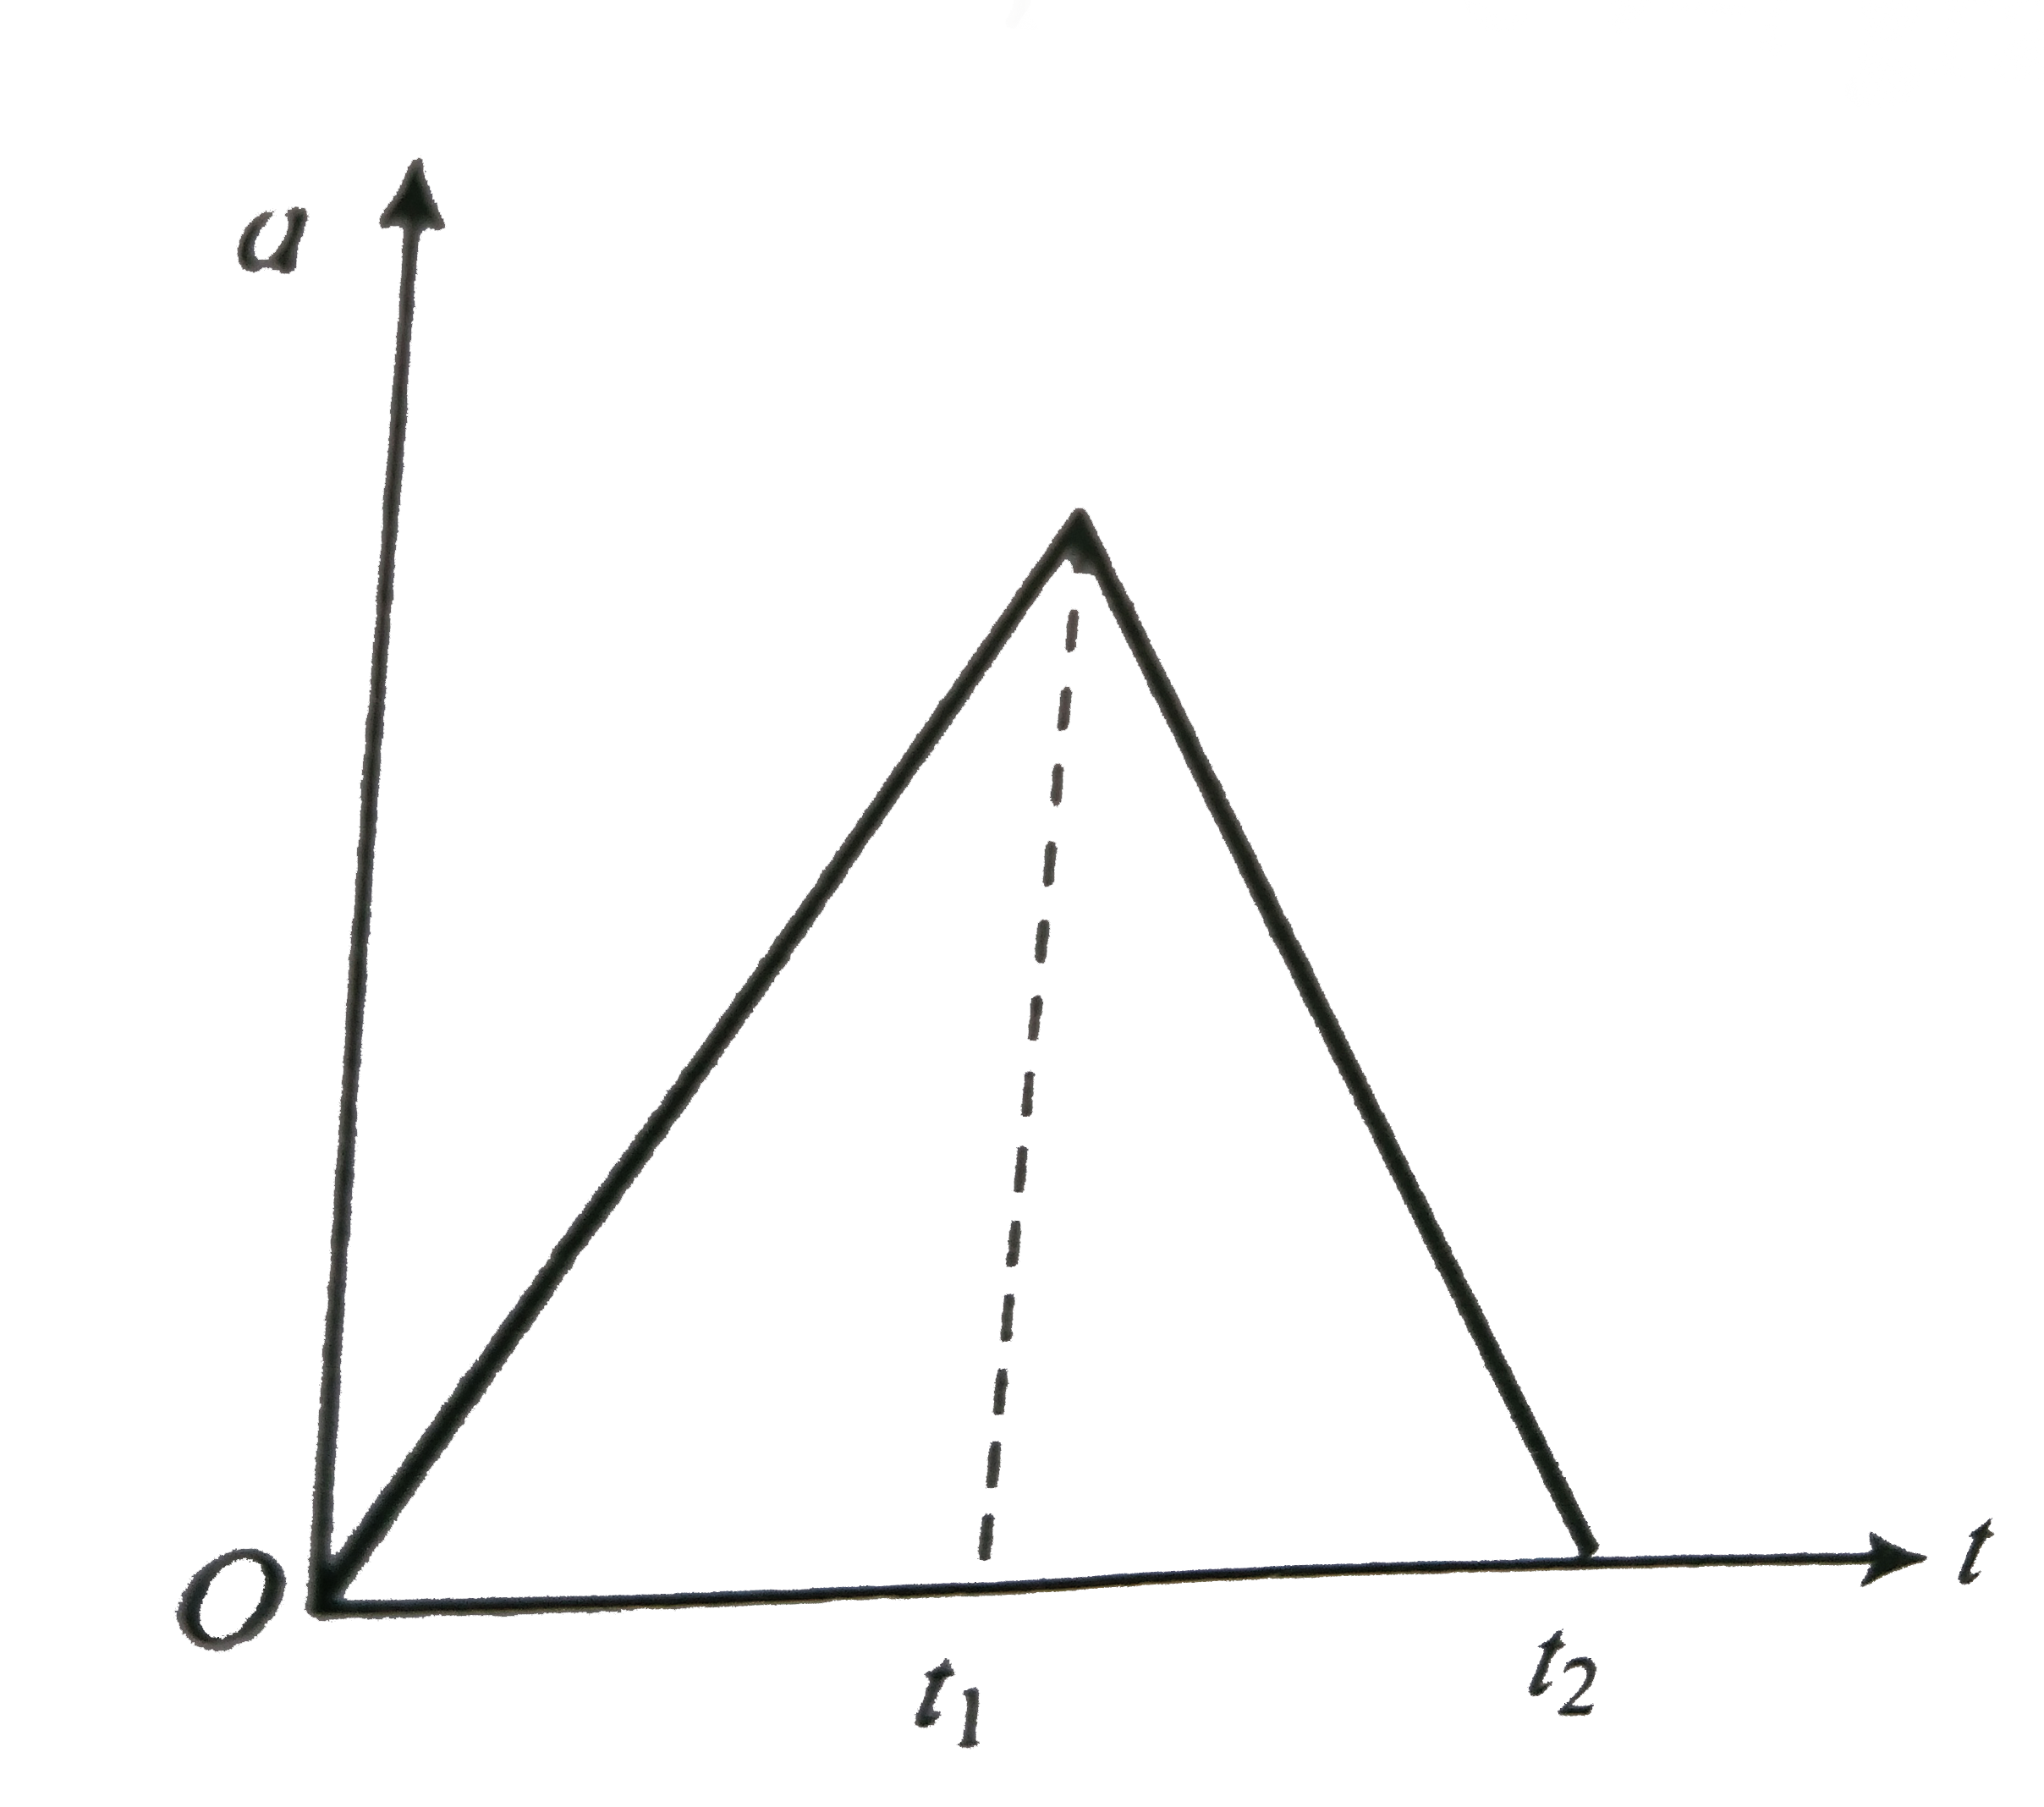
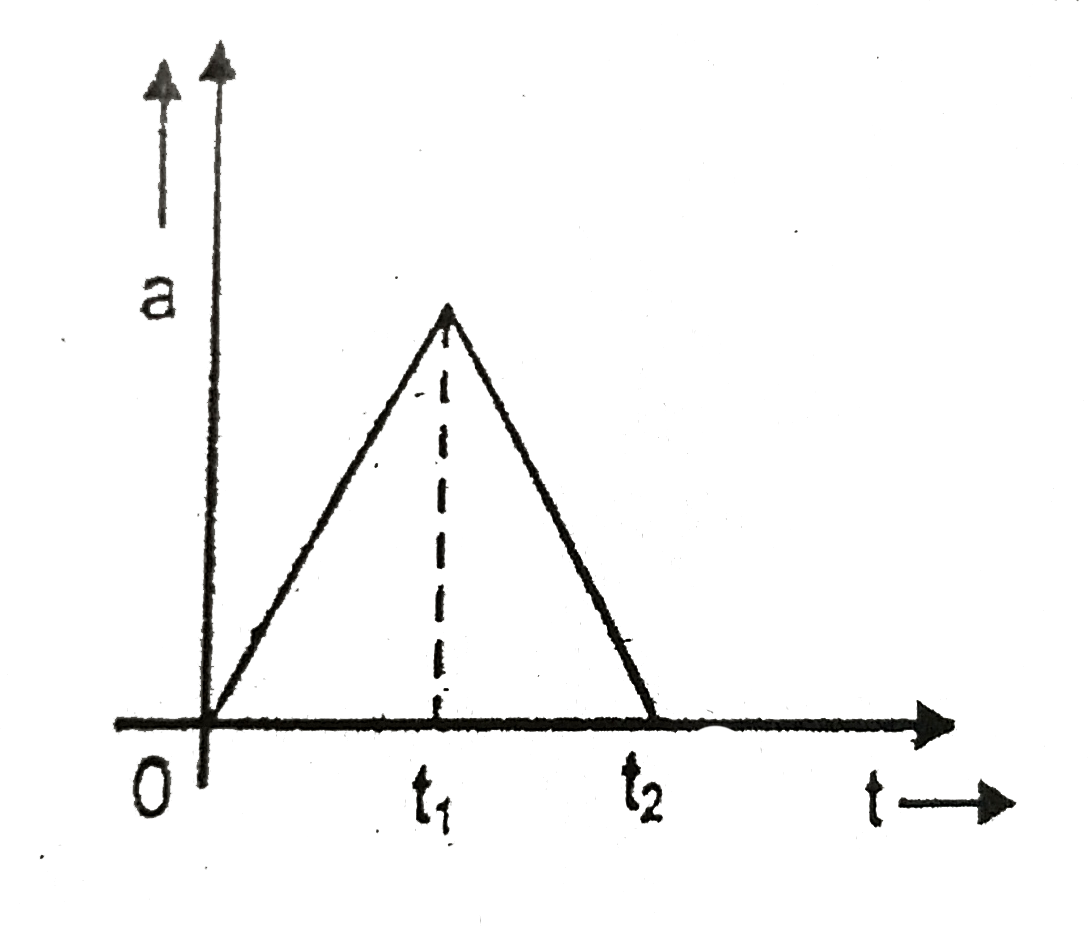
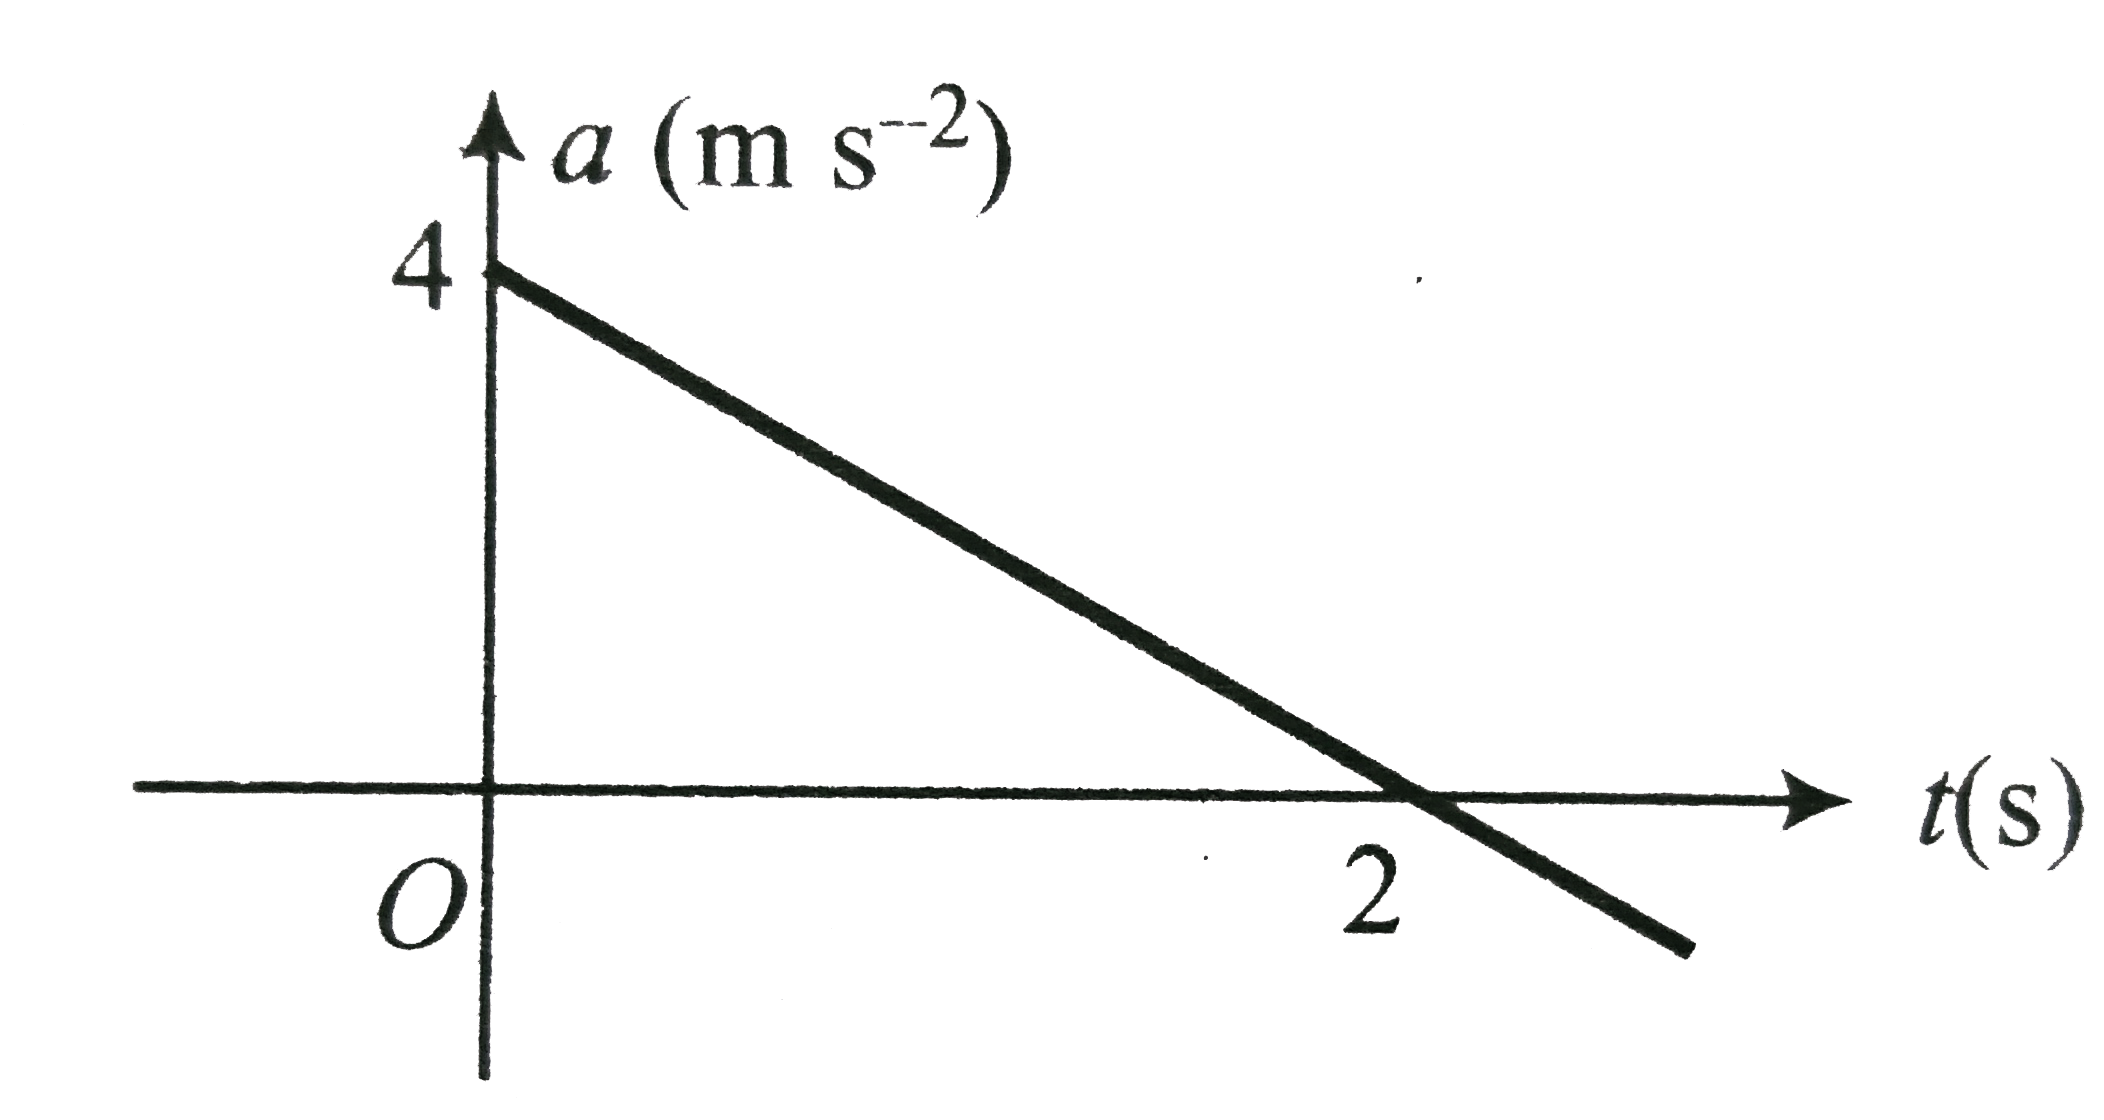
The acceleration versus time graph of a particle is shown in. The respective v−t graph of the particle is .
 .
.
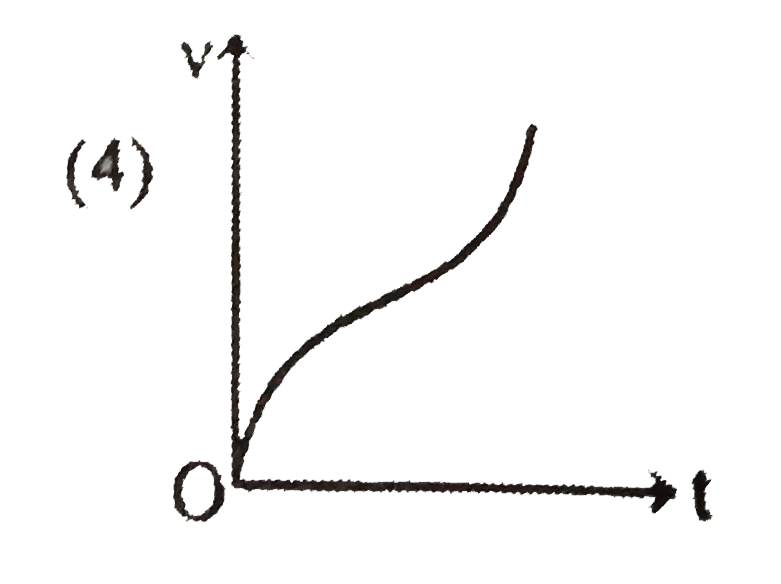
The correct Answer is:1
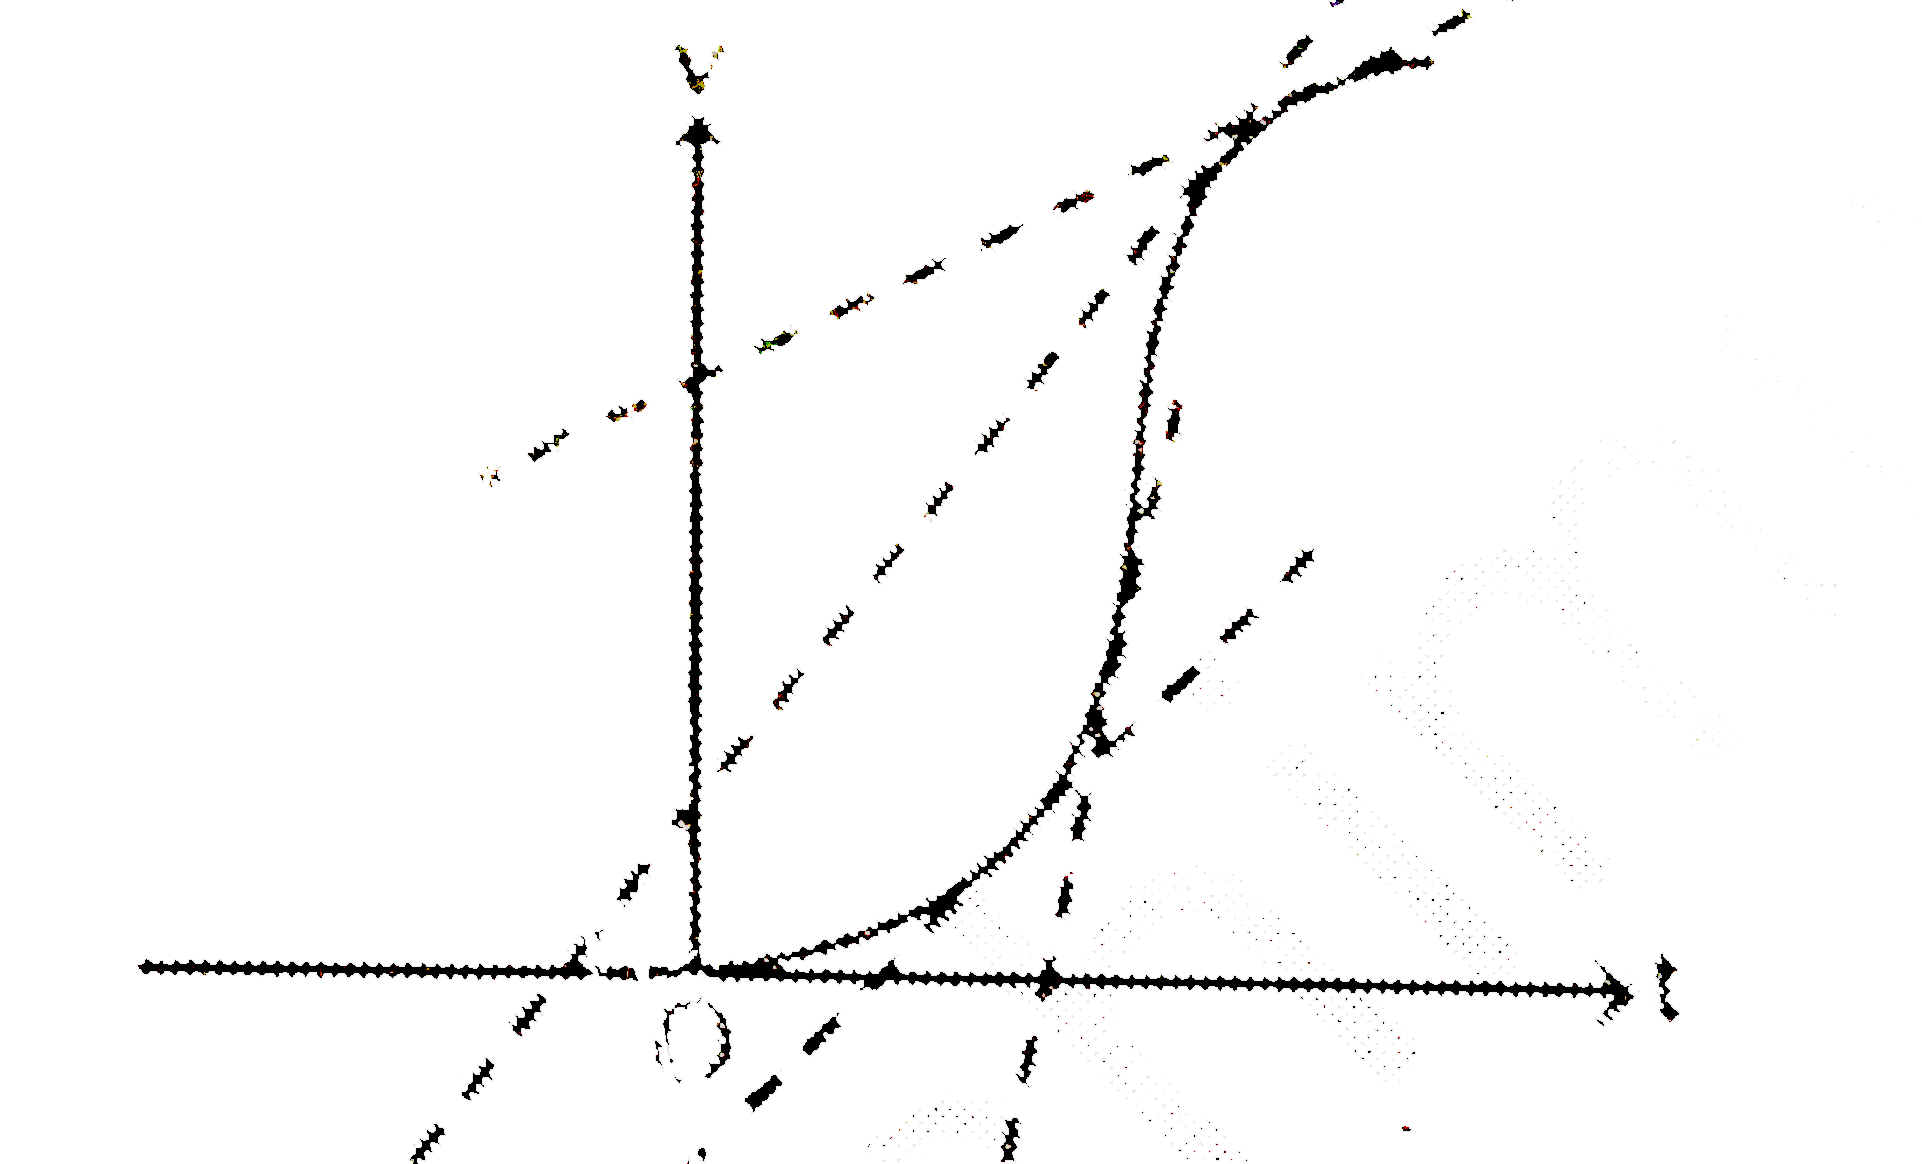
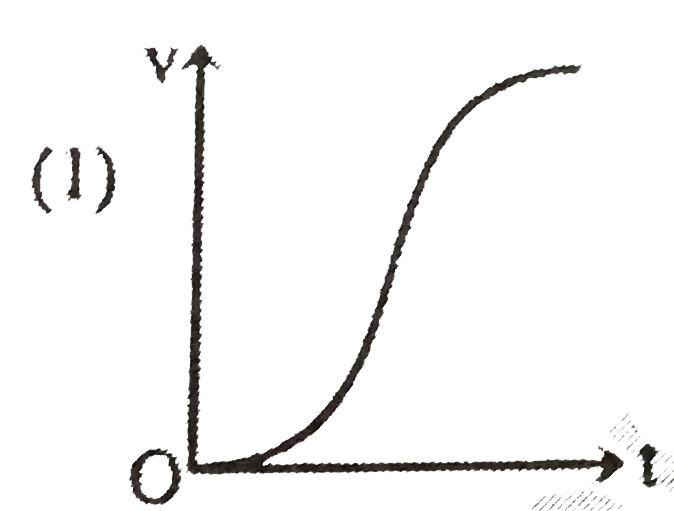
Acceleration is equal to solpe of velocity time graph and it finaly becomes 0
Acceleration is first increasing with time and then decreasing .
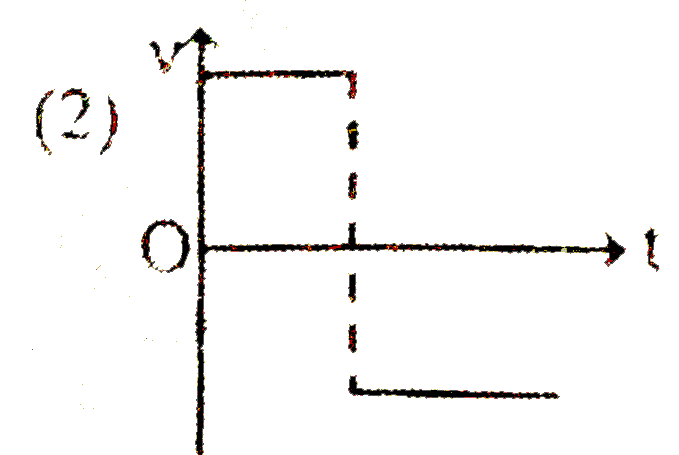
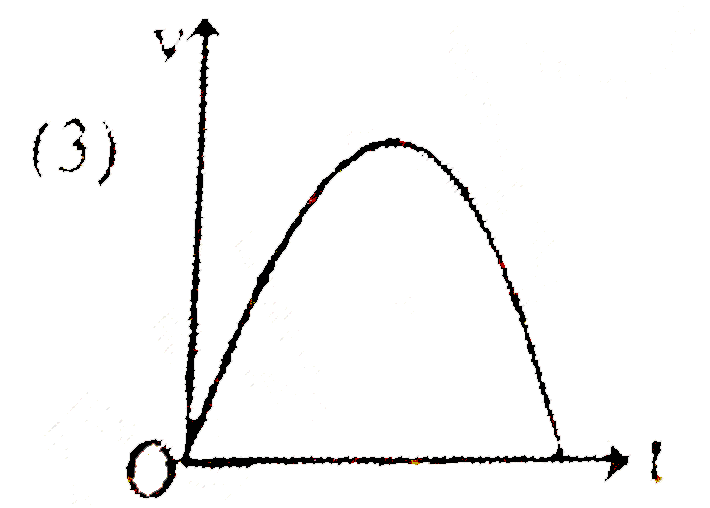
So, slope of v-t graph should first increase and then decrease and finally become 0.
Which is clearly indicated as in graph (1).
Topper's Solved these Questions
Similar Questions
i.The acceleration versus time graph of a partical SHM is shown in the figure . Plot the displacement versus time graph
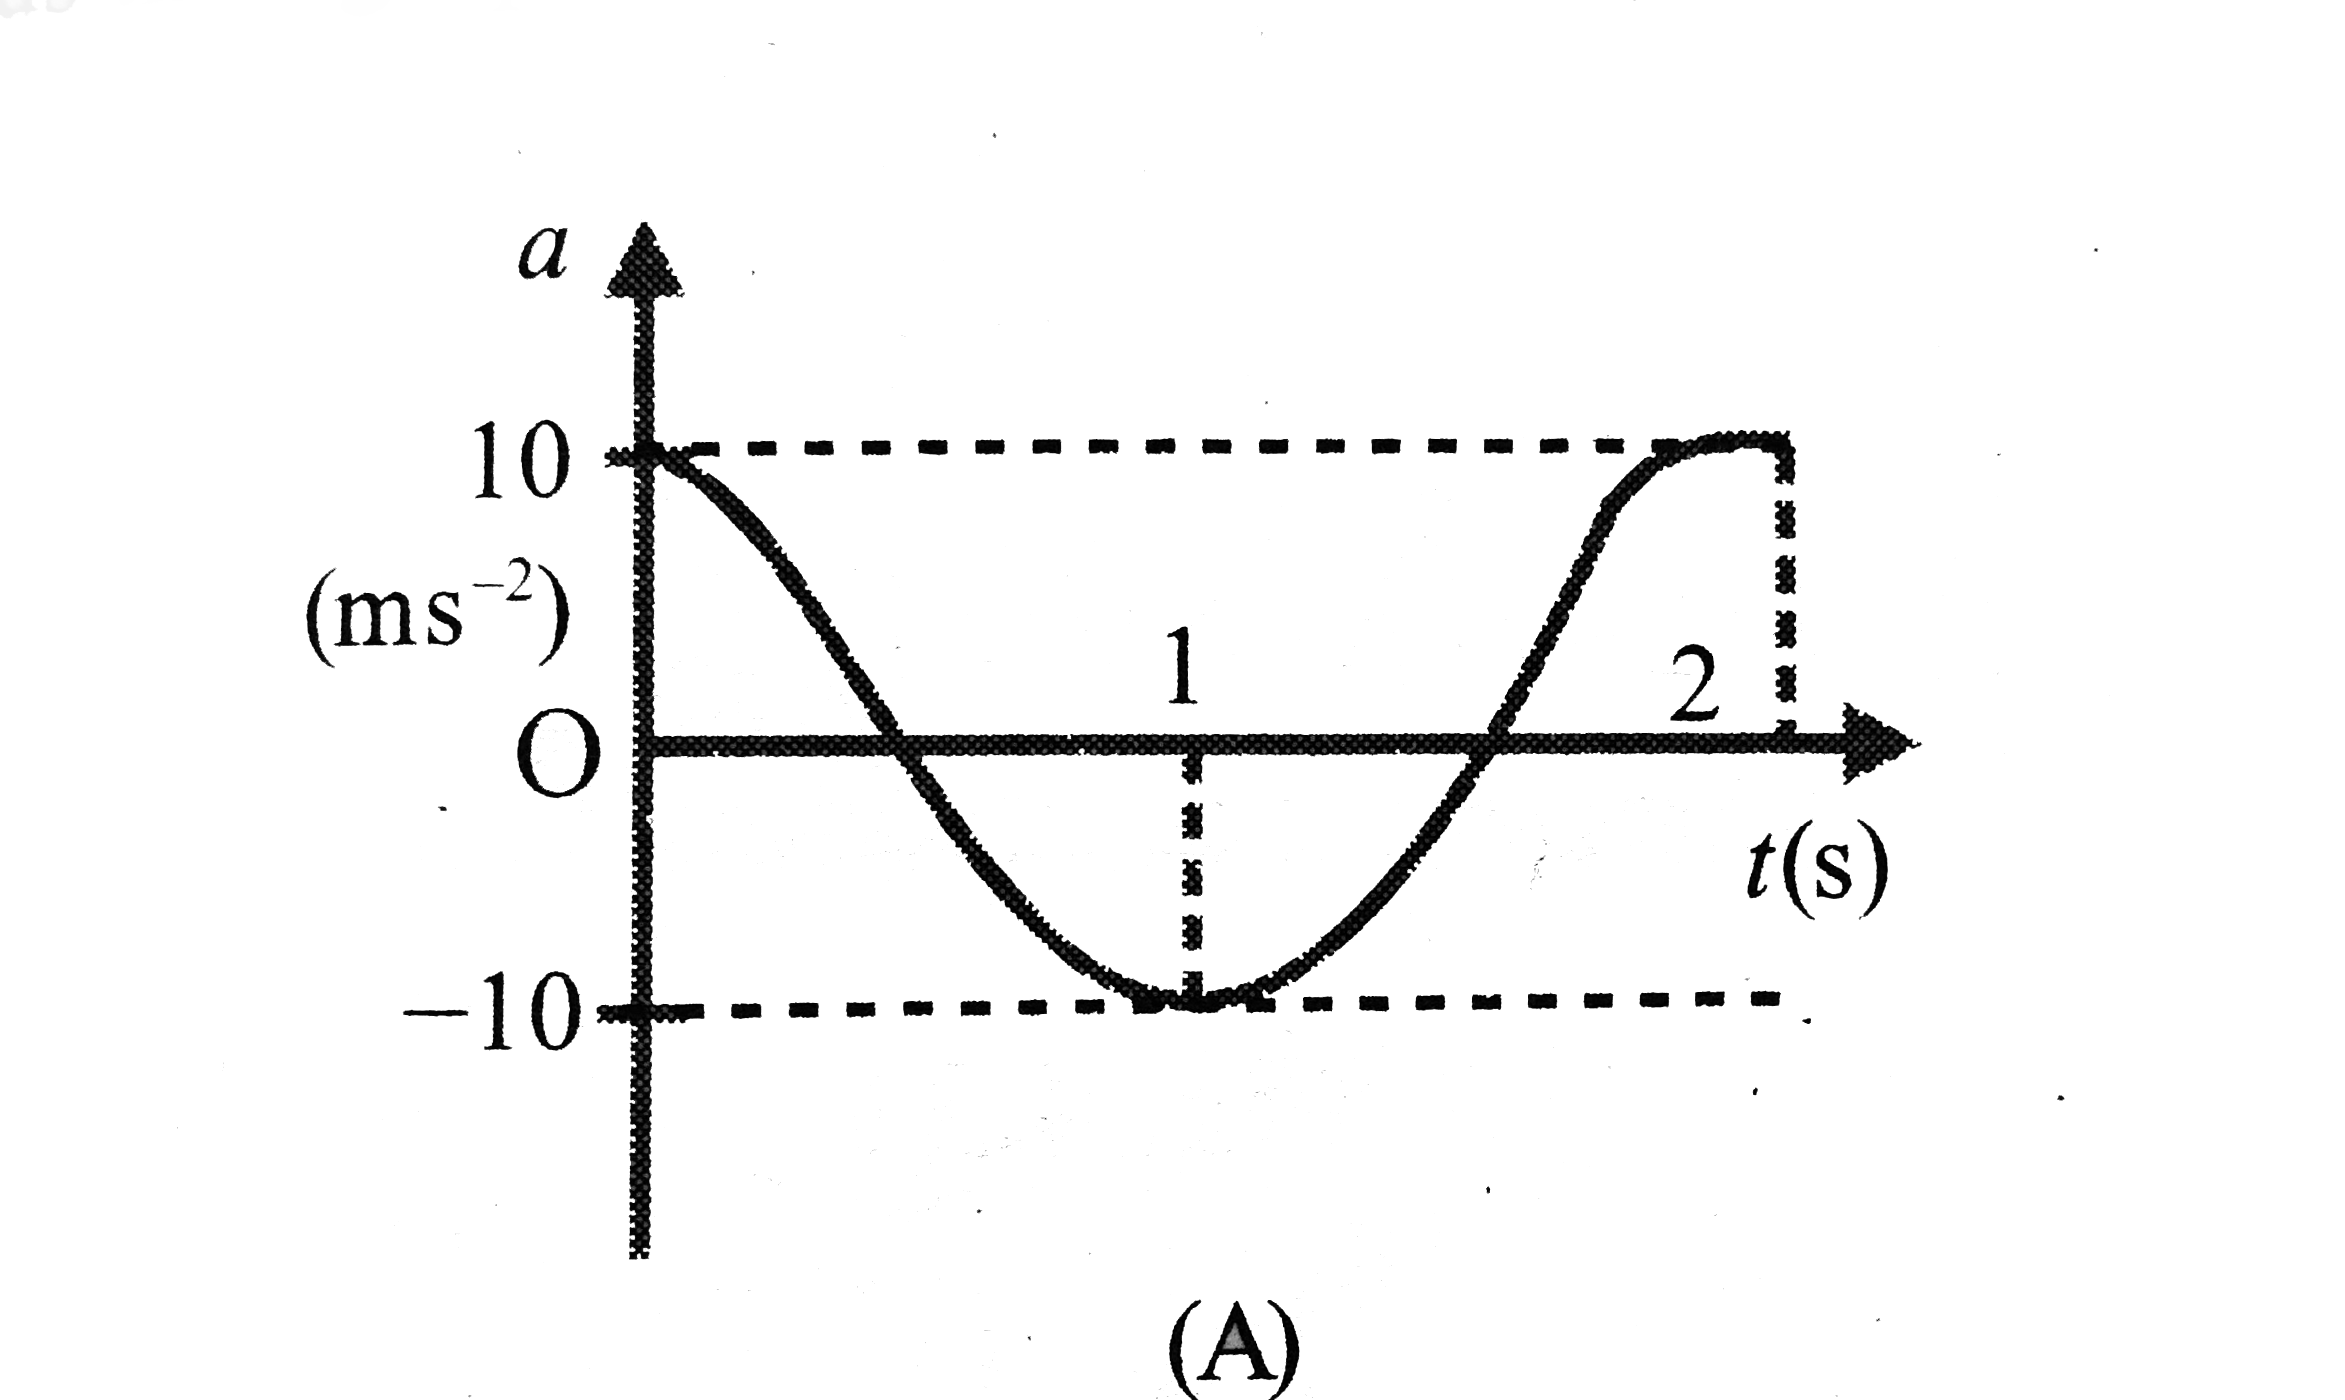
ii. The frection of oscillation is……..
iii. The displacement amplitude is ………
iv. At t=0, the velocity of the partical is ......
v. The kinetic energy of the partical is maximum at t=....... and t = ......
vi. The potential energy is maximum at t = ....... : t = ..... ans t = .........
View SolutionPosition (x) versus time (t) graph of a particle is as shown. The velocity is zero at?
View Solution
Knowledge Check
The acceleration versus time graph of a particle is shown in the figure. The respective v−t graph of the particle is .
 .A
.A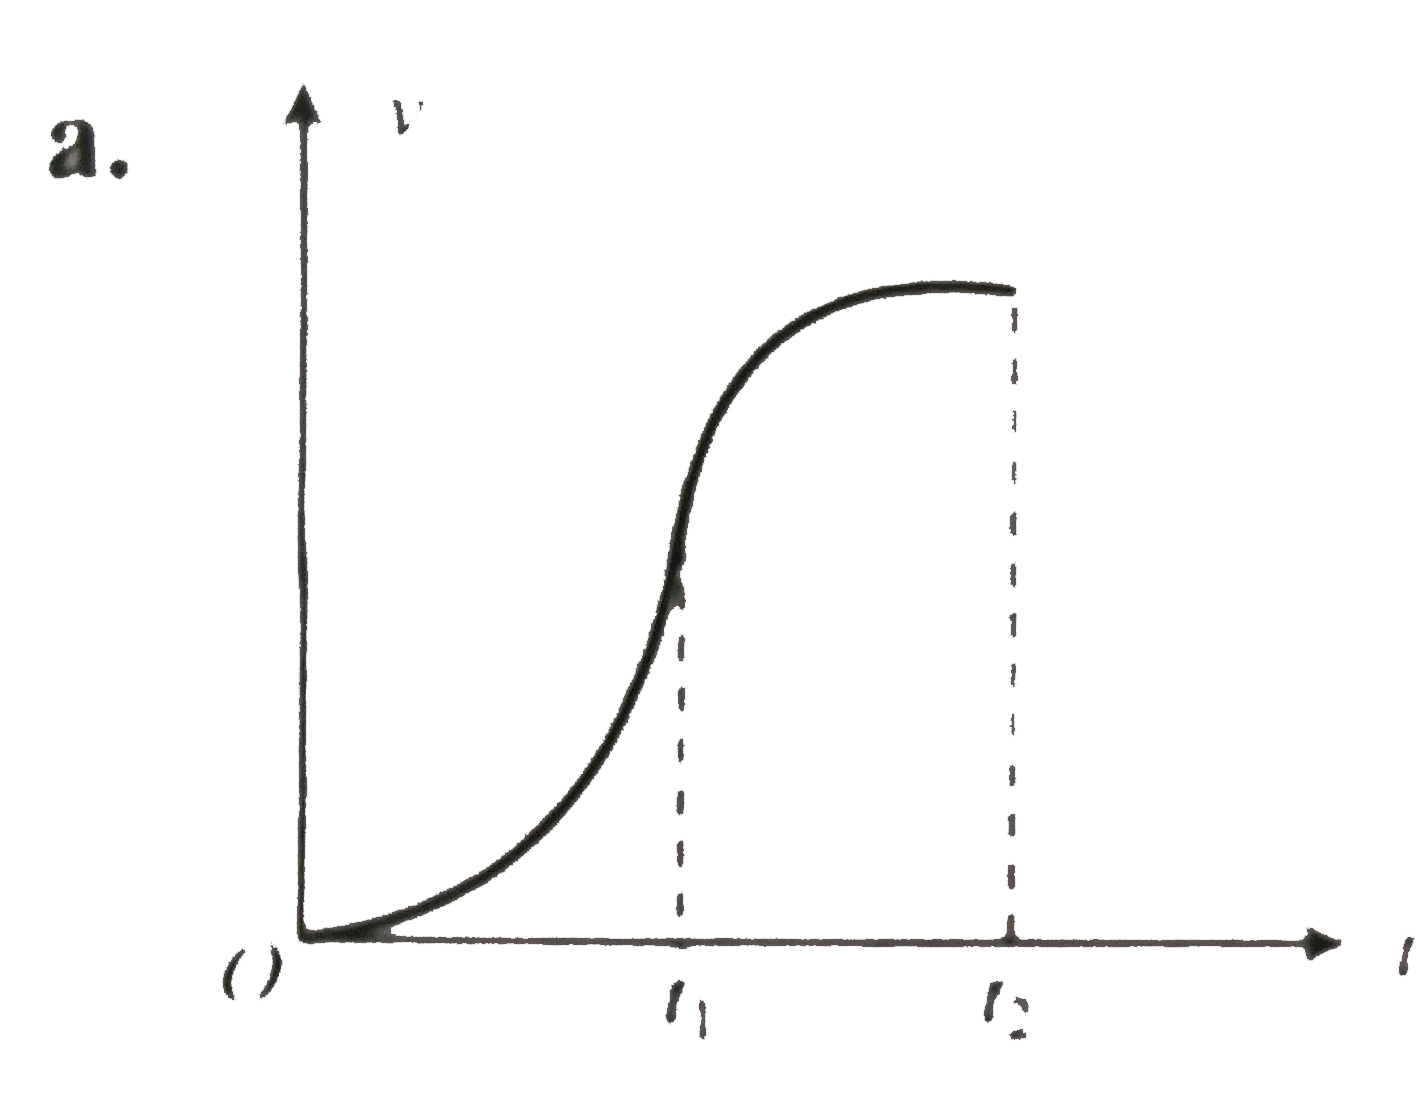 .B
.B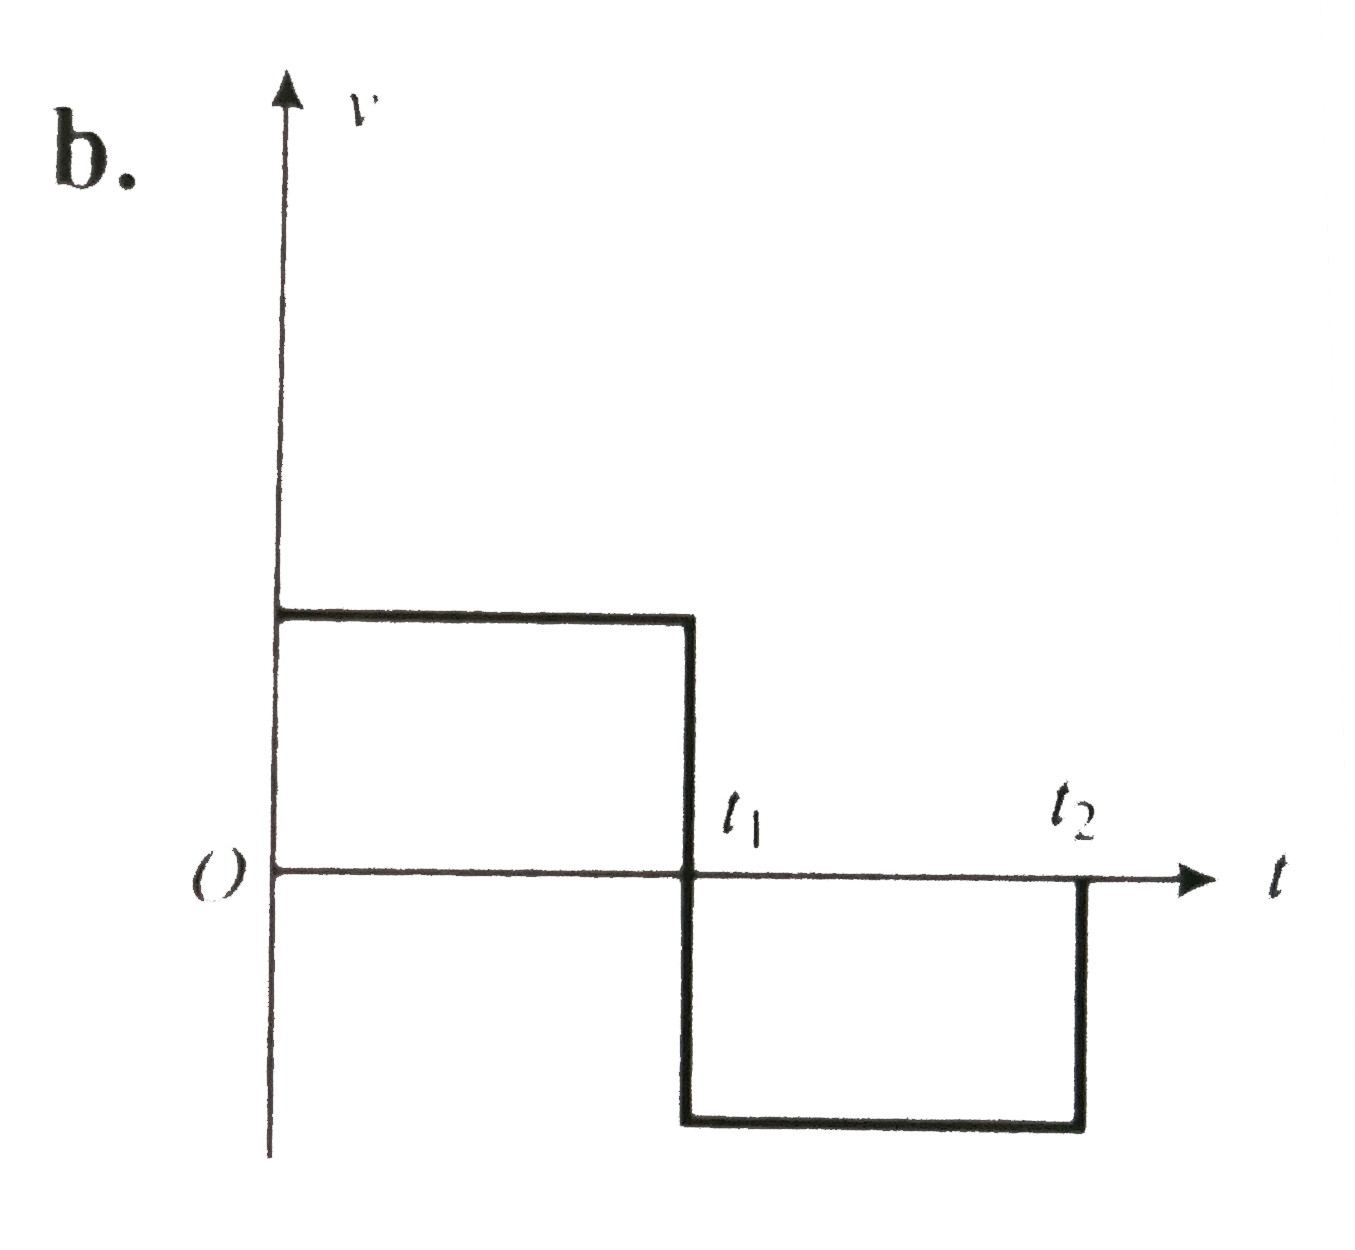 .C
.C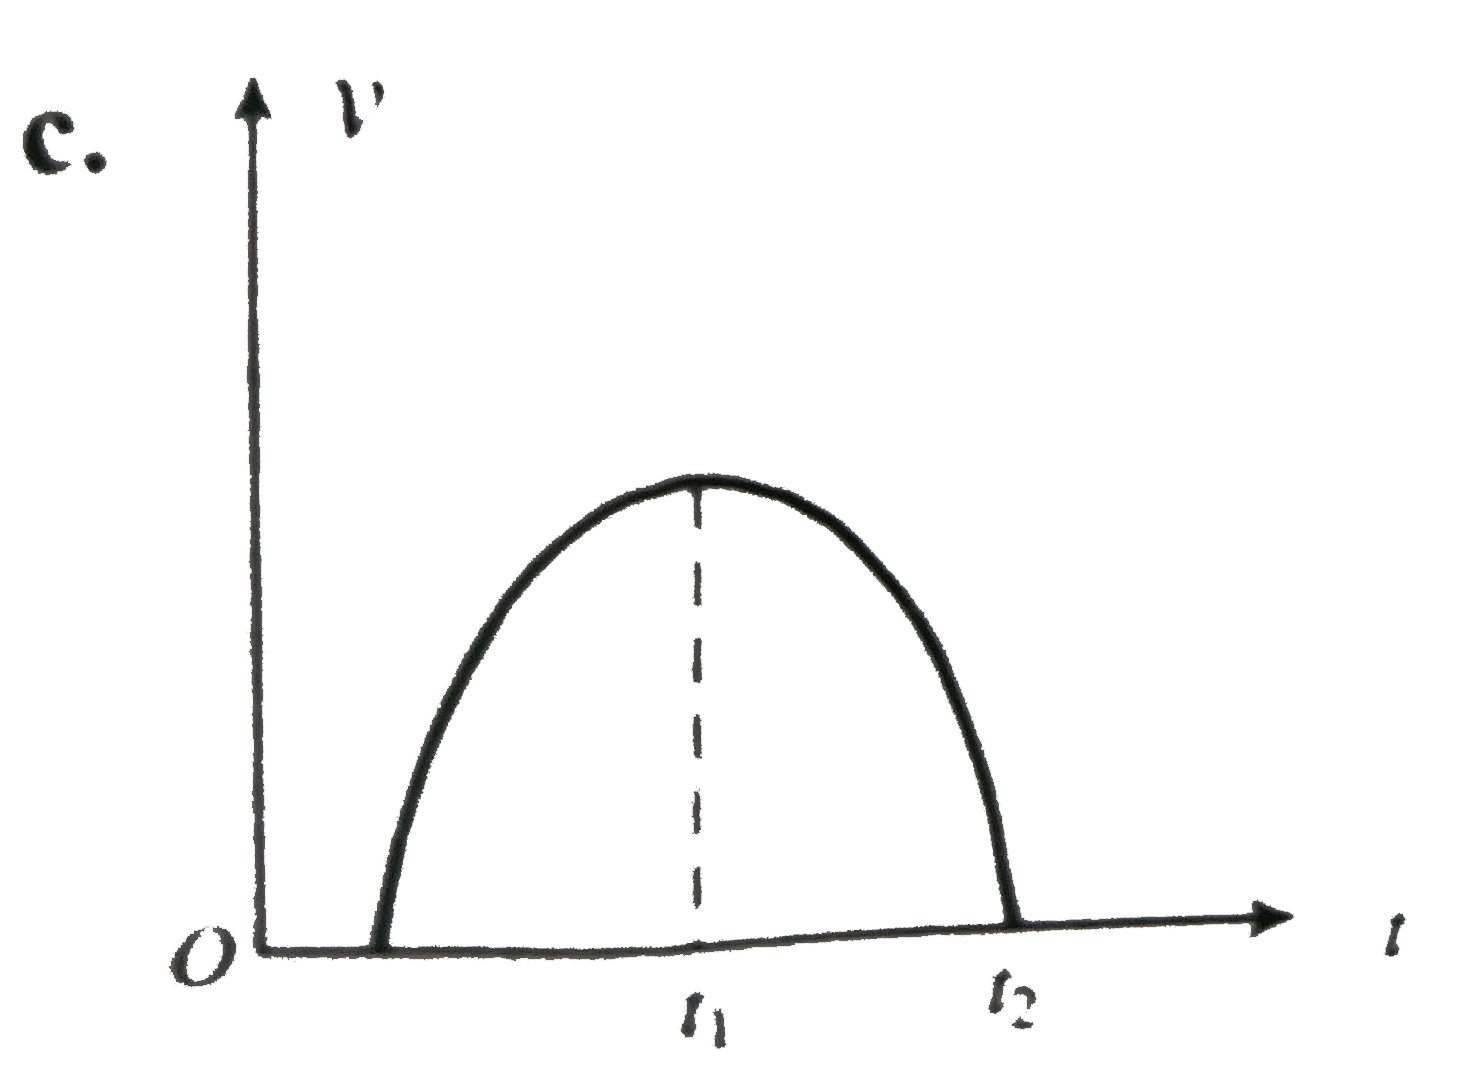 .D
.D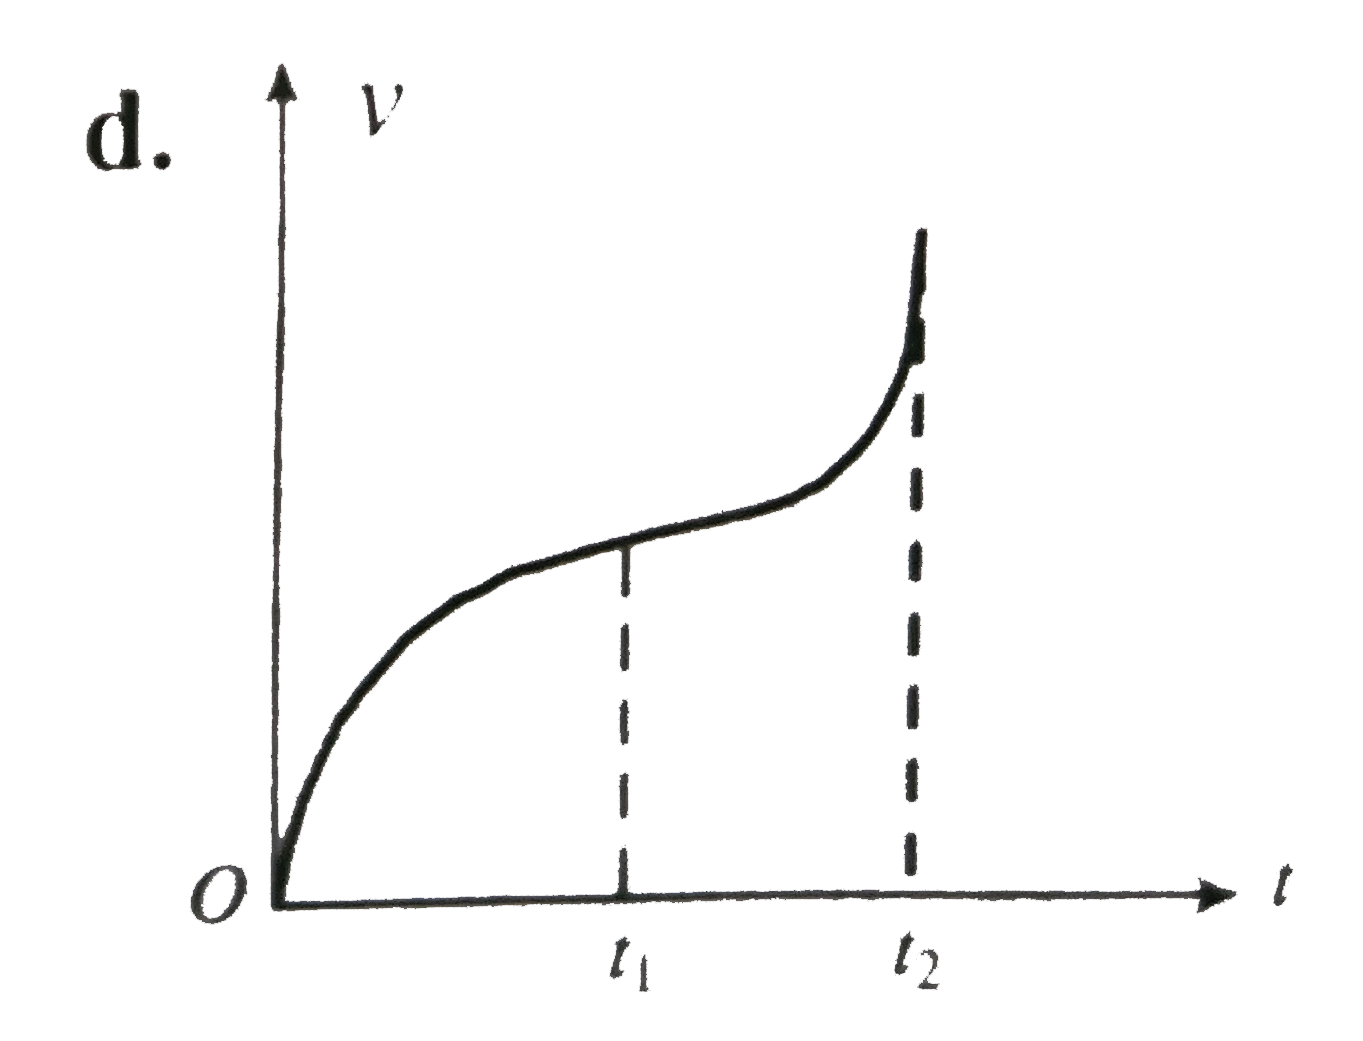 .
.A particle starts to move along a straight line. The acceleration versus time graph of particle is as shown in figure. The correct velocity versus time graph is :
 A
A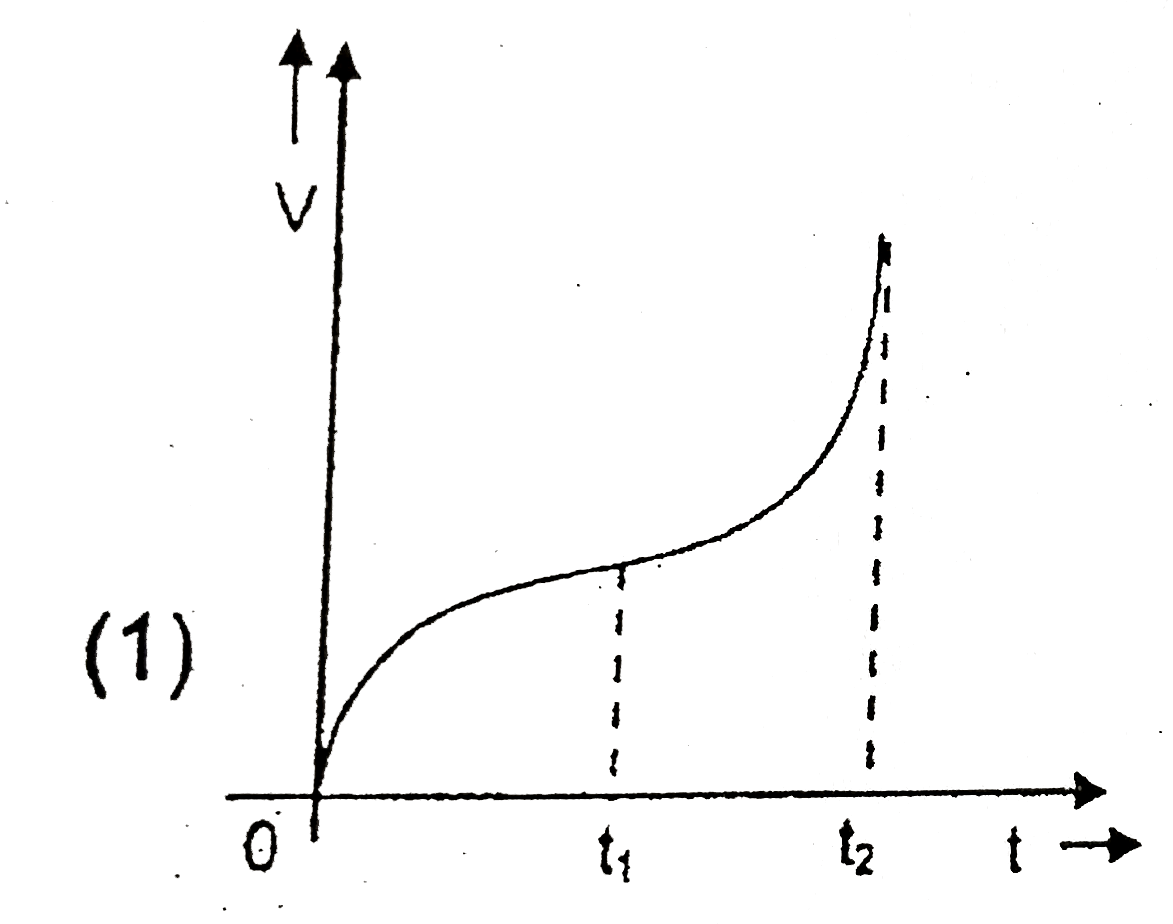 B
B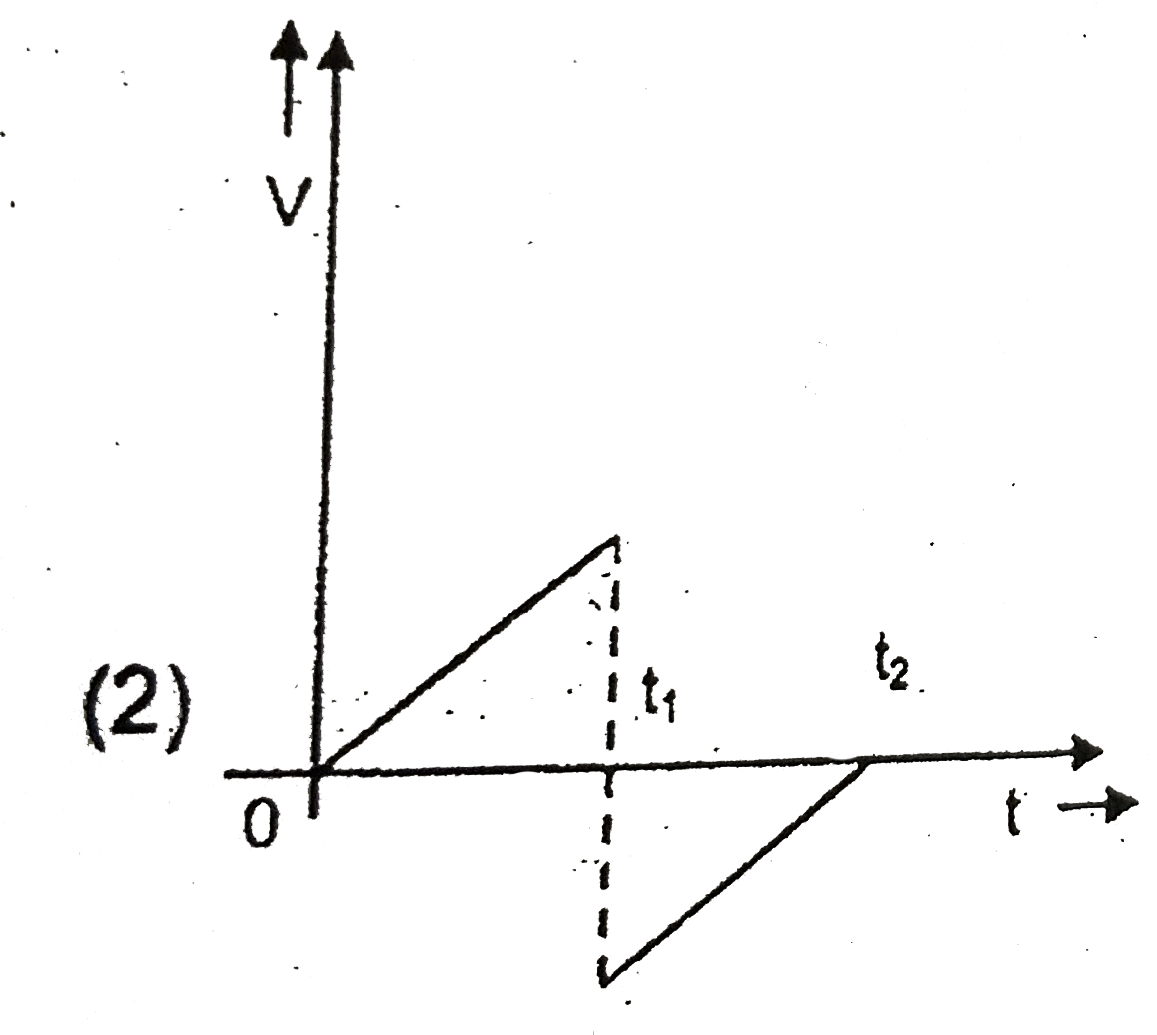 C
C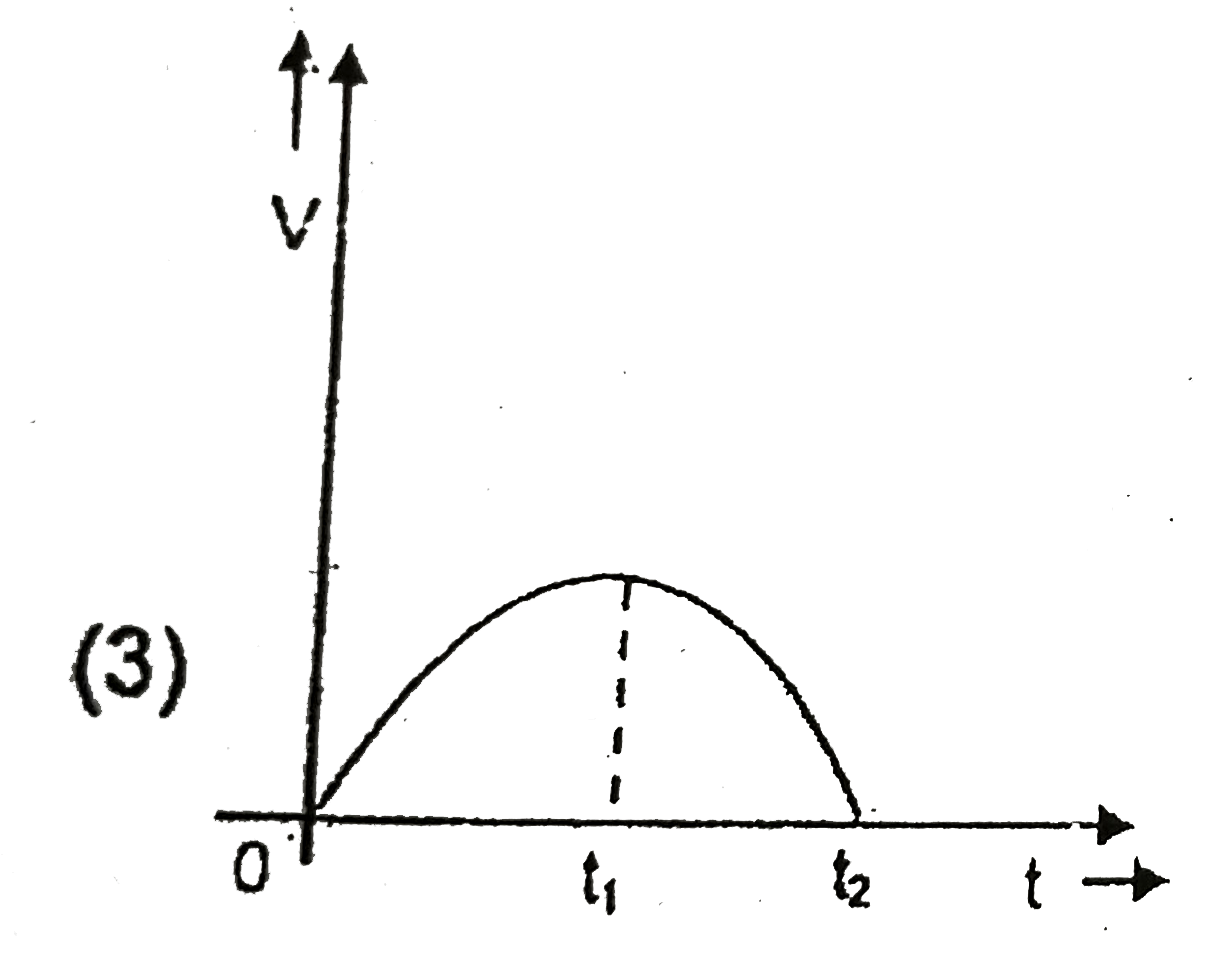 D
D
The acceleration versus time graph of a particle moving in a straight line is show in figure. The velocity-time graph of the particle would be
 .AA straight lineBA parabolaCA circleDAn ellipse
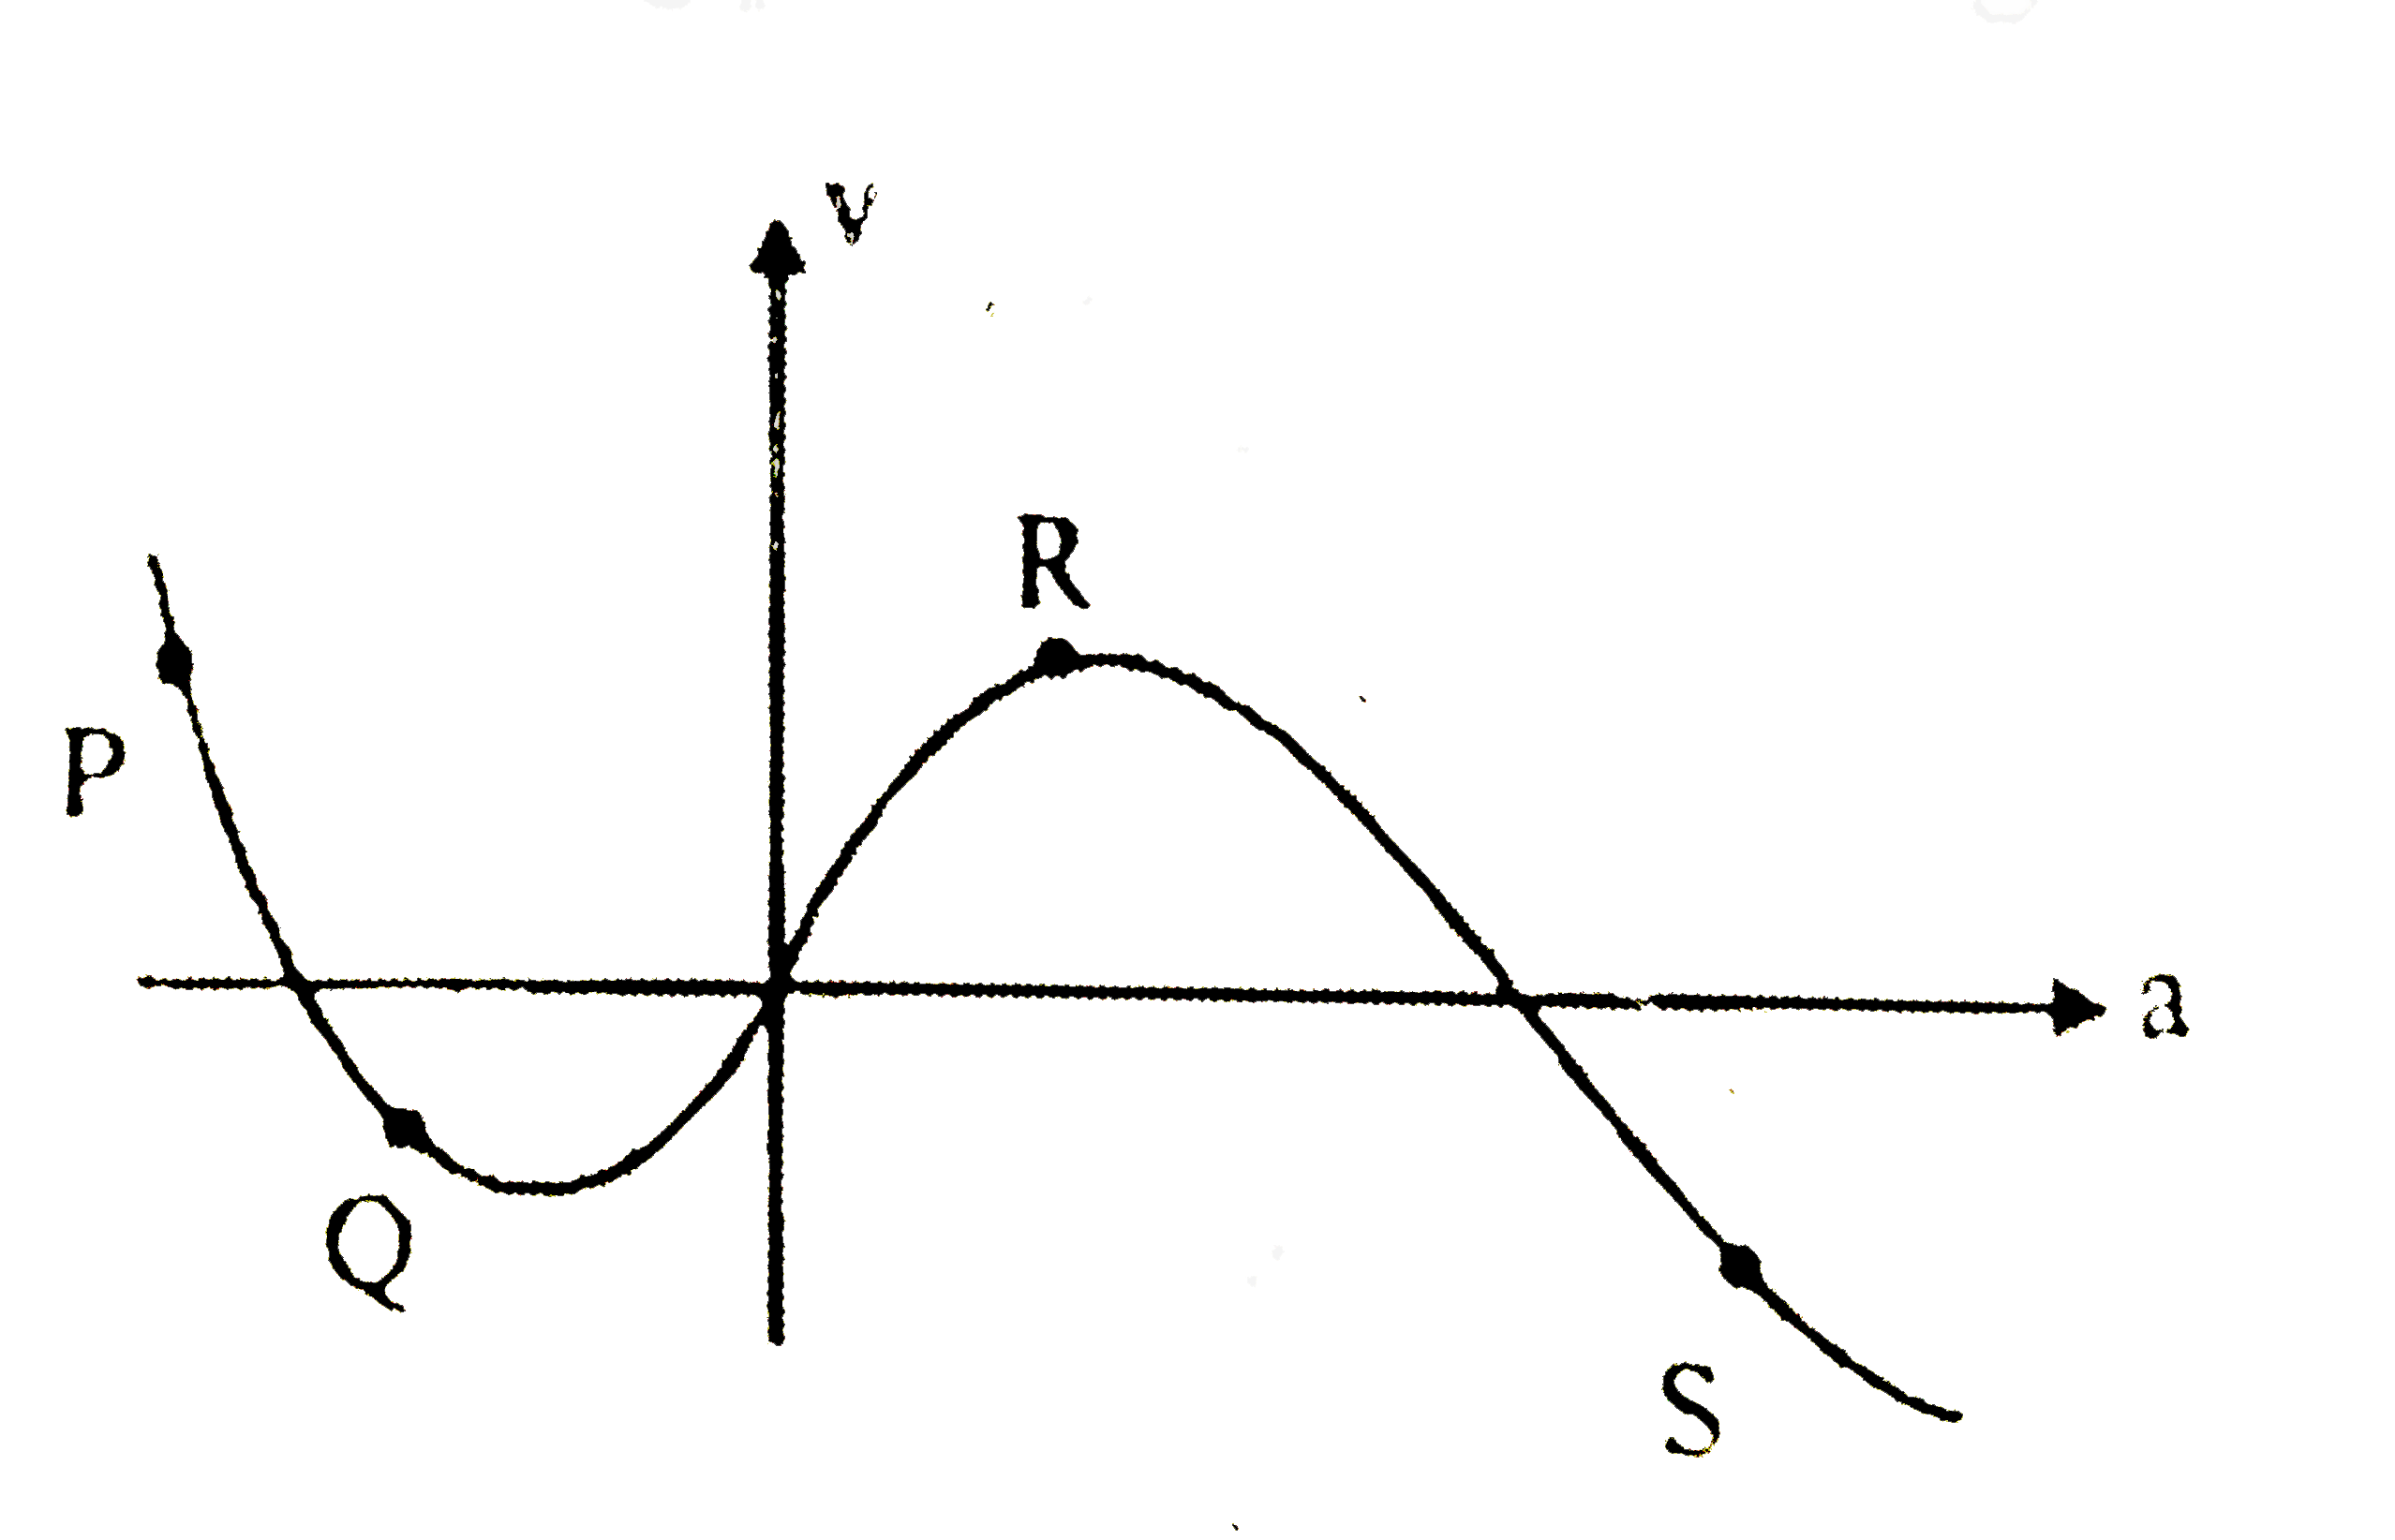
Acceleration-velocity graph of a moving particle is shown in figure. The particle is
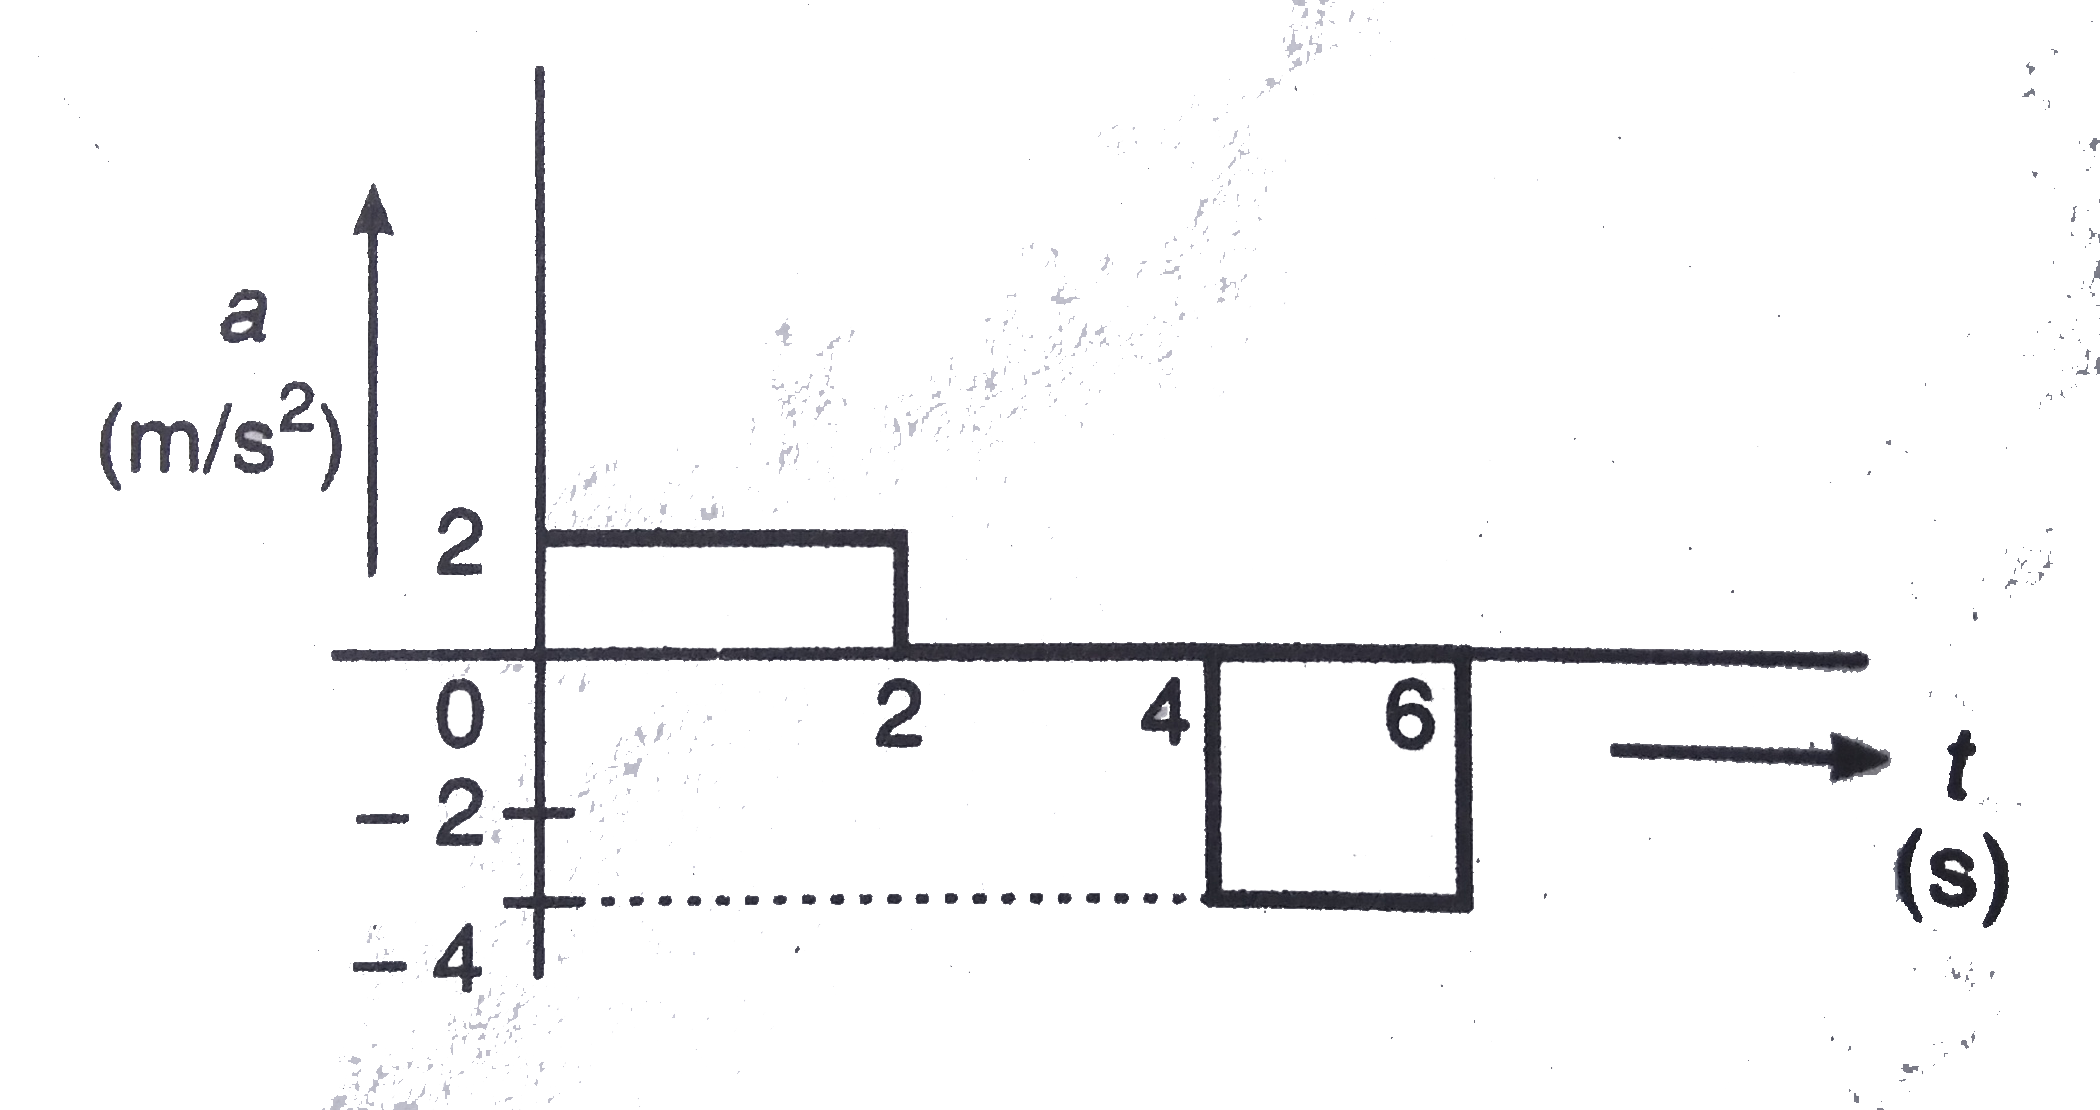
View SolutionThe acceleration versus time graph of a particle moving along a straight line is shown in the figure. Draw the respective velocity-time graph Given v=0 at t=0.
View SolutionVelocity (v) versus position (x) graph of a particle is shown.The acceleration of the particle at x=1m is ?
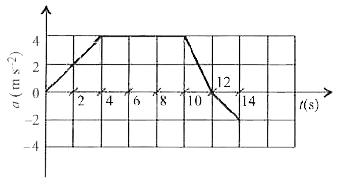
View SolutionA graph of acceleration versus time of a particle starting from rest at t =0 is shown. The speed of the particle at t=14 second is
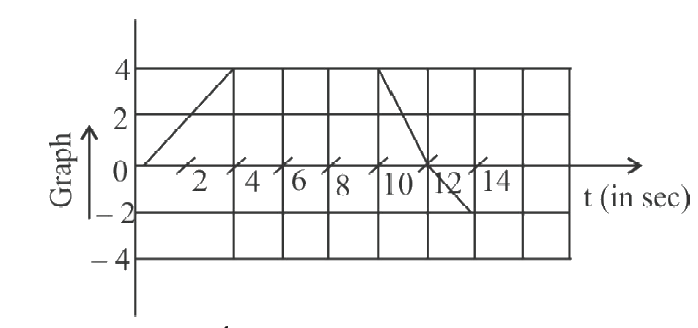
View SolutionA graph of acceleration versus time of a particle starting from rest at t=0 is as shown in figure. The speed of the particle at t=14s is
View Solution
