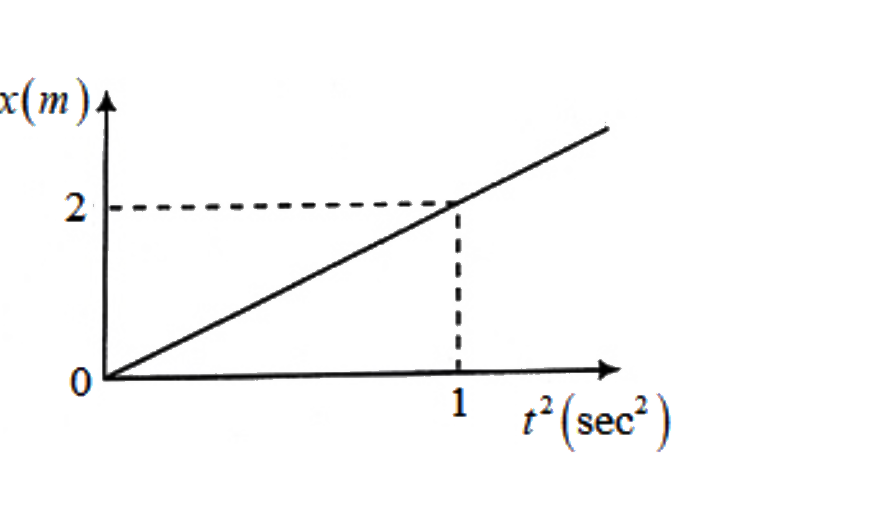
Velocity (v) versus position (x) graph of a particle is shown.The acceleration of the particle at x=1m is ?
Step by step video & image solution for Velocity (v) versus position (x) graph of a particle is shown.The acceleration of the particle at x=1m is ? by Physics experts to help you in doubts & scoring excellent marks in Class 11 exams.
Similar Questions
Knowledge Check
- Question 1 - Select One
The velocity displacement graph of a particle is shown in figure. The acceleration of the particle when x=0 is.
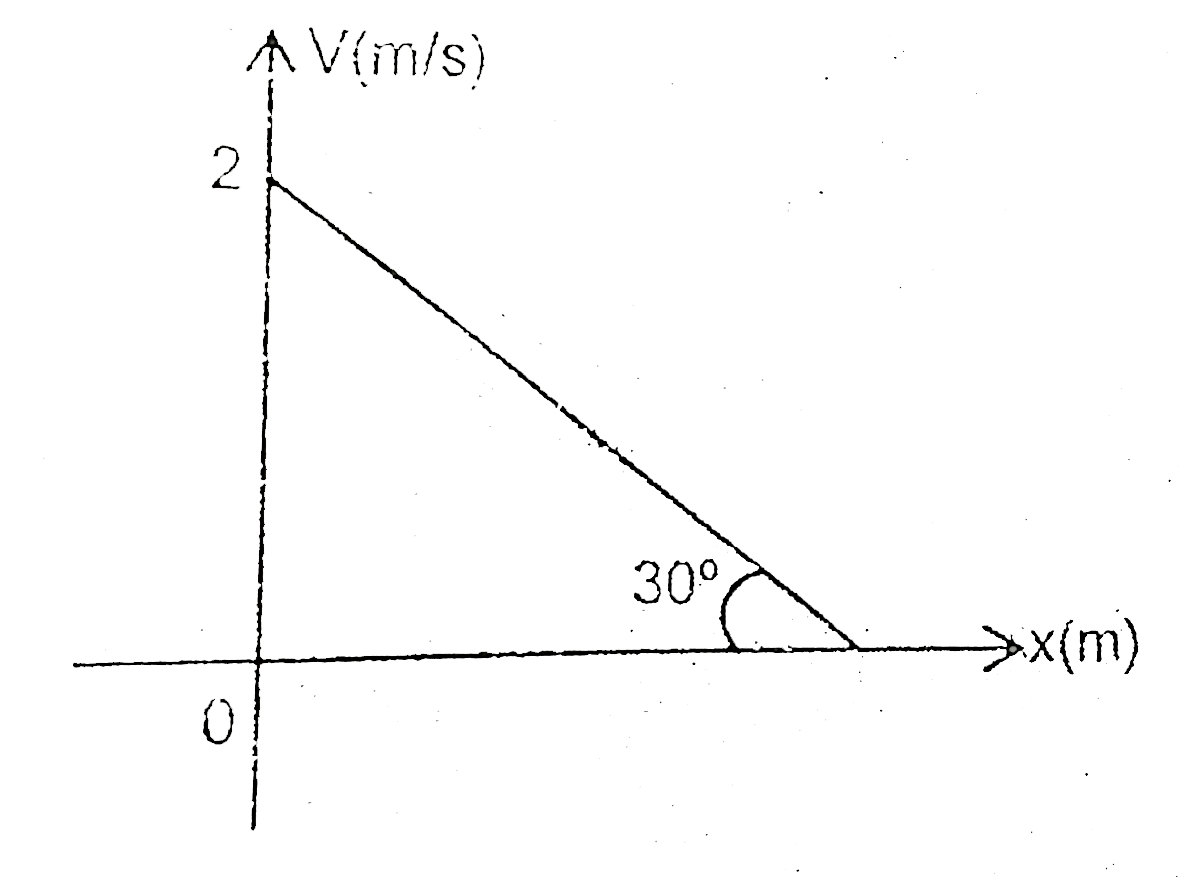 A1√3m/s2B−2√3m/s2C23m/s2DNone of the above
 - Question 2 - Select One
The velocity –position graph of a particle moving along a straight line is shown. Then acceleration of the particle at s = 15 m is :
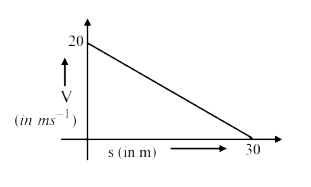 A23ms−2B−23ms−2C203ms−2D−203ms−2
 - Question 3 - Select One
The velocity - time graph is shown in the figure, for a particle. The acceleration of particle is
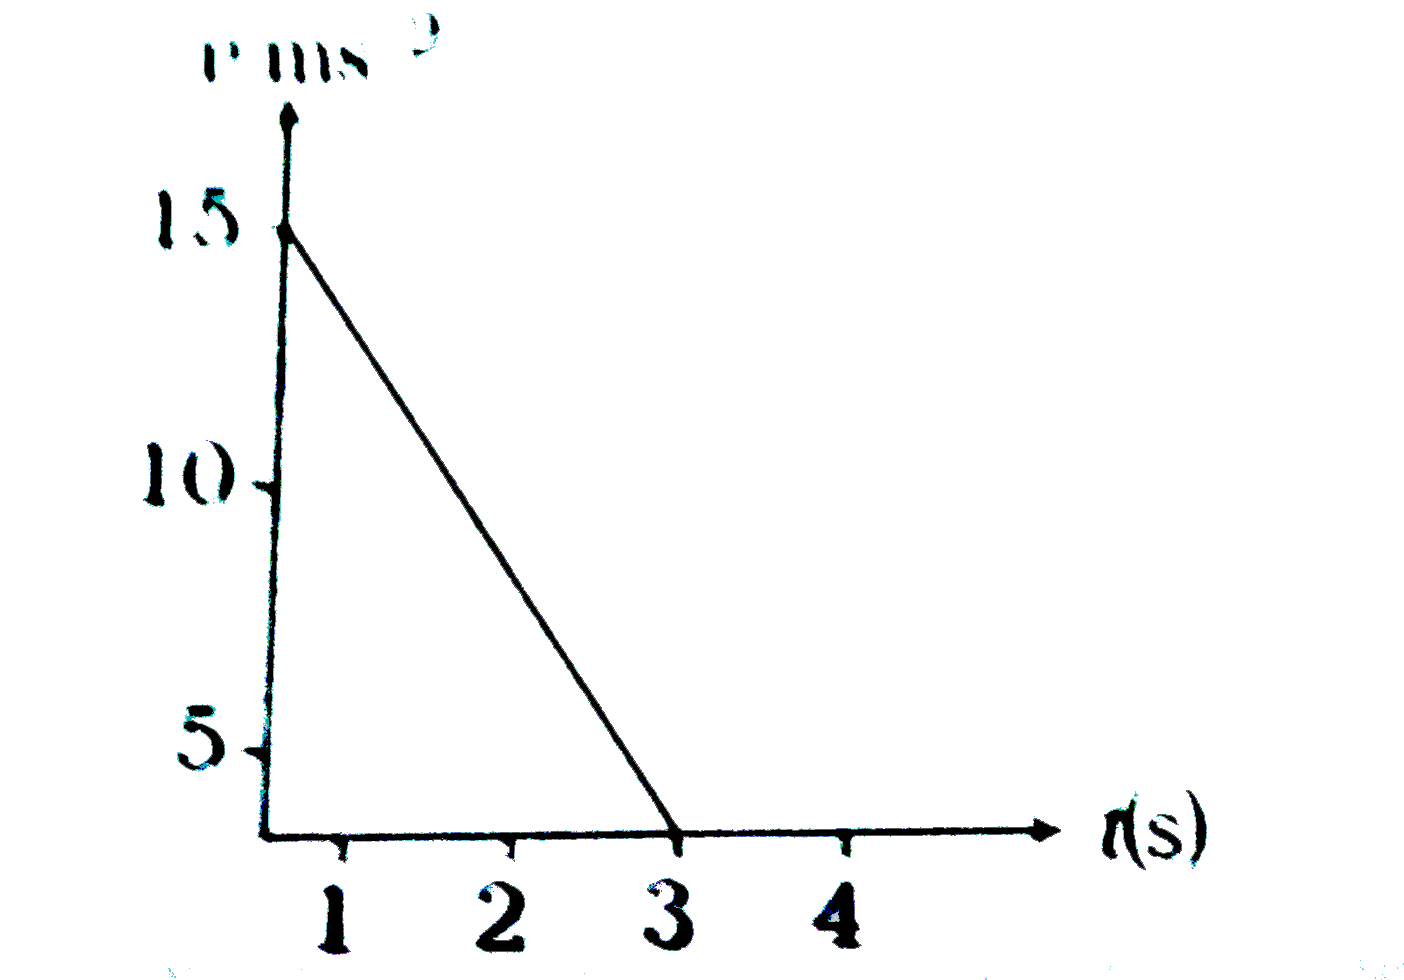 A22.5ms−2B5ms−2C−5ms−2D−3ms−2
A particle starts from rest at the origin and moves along the positive x direction. Its acceleration a versus position x graph is shown in the figure. The velocity of the particle at x = 6 m is?
View SolutionPosition (x) versus time (t) graph of a particle is as shown. The velocity is zero at (second)
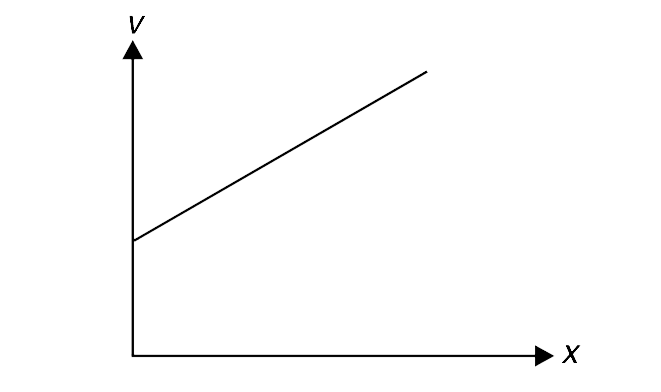
View Solution(a) A particle is moving along the x axis and its velocity vs position graph is as shown. Is the acceleration of the particle increasing, decreasing or remains constant?
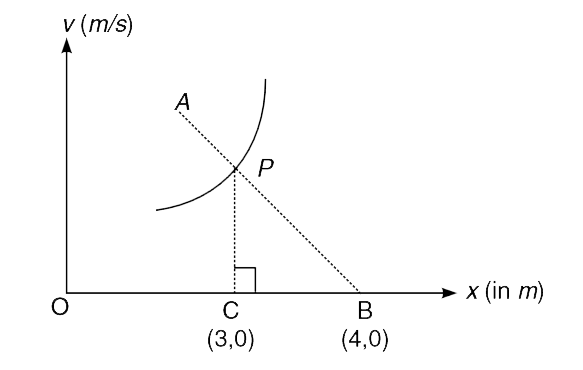
(b) A particle is moving along x axis and its velocity (v) vs position (x) graph is a curve as shown in the figure. Line APB is normal to the curve at point P. Find the instantaneous acceleration of the particle at x=3.0m.
 View Solution
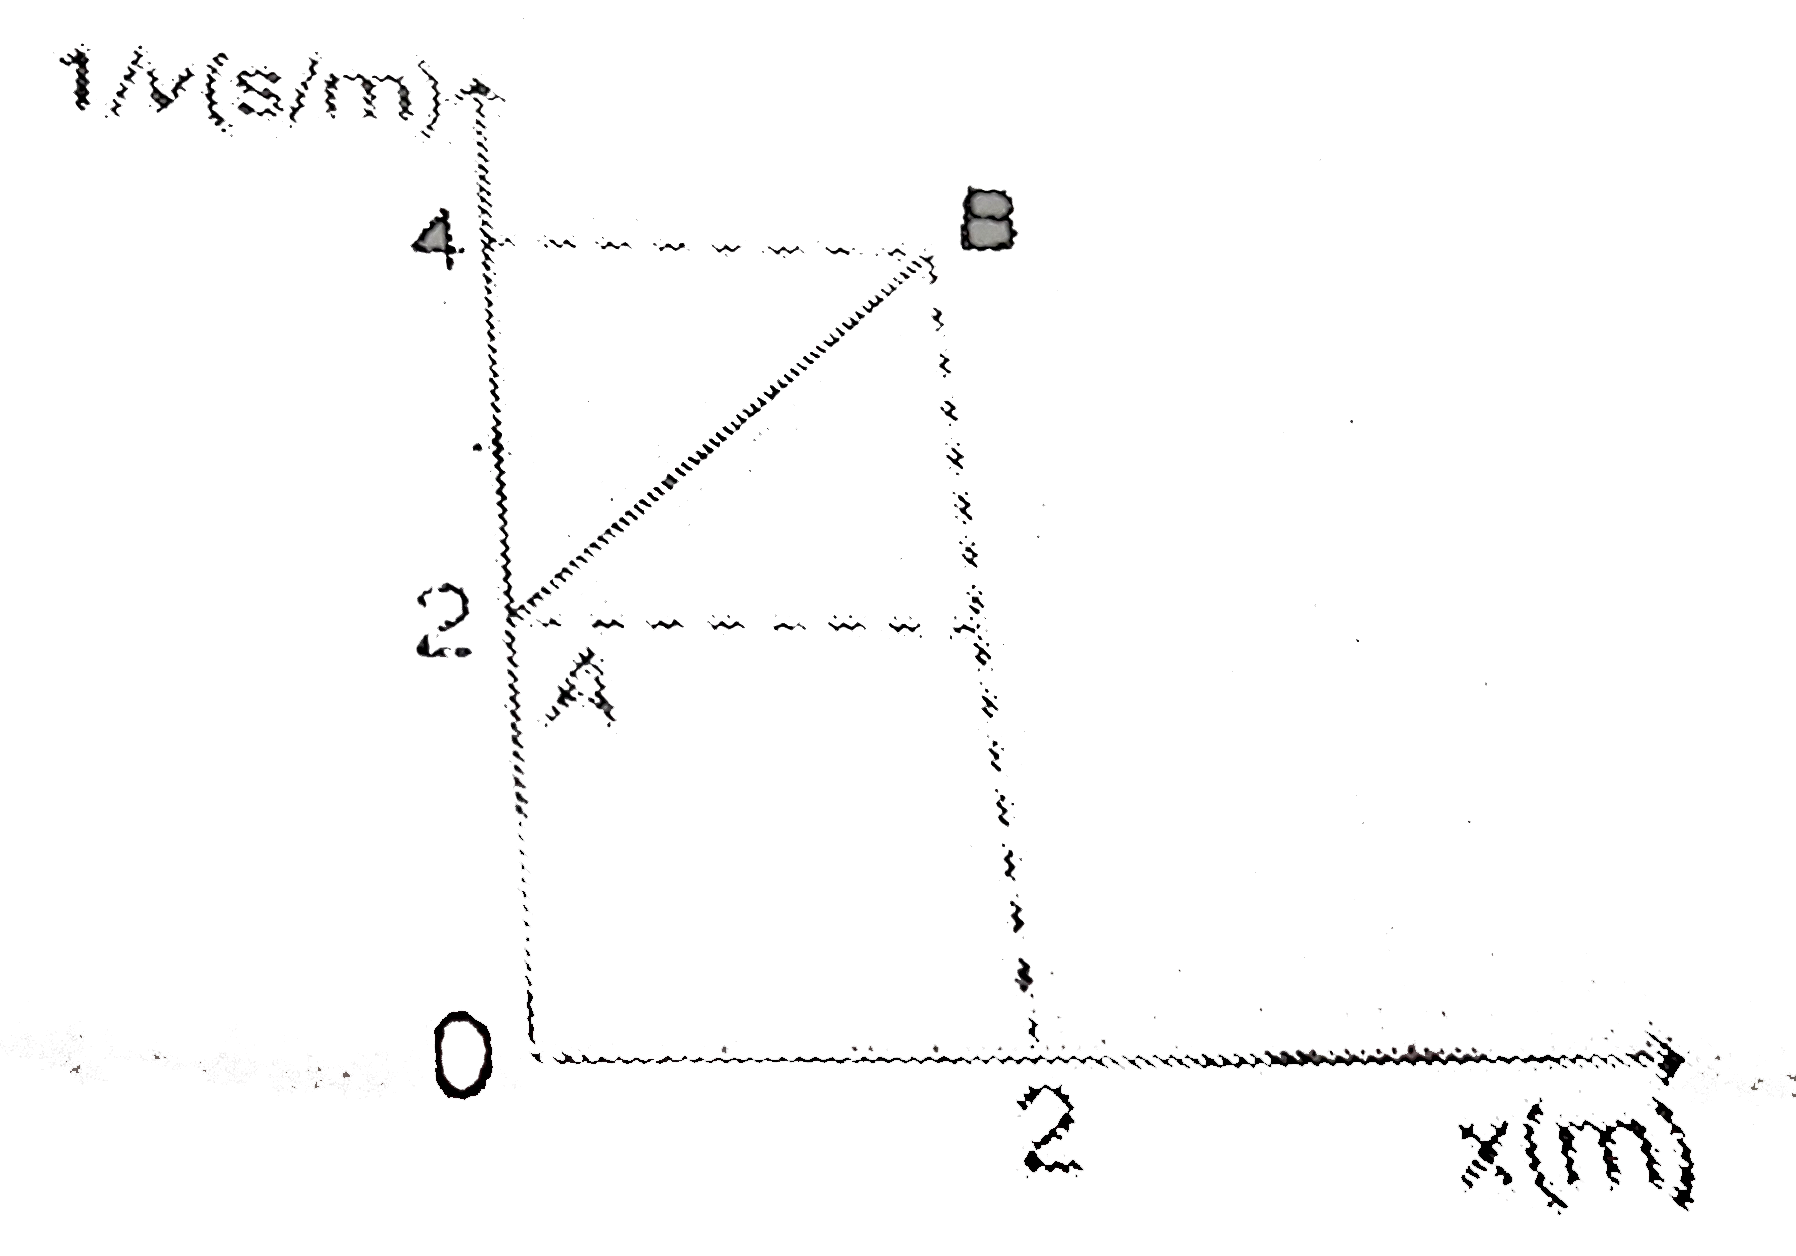
The 1/v versus positions graph of a particle is shown in the figure, where v is the velocity of the particle. The particle is moving in a straight line aloing positive x- axis.Find the time taken by the particle to reach from the point A to B in second.
 View Solution
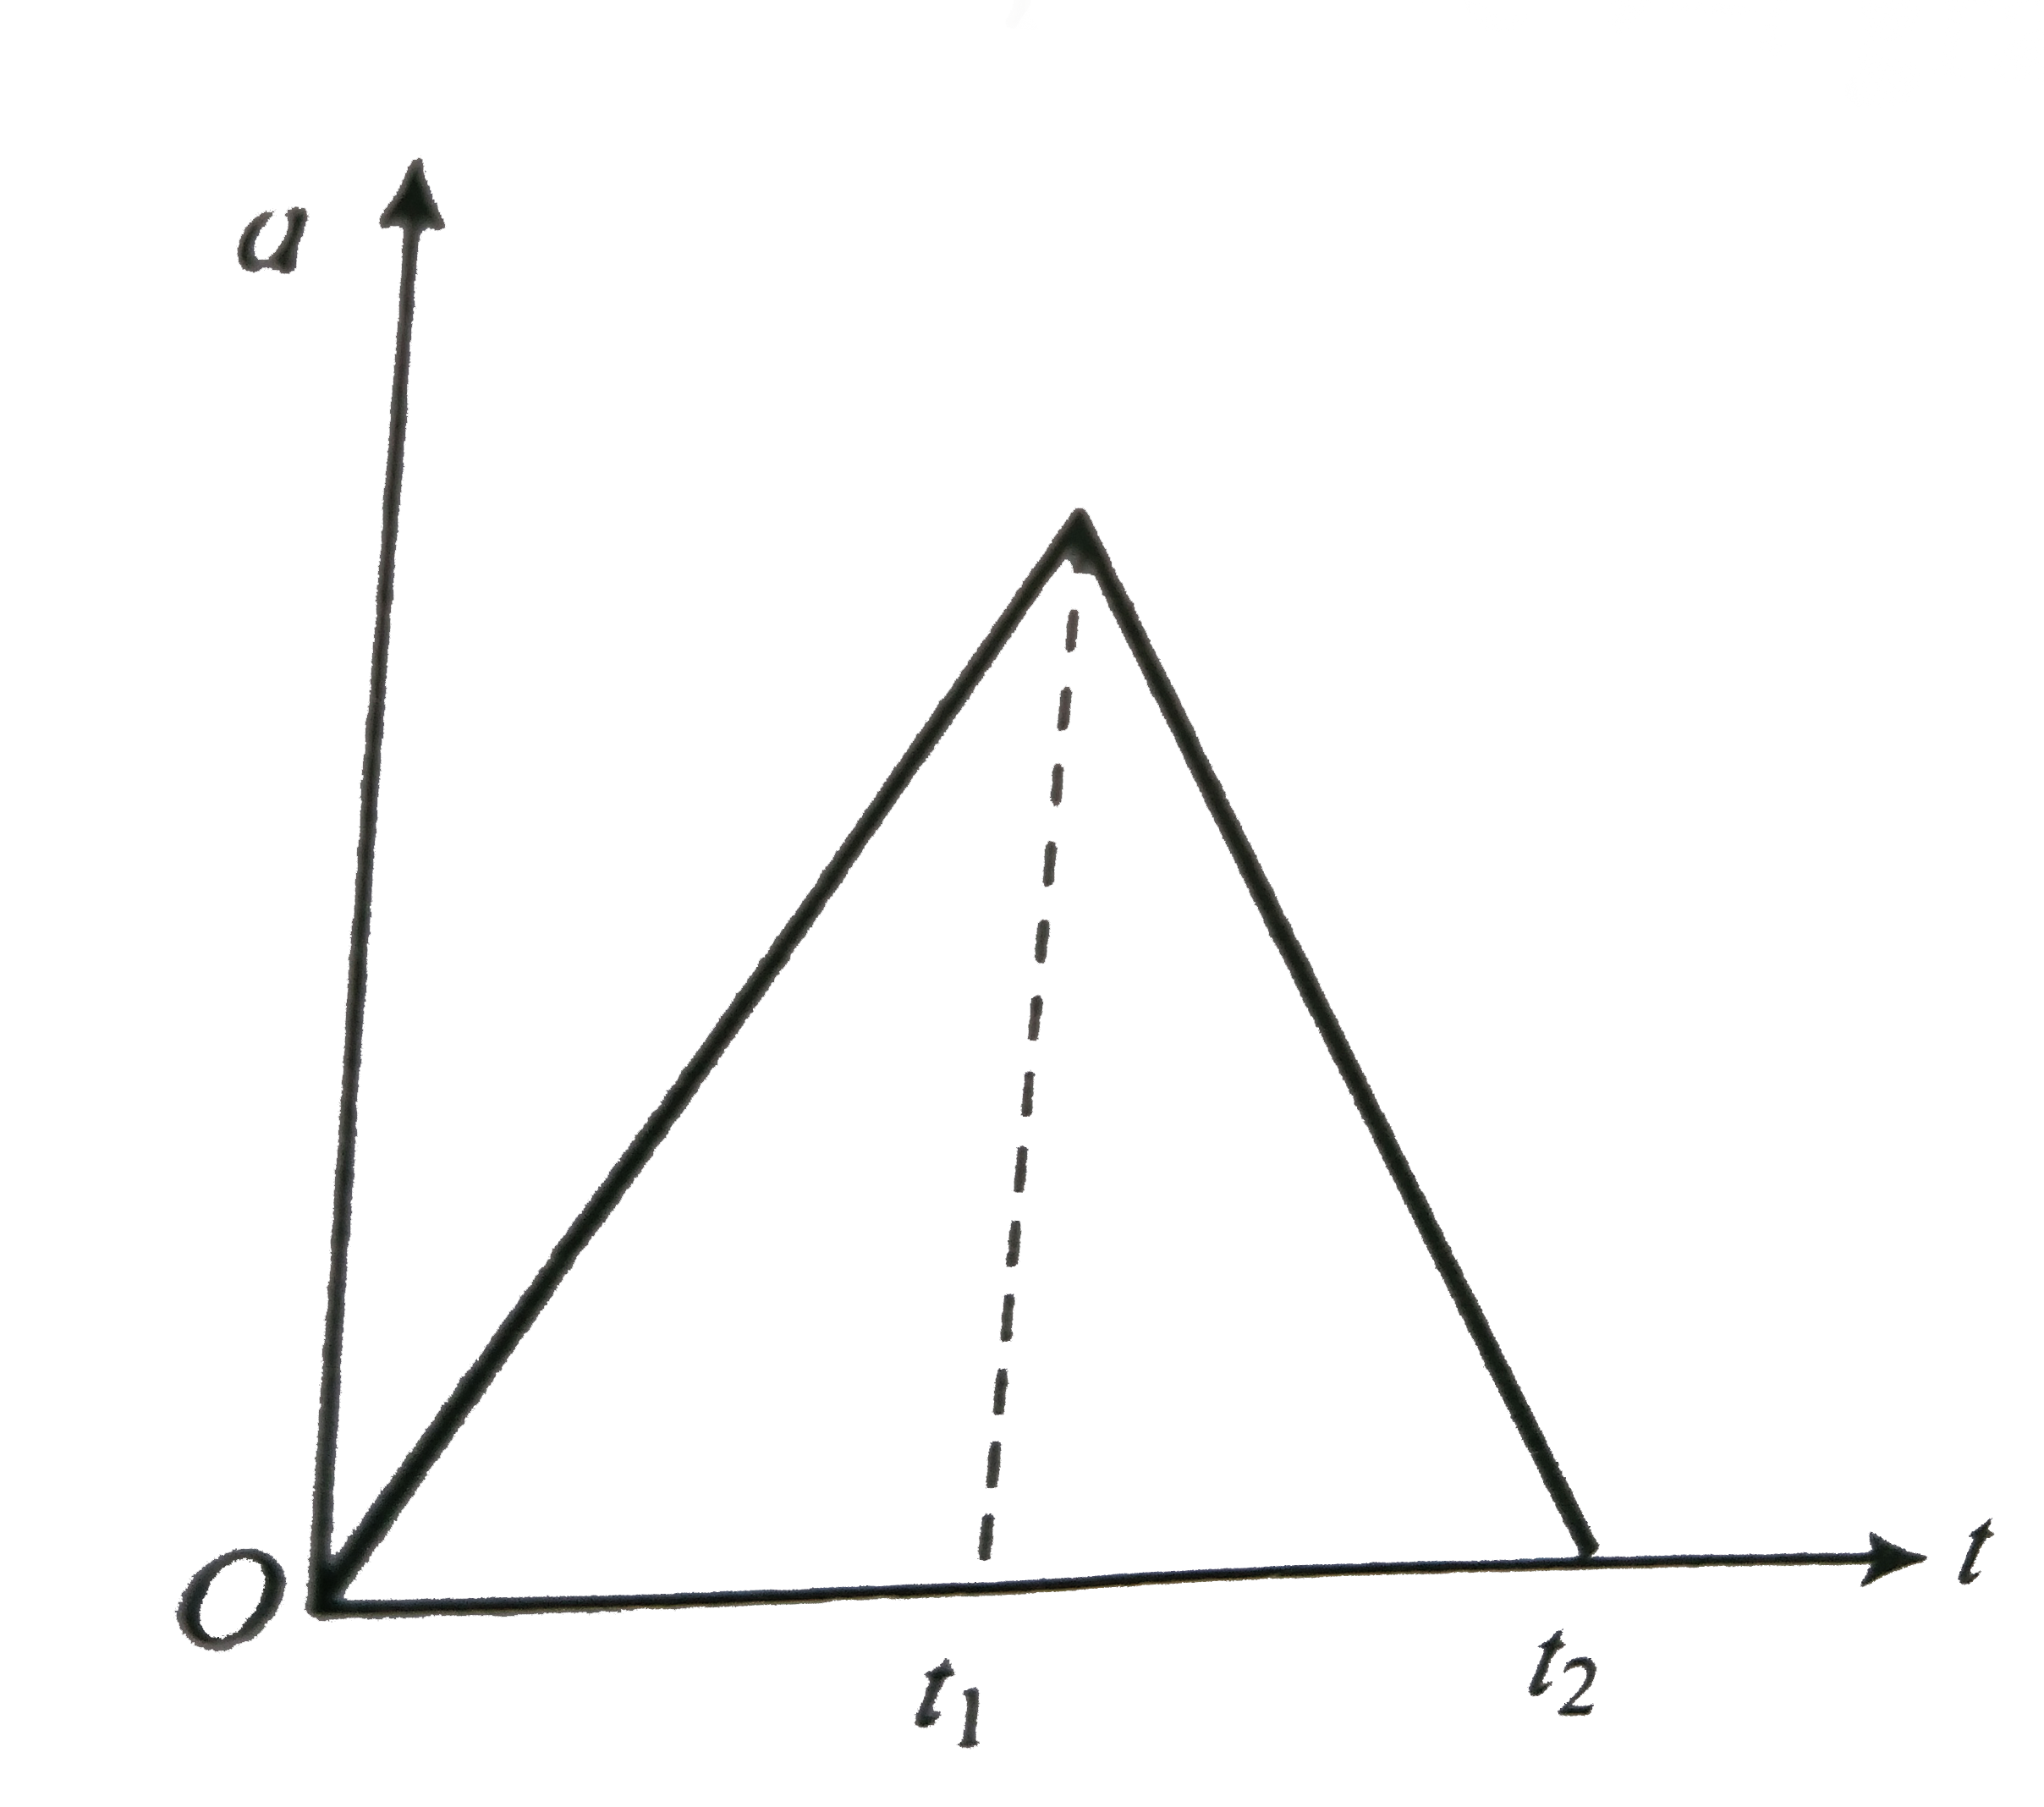
The acceleration versus time graph of a particle is shown in the figure. The respective v−t graph of the particle is .
 .View Solution

