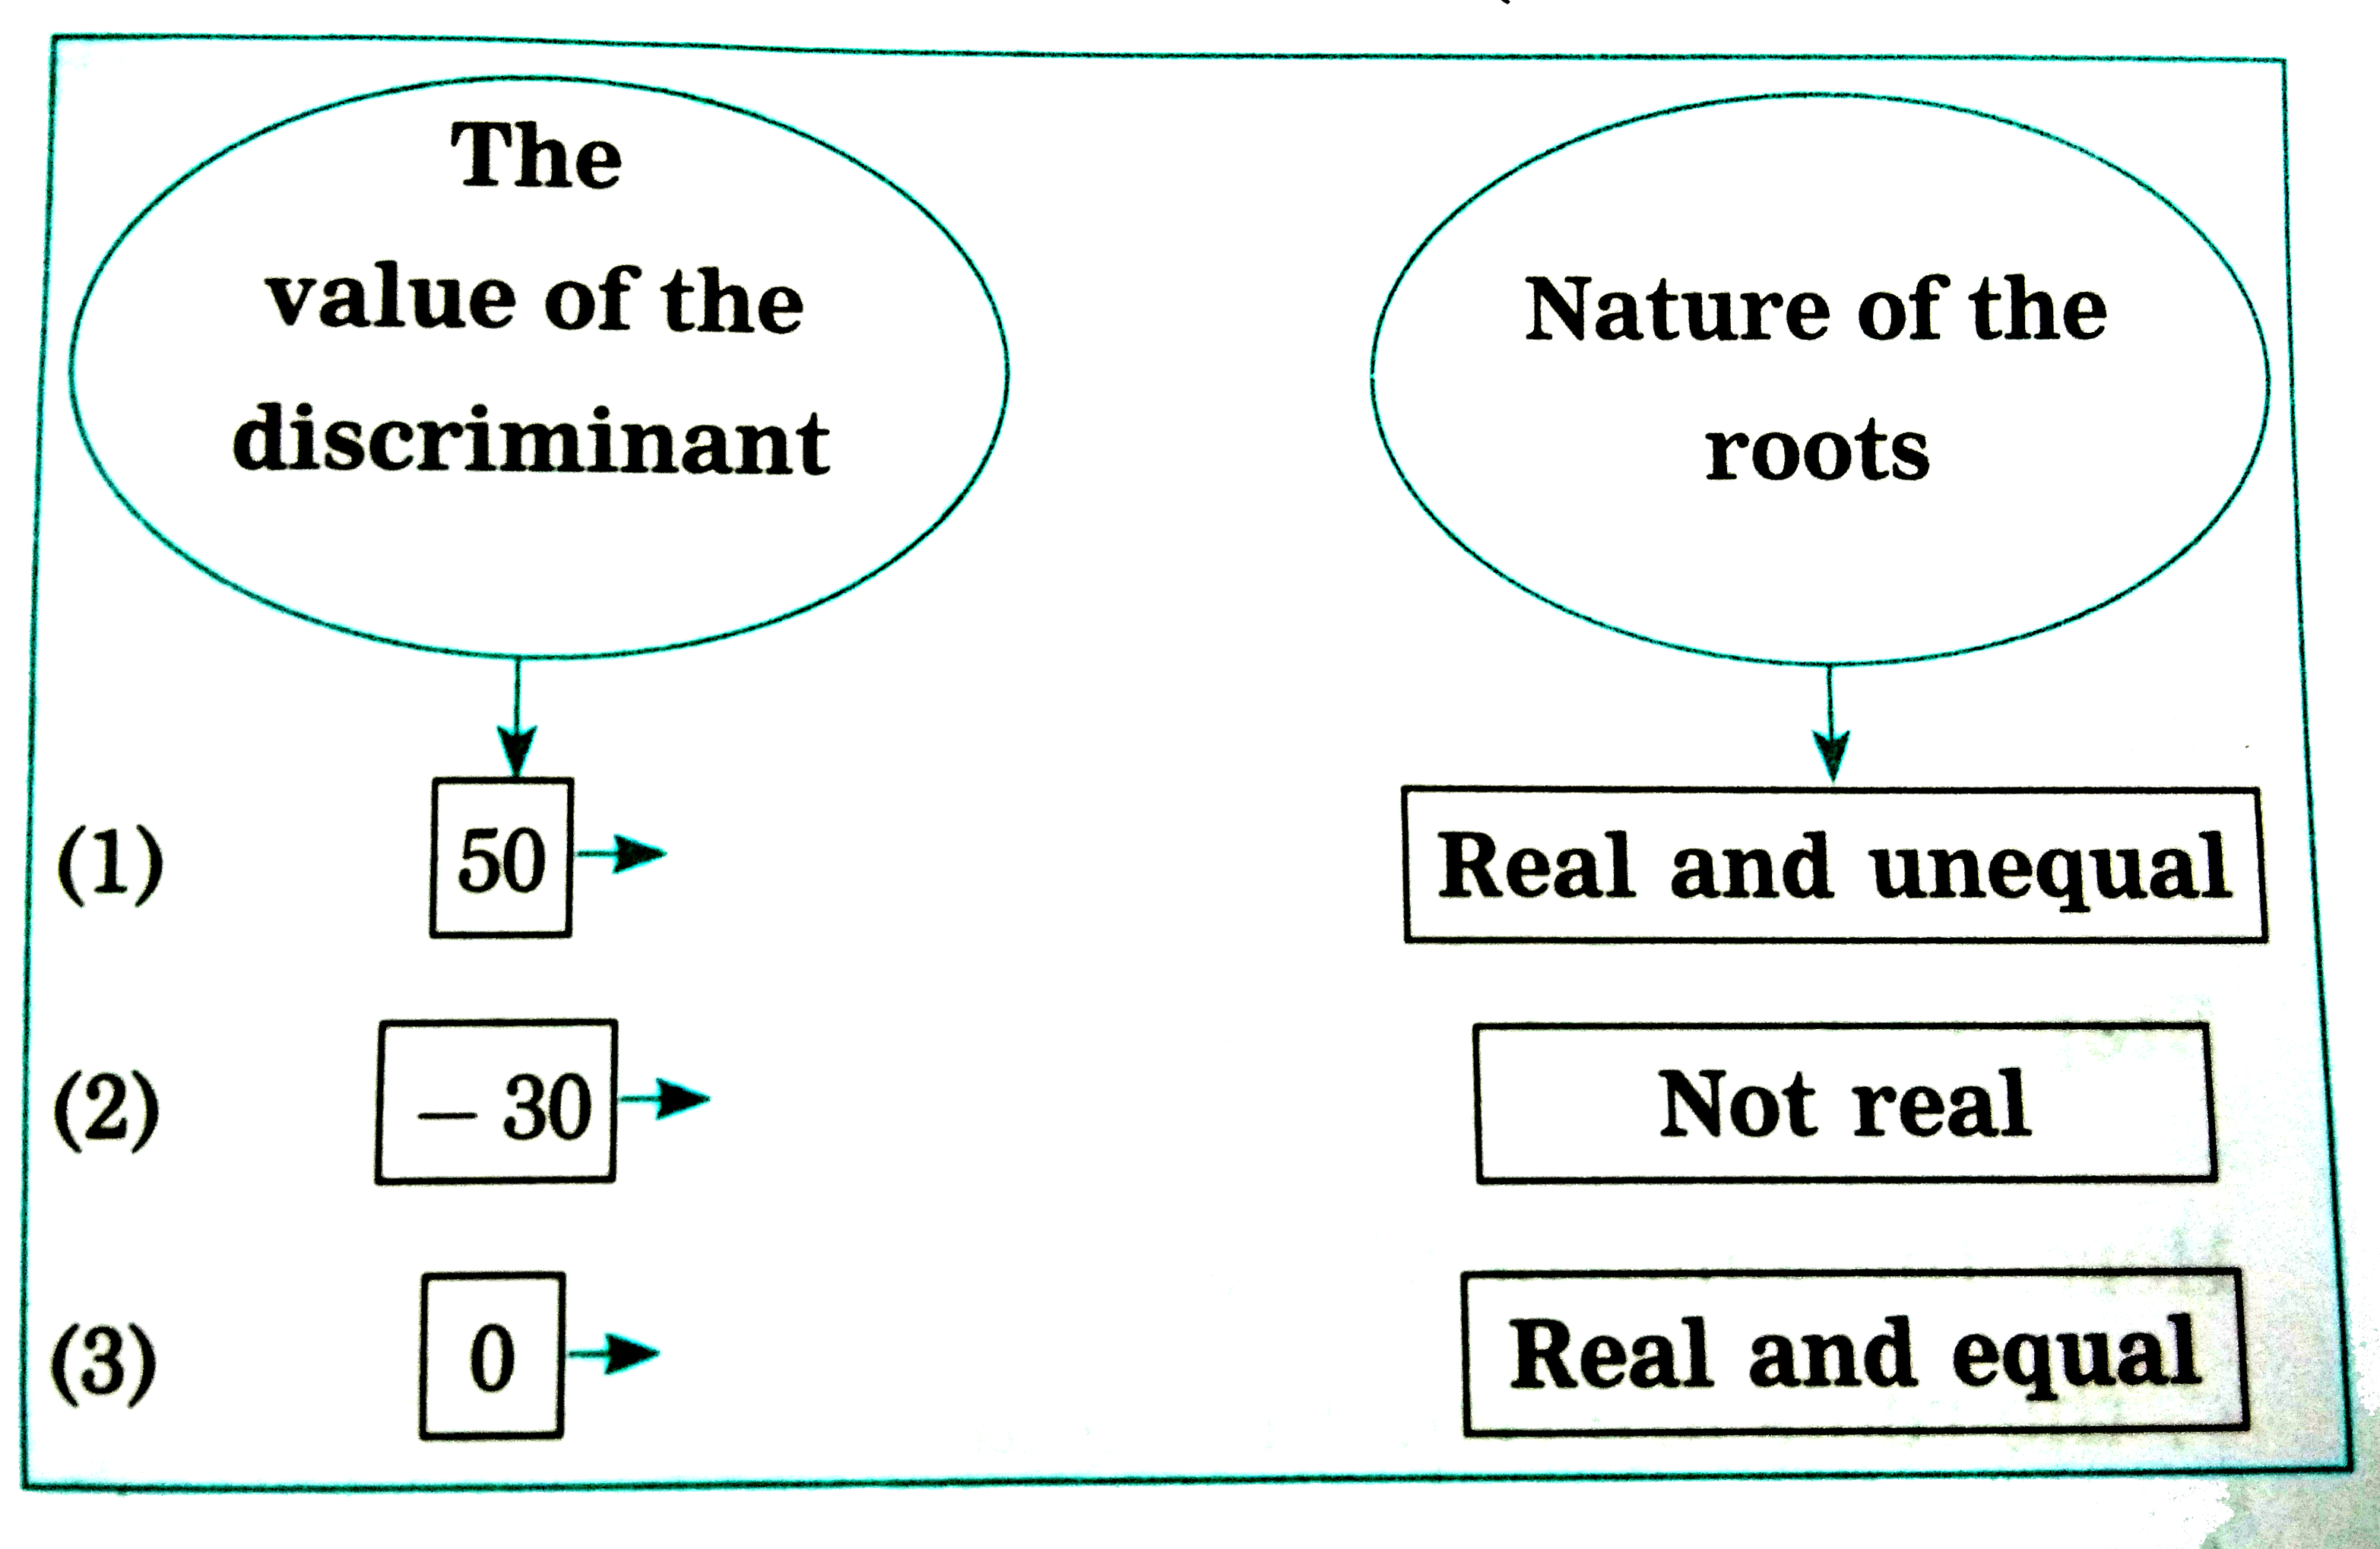
Fill in the blanks : The given pie chart shows the information on consumption of different soap powders in a survey Brand Consumption :
Step by step video & image solution for Fill in the blanks : The given pie chart shows the information on consumption of different soap powders in a survey Brand Consumption : by Maths experts to help you in doubts & scoring excellent marks in Class 8 exams.
Updated on:21/07/2023Similar Questions
Knowledge Check
The data below shows the consumption of rice for different states in India for the year 2012
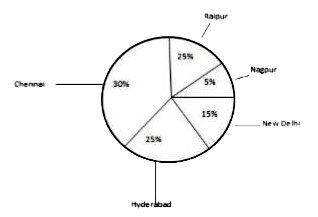
If total rice consumption for the year 2012 is 2 lakh tonnes, then how much rice was consumed by Nagpur?A20,000 tonsB10,000 tonsC1,00,000 tonsD50,000 tons
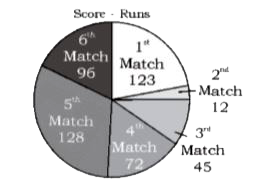
The given pie-chart shows runs scored by A in 6 matches.
In the given pie-chart, what is the increase or decrease in score in match 4 as compared to match 2?
View SolutionThe given pie chart shows expenditure on different type of sport in a particular year . Study the pie chart and answer the question below
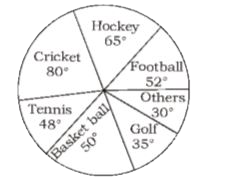
IF total expenditure on sport was Rs 24000000 then total expenditure on cricket and football will be
View SolutionThe given pie chart shows expenditure on different type of sport in a particular year . Study the pie chart and answer the question below
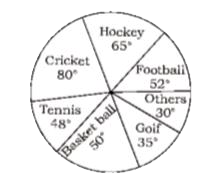
IF in a year the expenditure on sport was 18000000 then expenditure on tennis was how much more than expenditure on golf.
View SolutionIn a pie chart, the central angle for a component value of 240, when the total value is 720, is ______.
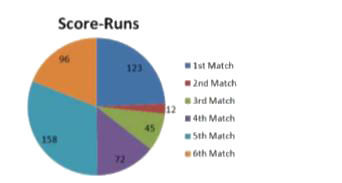
View SolutionThe given pie chart shows runs scored by A in 6 matches
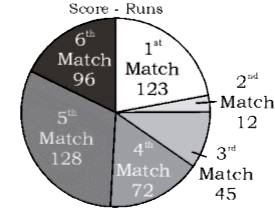
In the given pie chart what is the average runs scored in all matches
View SolutionThe given pie chart shows the percentage distribution of the expenditure incurred in publishing a book study the pie chart and the answer the question based on it.
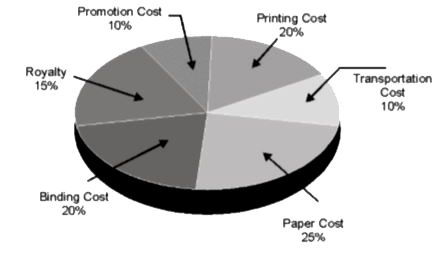
In the given pie chart by what percentage the promotion cost on the book is less than the paper cost?
View SolutionThe given pie-chart, shows the percentage distribution of the expenditure incurred in publishing a book. Study the pie-chart and the answer the questions based on it
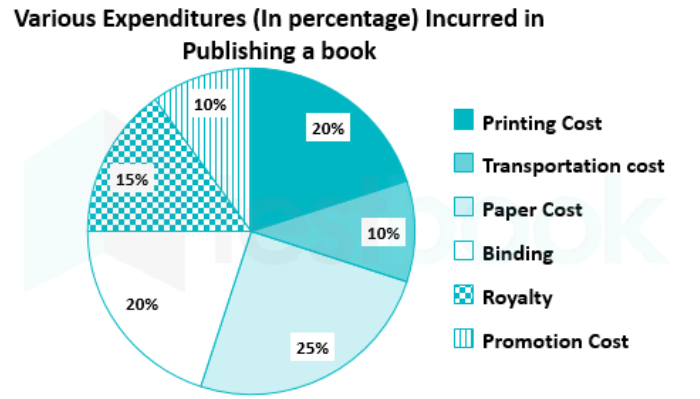
In the given pie-chart by what percentage the Promotion cost on the book is less than the Paper cost?
View Solution

