A cumulative frequency distribution is given below. Convert this into a frequency distribution table. Marks Below 45 Below 60 Below 75 Below 90 Below 105 Below 120 No. of Students 0 8 23 48 85 116
Step by step video & image solution for A cumulative frequency distribution is given below. Convert this into a frequency distribution table. Marks Below 45 Below 60 Below 75 Below 90 Below 105 Below 120 No. of Students 0 8 23 48 85 116 by Maths experts to help you in doubts & scoring excellent marks in Class 9 exams.
Topper's Solved these Questions
Similar Questions
Knowledge Check
- Question 1 - Select One
An incomplete frequency distribution is given below
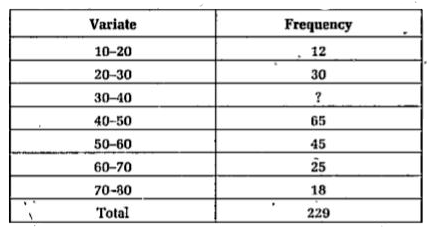
Median value is 46, the missing frequency isA33B35C34D26 - Question 2 - Select One
The truth table given below represents
 AAND gateBNOR gateCOR gateDNAND gate
Find the mean and variance of the frequency distribution given below
 View Solution
The distribution given below show the marks of 100 students of a class:
then find Ogive medium of data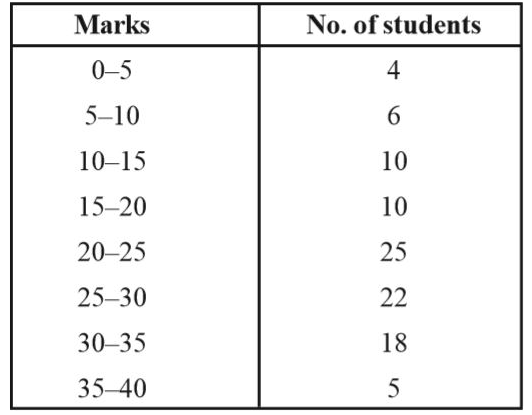 View Solution
The weights of 20 students in a class are given below.
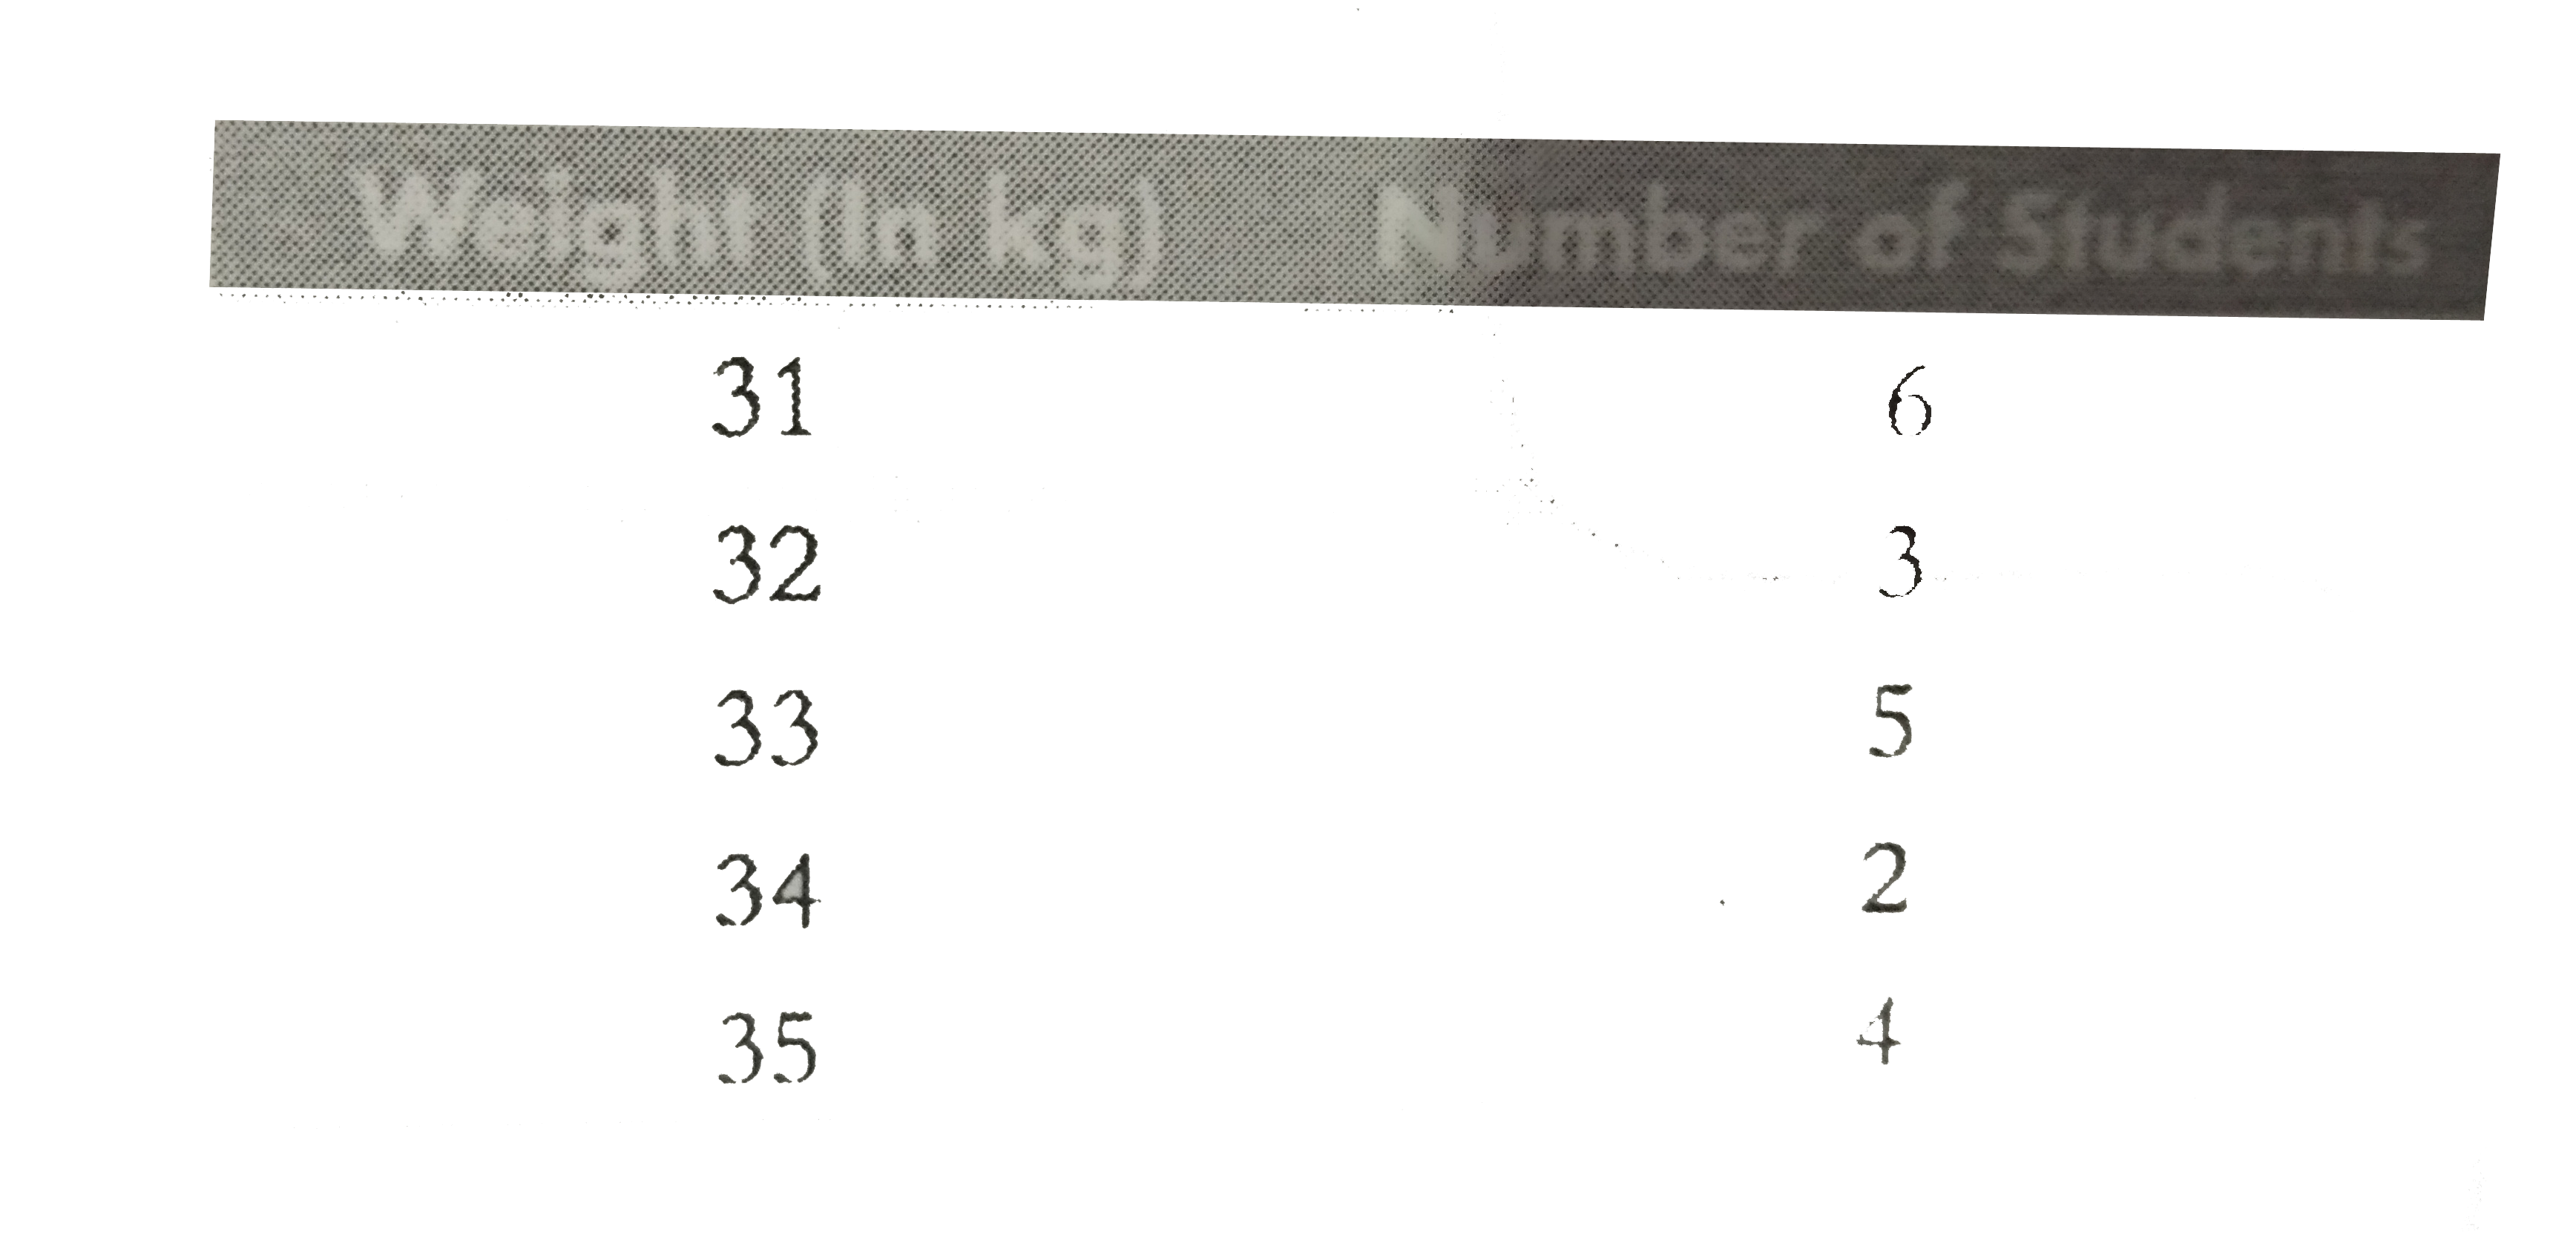
Find the median of the above frequency distribution .View SolutionRead the frequency distribution table given below and answer the questions that follow:
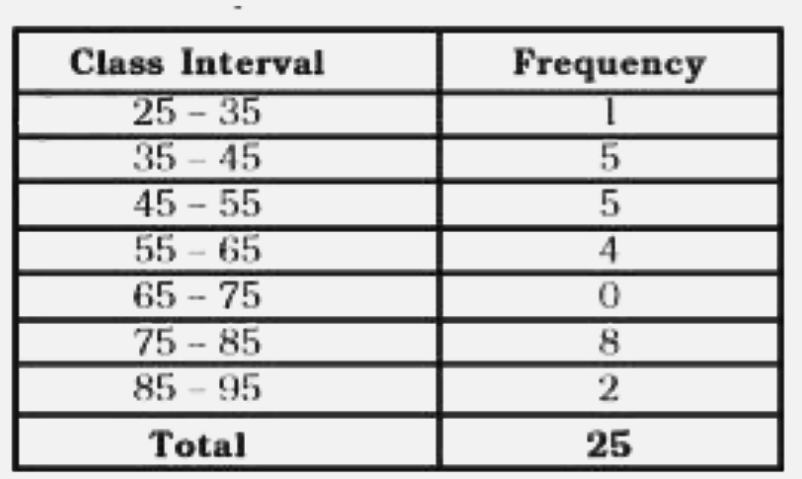
What is the lower limit of the last class?View SolutionRead the frequency distribution table given below and answer the questions that follow:
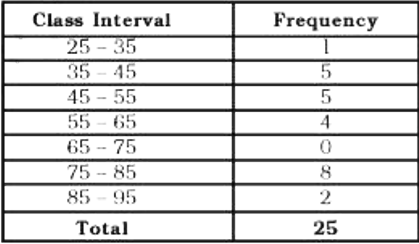
Class interval which has the lowest frequency.View SolutionRead the frequency distribution table given below and answer the questions that follow:
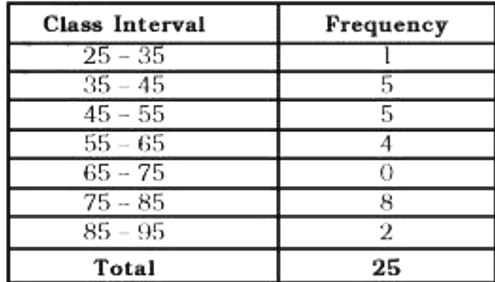
What is the class size of the intervals?View Solution


