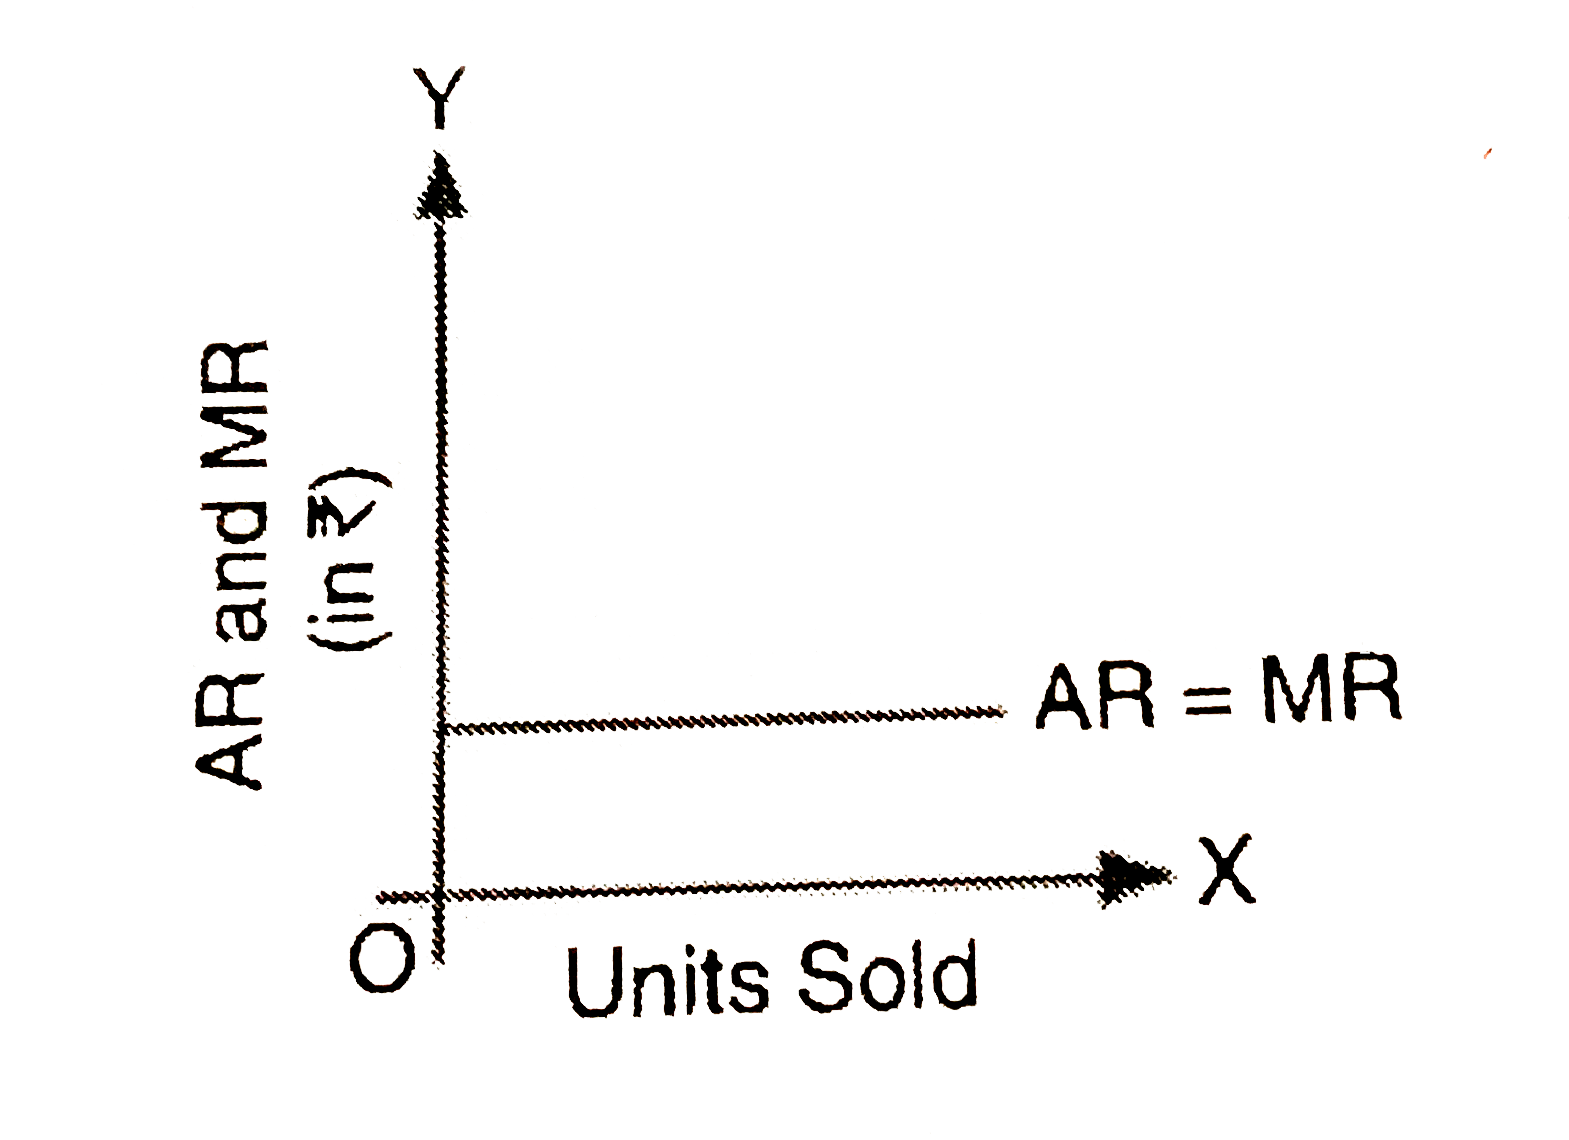
The relationship between AR and MR depicted in the following diagram is possible when :

A
Price remains constant with rise in output
B
Price falls with rise in output
C
Price initially falls and then remains constant with rise in output
D
None of these
Text Solution
The correct Answer is:a
|
Topper's Solved these Questions
- REVENUE BOOK - SANDEEP GARGCHAPTER - REVENUE EXERCISE - VERY SHORT ANSWER TYPE QUESTIONS
21 Videos
- REVENUE BOOK - SANDEEP GARGCHAPTER - REVENUE EXERCISE - SHORT ANSWER TYPE QUESTIONS
9 Videos
- REVENUE BOOK - SANDEEP GARGCHAPTER - REVENUE EXERCISE - GUIDELINES TO NCERT QUESTIONS
8 Videos
- PRODUCTION FUNCTIONBOOK - SANDEEP GARGCHAPTER - PRODUCTION FUNCTIONEXERCISE - Practicals on TP, AP and MP
14 Videos
- SUPPLY BOOK - SANDEEP GARGCHAPTER - SUPPLY EXERCISE - UNSOLVED PARCTICALS
55 Videos
Similar Questions
Knowledge Check
The relationship in an ecosystem can be depicted in:
Apyramid of energyBpyramid of biomassCpyramid of numbersDall of these
What is relationship between AR and MR , when price remains constant ?
View SolutionExplain the relation between AR and MR under monopoly. Use diagram.
View SolutionFind out AR and MR :

View SolutionWhat is the relationship between AR and MR when price falls with rise in output ?
View SolutionWhat is relationship between TR and MR when price falls with rise in output ?
View SolutionThe type of ovule depicted in this diagram is

View SolutionDiscuss the relationship between AR and MR when price is reduced to sell more .
View Solution

