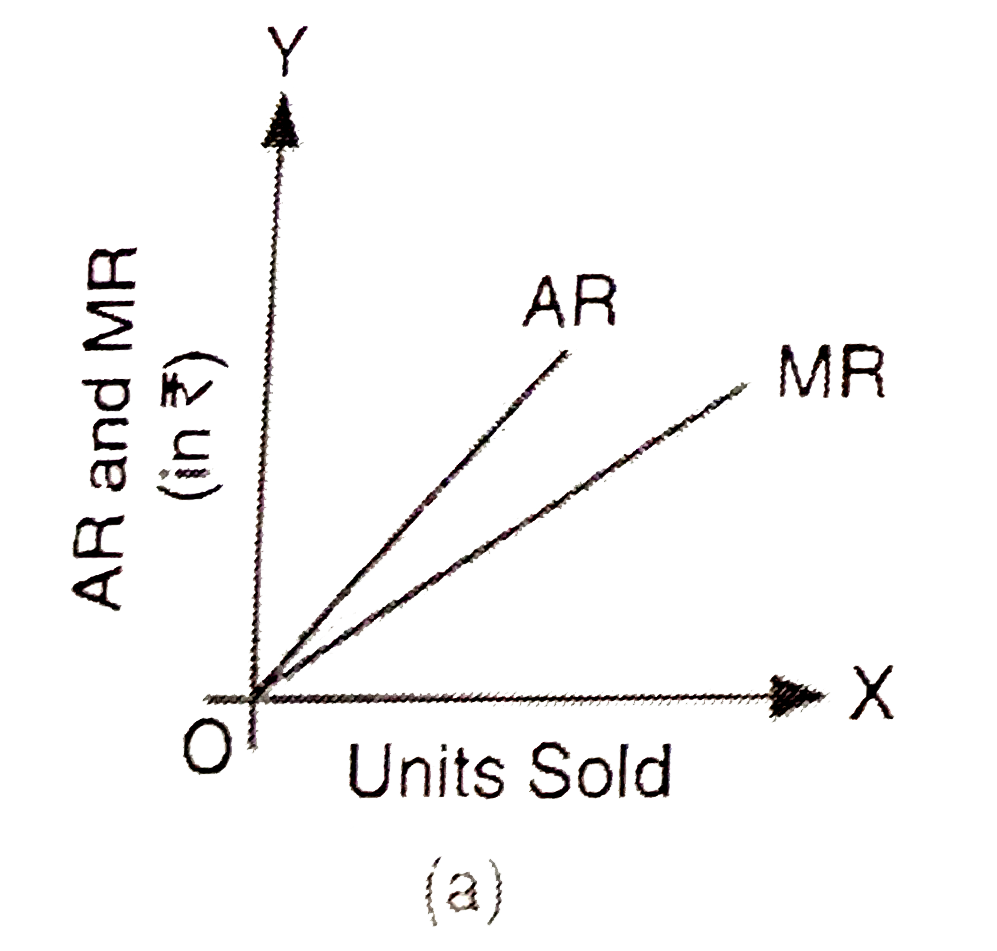
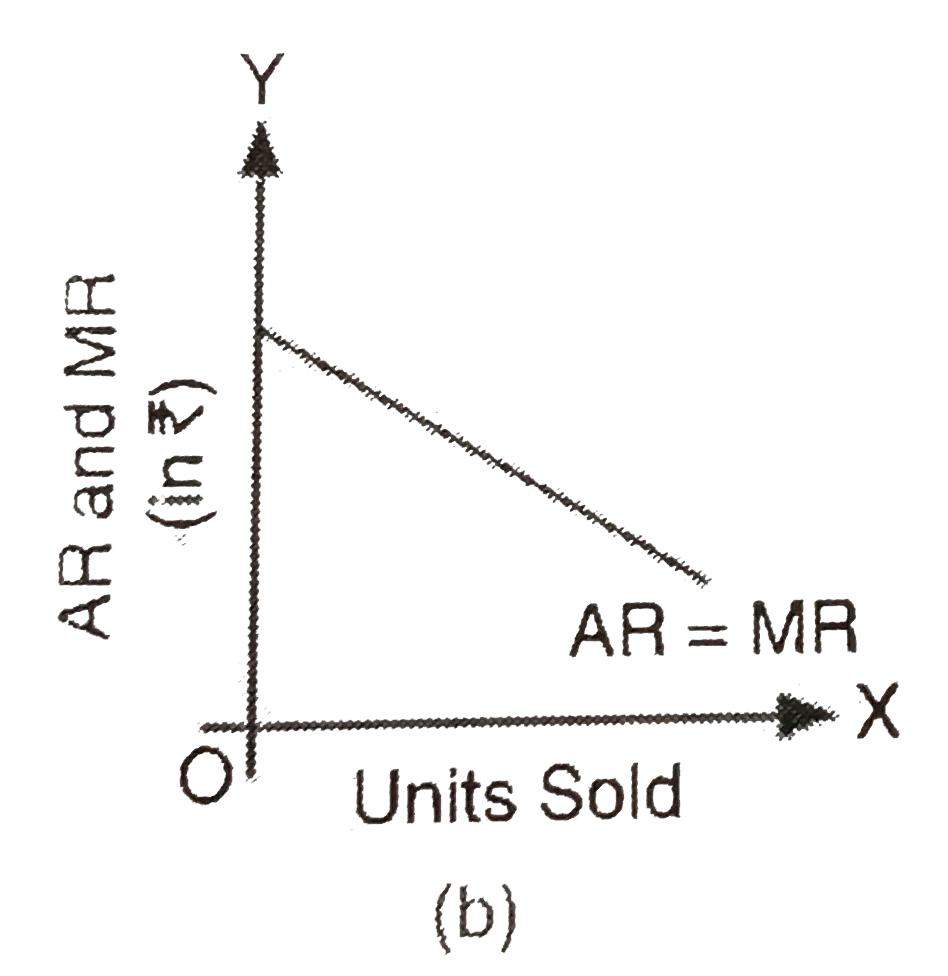
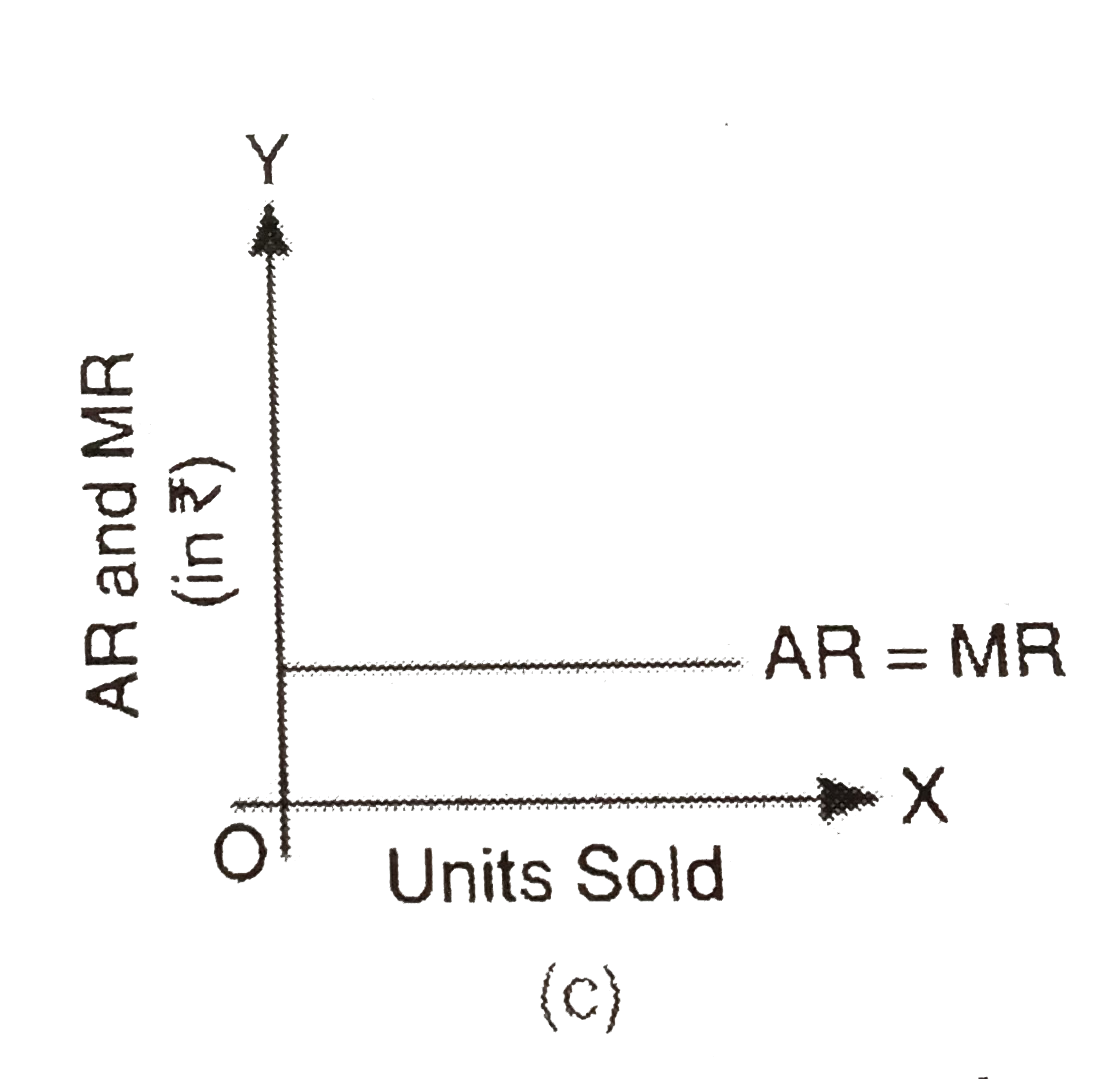
Which of the following diagram correctly depicts the relation between AR and MR when price falls with rise in output ?
A
B
C
D
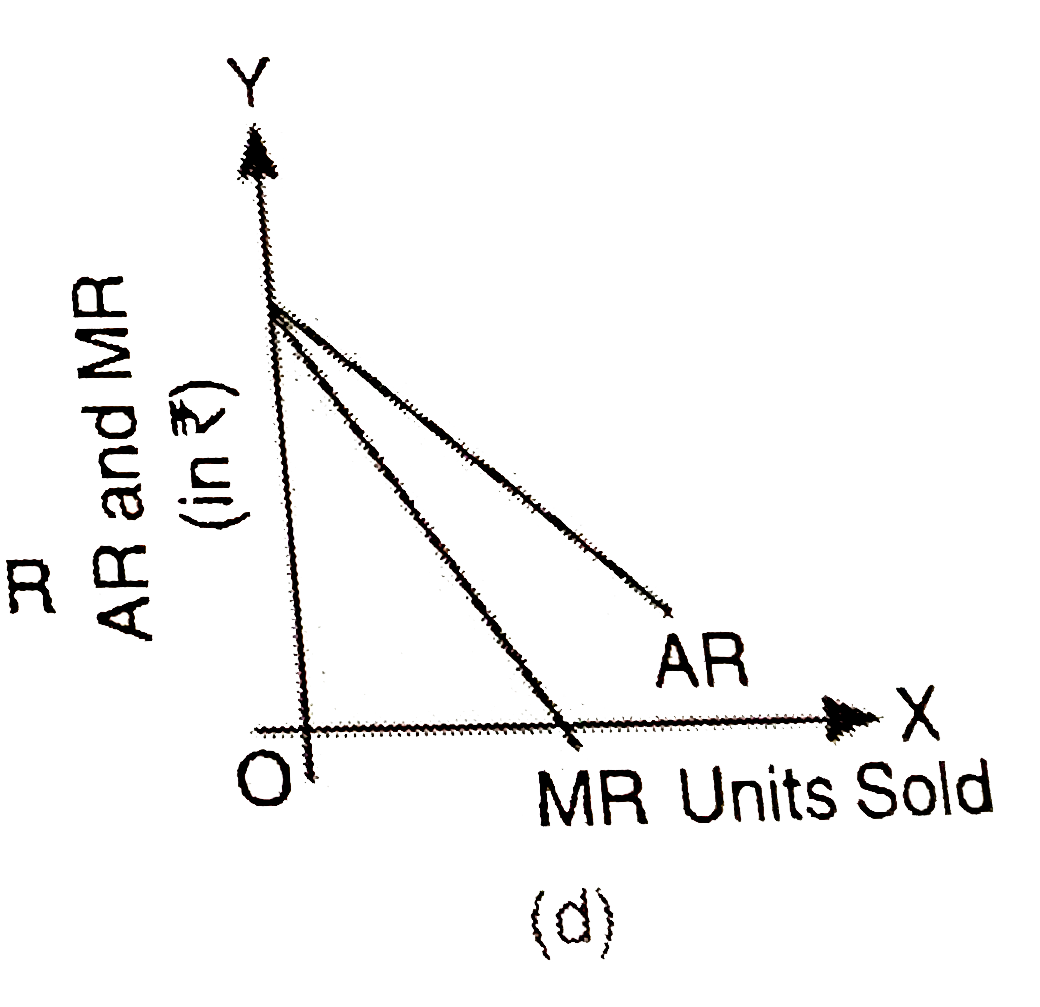
Text Solution
The correct Answer is:d
|
Topper's Solved these Questions
- REVENUE BOOK - SANDEEP GARGCHAPTER - REVENUE EXERCISE - VERY SHORT ANSWER TYPE QUESTIONS
21 Videos
- REVENUE BOOK - SANDEEP GARGCHAPTER - REVENUE EXERCISE - SHORT ANSWER TYPE QUESTIONS
9 Videos
- REVENUE BOOK - SANDEEP GARGCHAPTER - REVENUE EXERCISE - GUIDELINES TO NCERT QUESTIONS
8 Videos
- PRODUCTION FUNCTIONBOOK - SANDEEP GARGCHAPTER - PRODUCTION FUNCTIONEXERCISE - Practicals on TP, AP and MP
14 Videos
- SUPPLY BOOK - SANDEEP GARGCHAPTER - SUPPLY EXERCISE - UNSOLVED PARCTICALS
55 Videos
Similar Questions
Knowledge Check
Which of the following diagram correctly depicts the ralation between AC and MC ?
A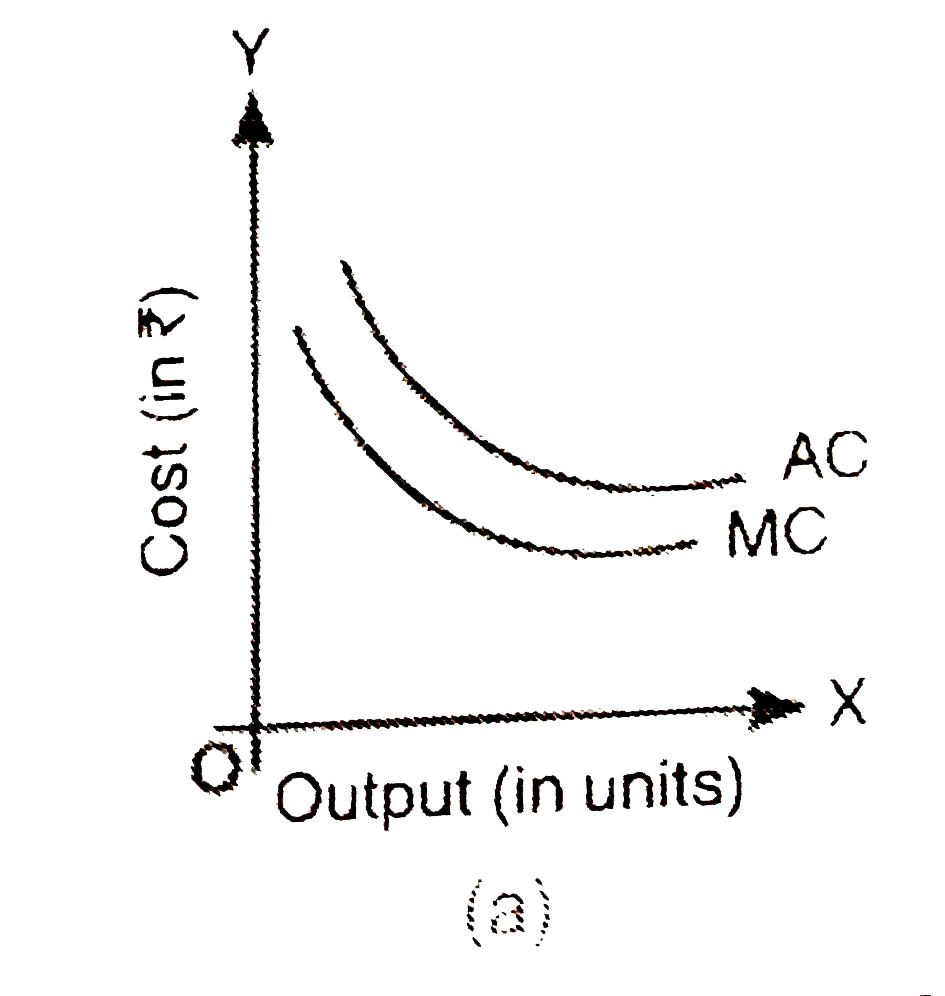 B
B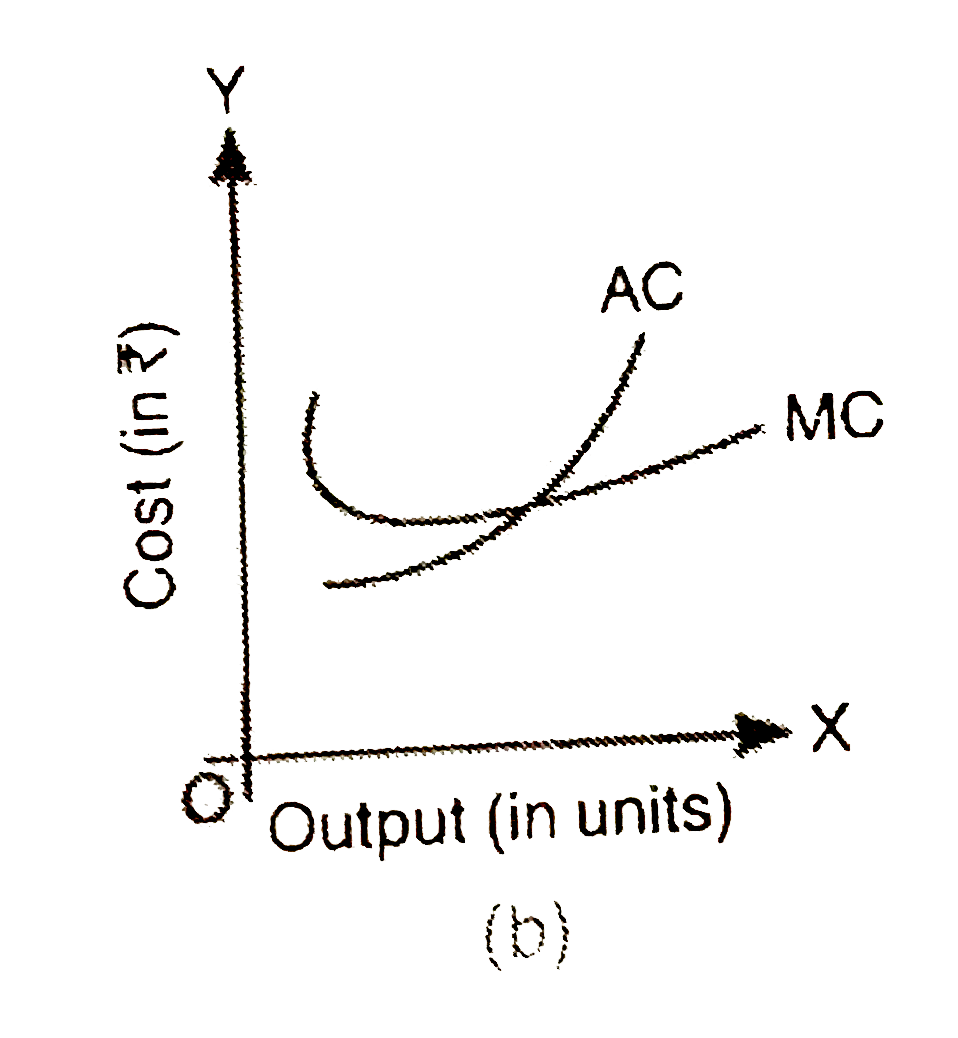 C
C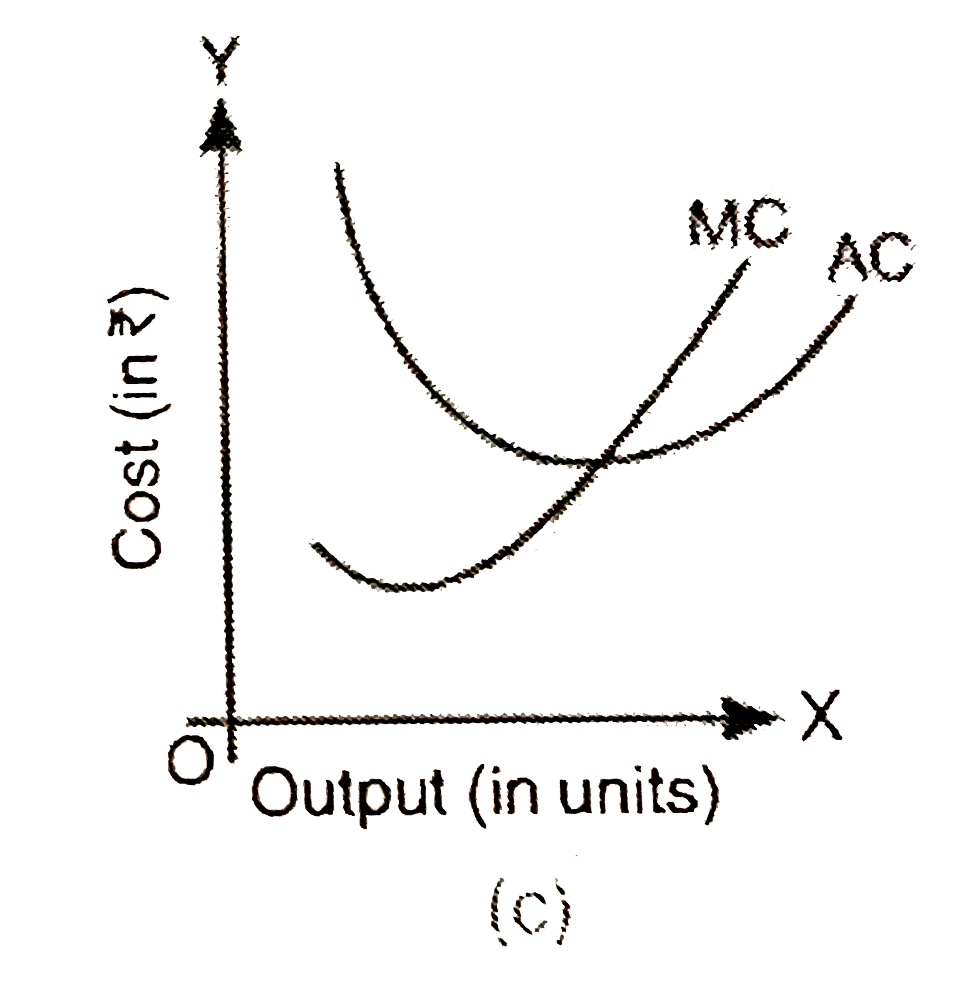 D
D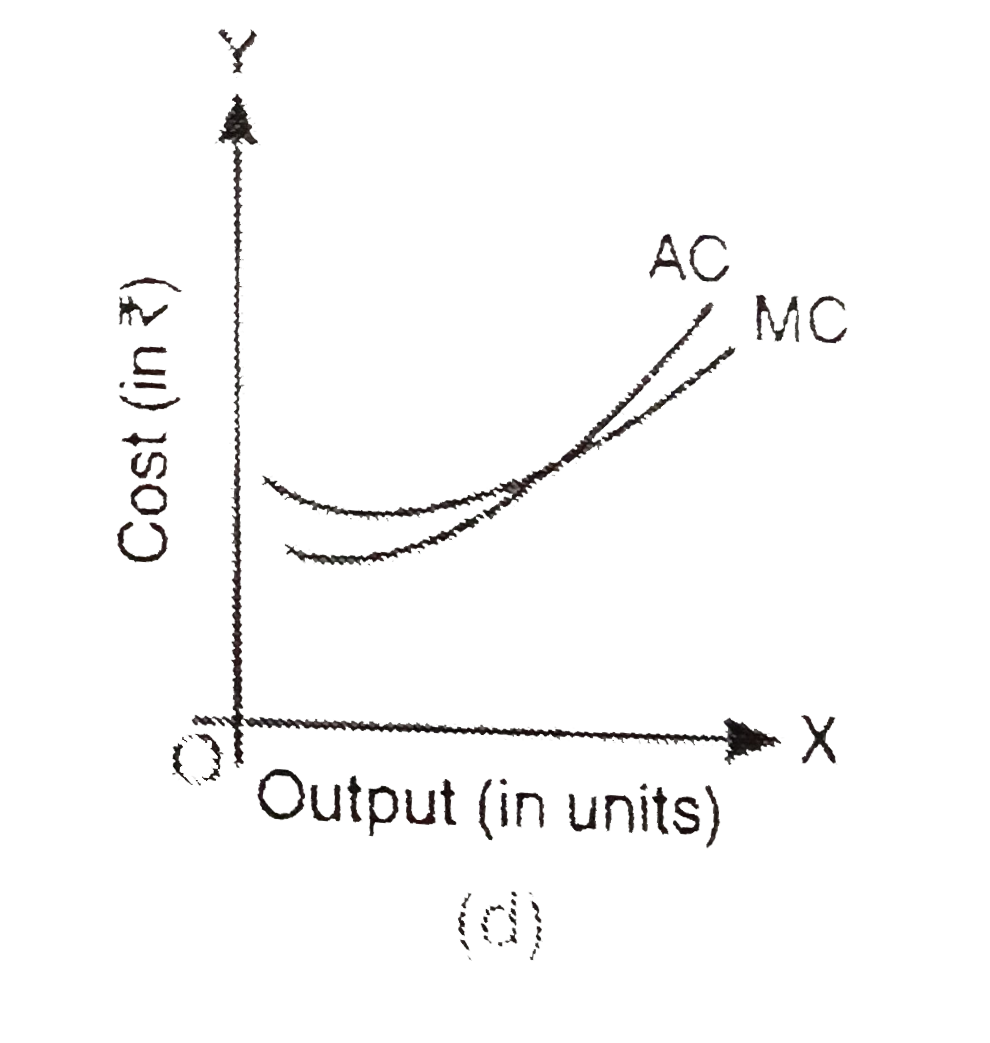
When price falls with rise in output, then :
AMR curve is steeper than AR curveBAR curve is steeper than MR curveCMR and AR curves coincide in a horizontal straight line parallel to the X-axisDNone of theseWhich of the following diagram correctly depicts the relationship between TC,TFC and TVC ?
A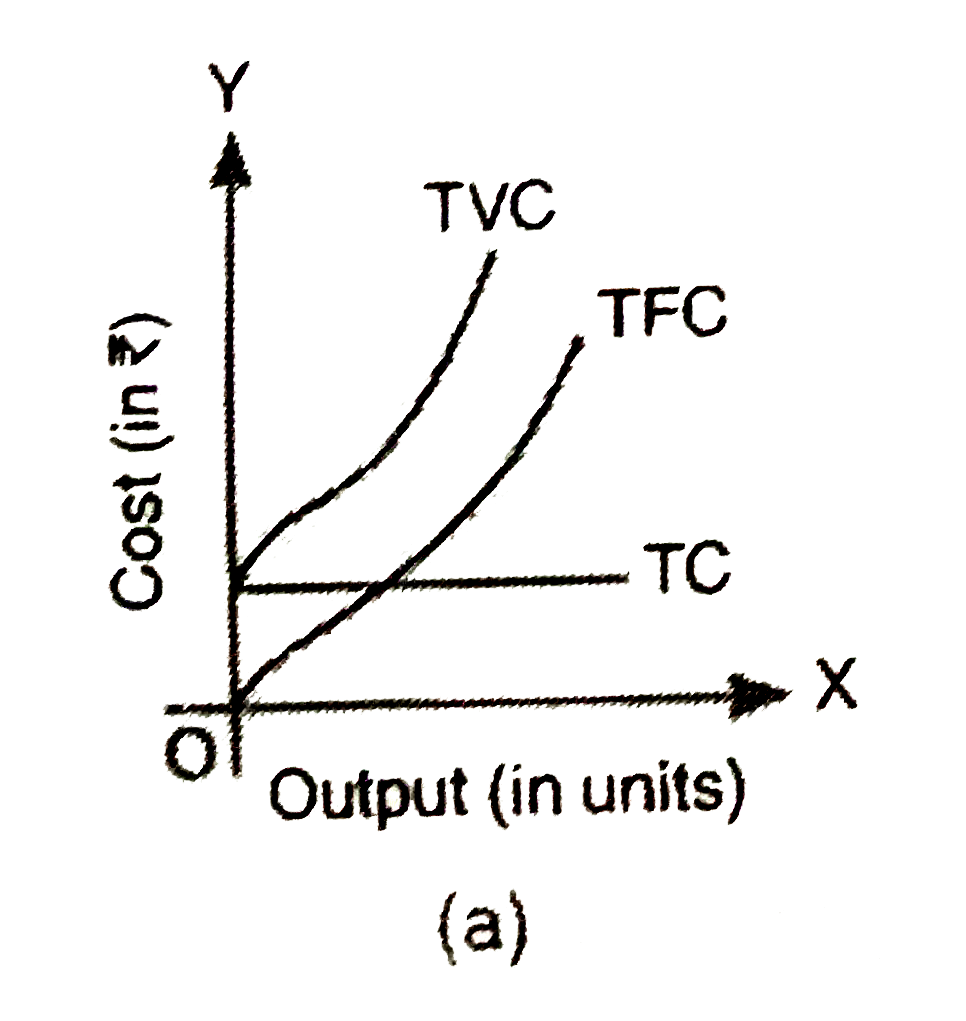 B
B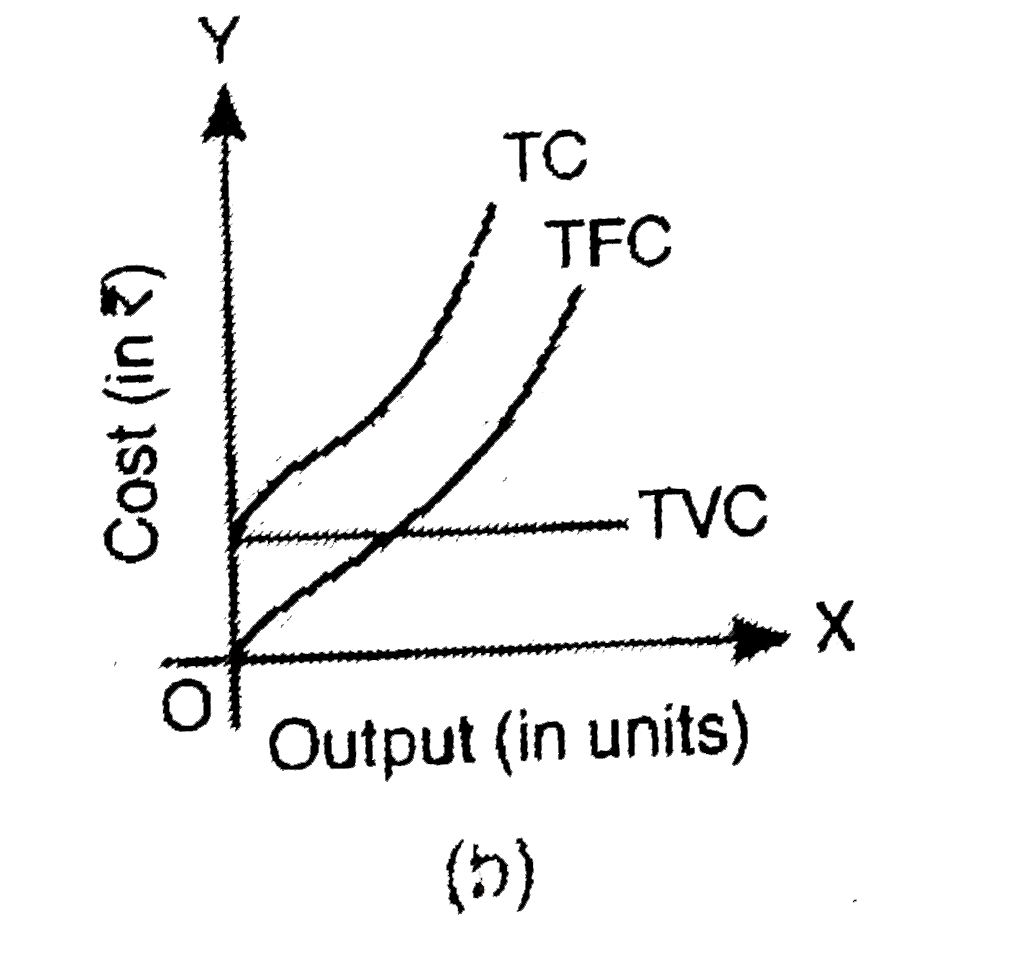 C
C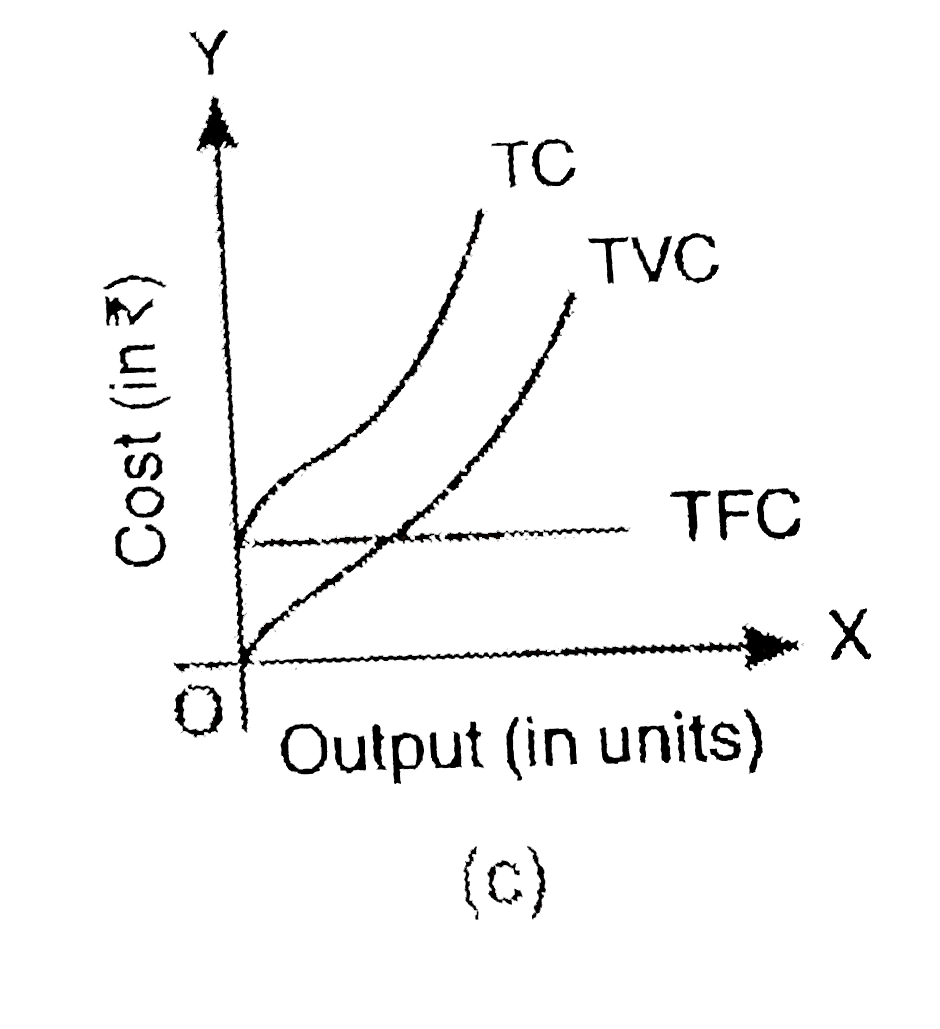 D
D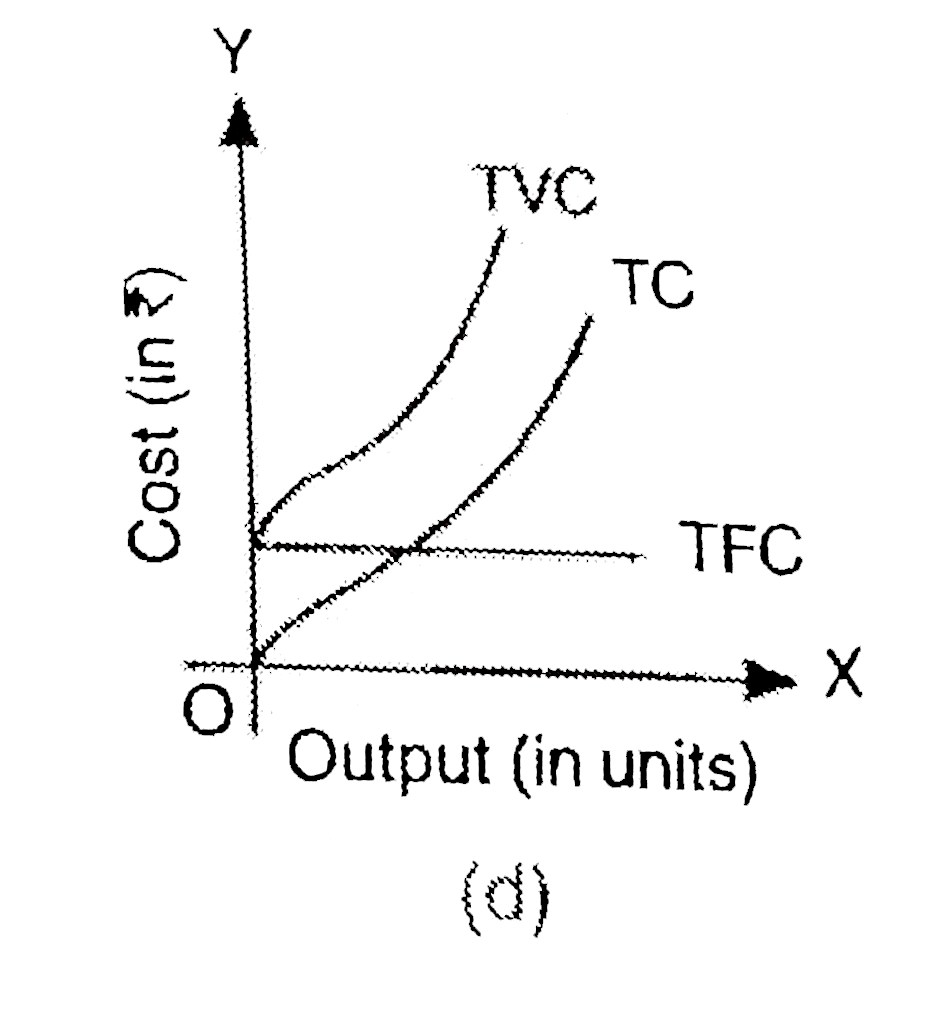
AR__________when price falls with rise in output
View SolutionWhich of the following formula is not correctly depicted ?
View SolutionWhich of the following diagrams best depicts the relation among Red, Pink and Colour?
View SolutionWhich of the following diagram correctly depicts the situation of Less Demand ?
View SolutionWhich of the following correctly depicts the recongnition site for EcoRI ?
View Solution
