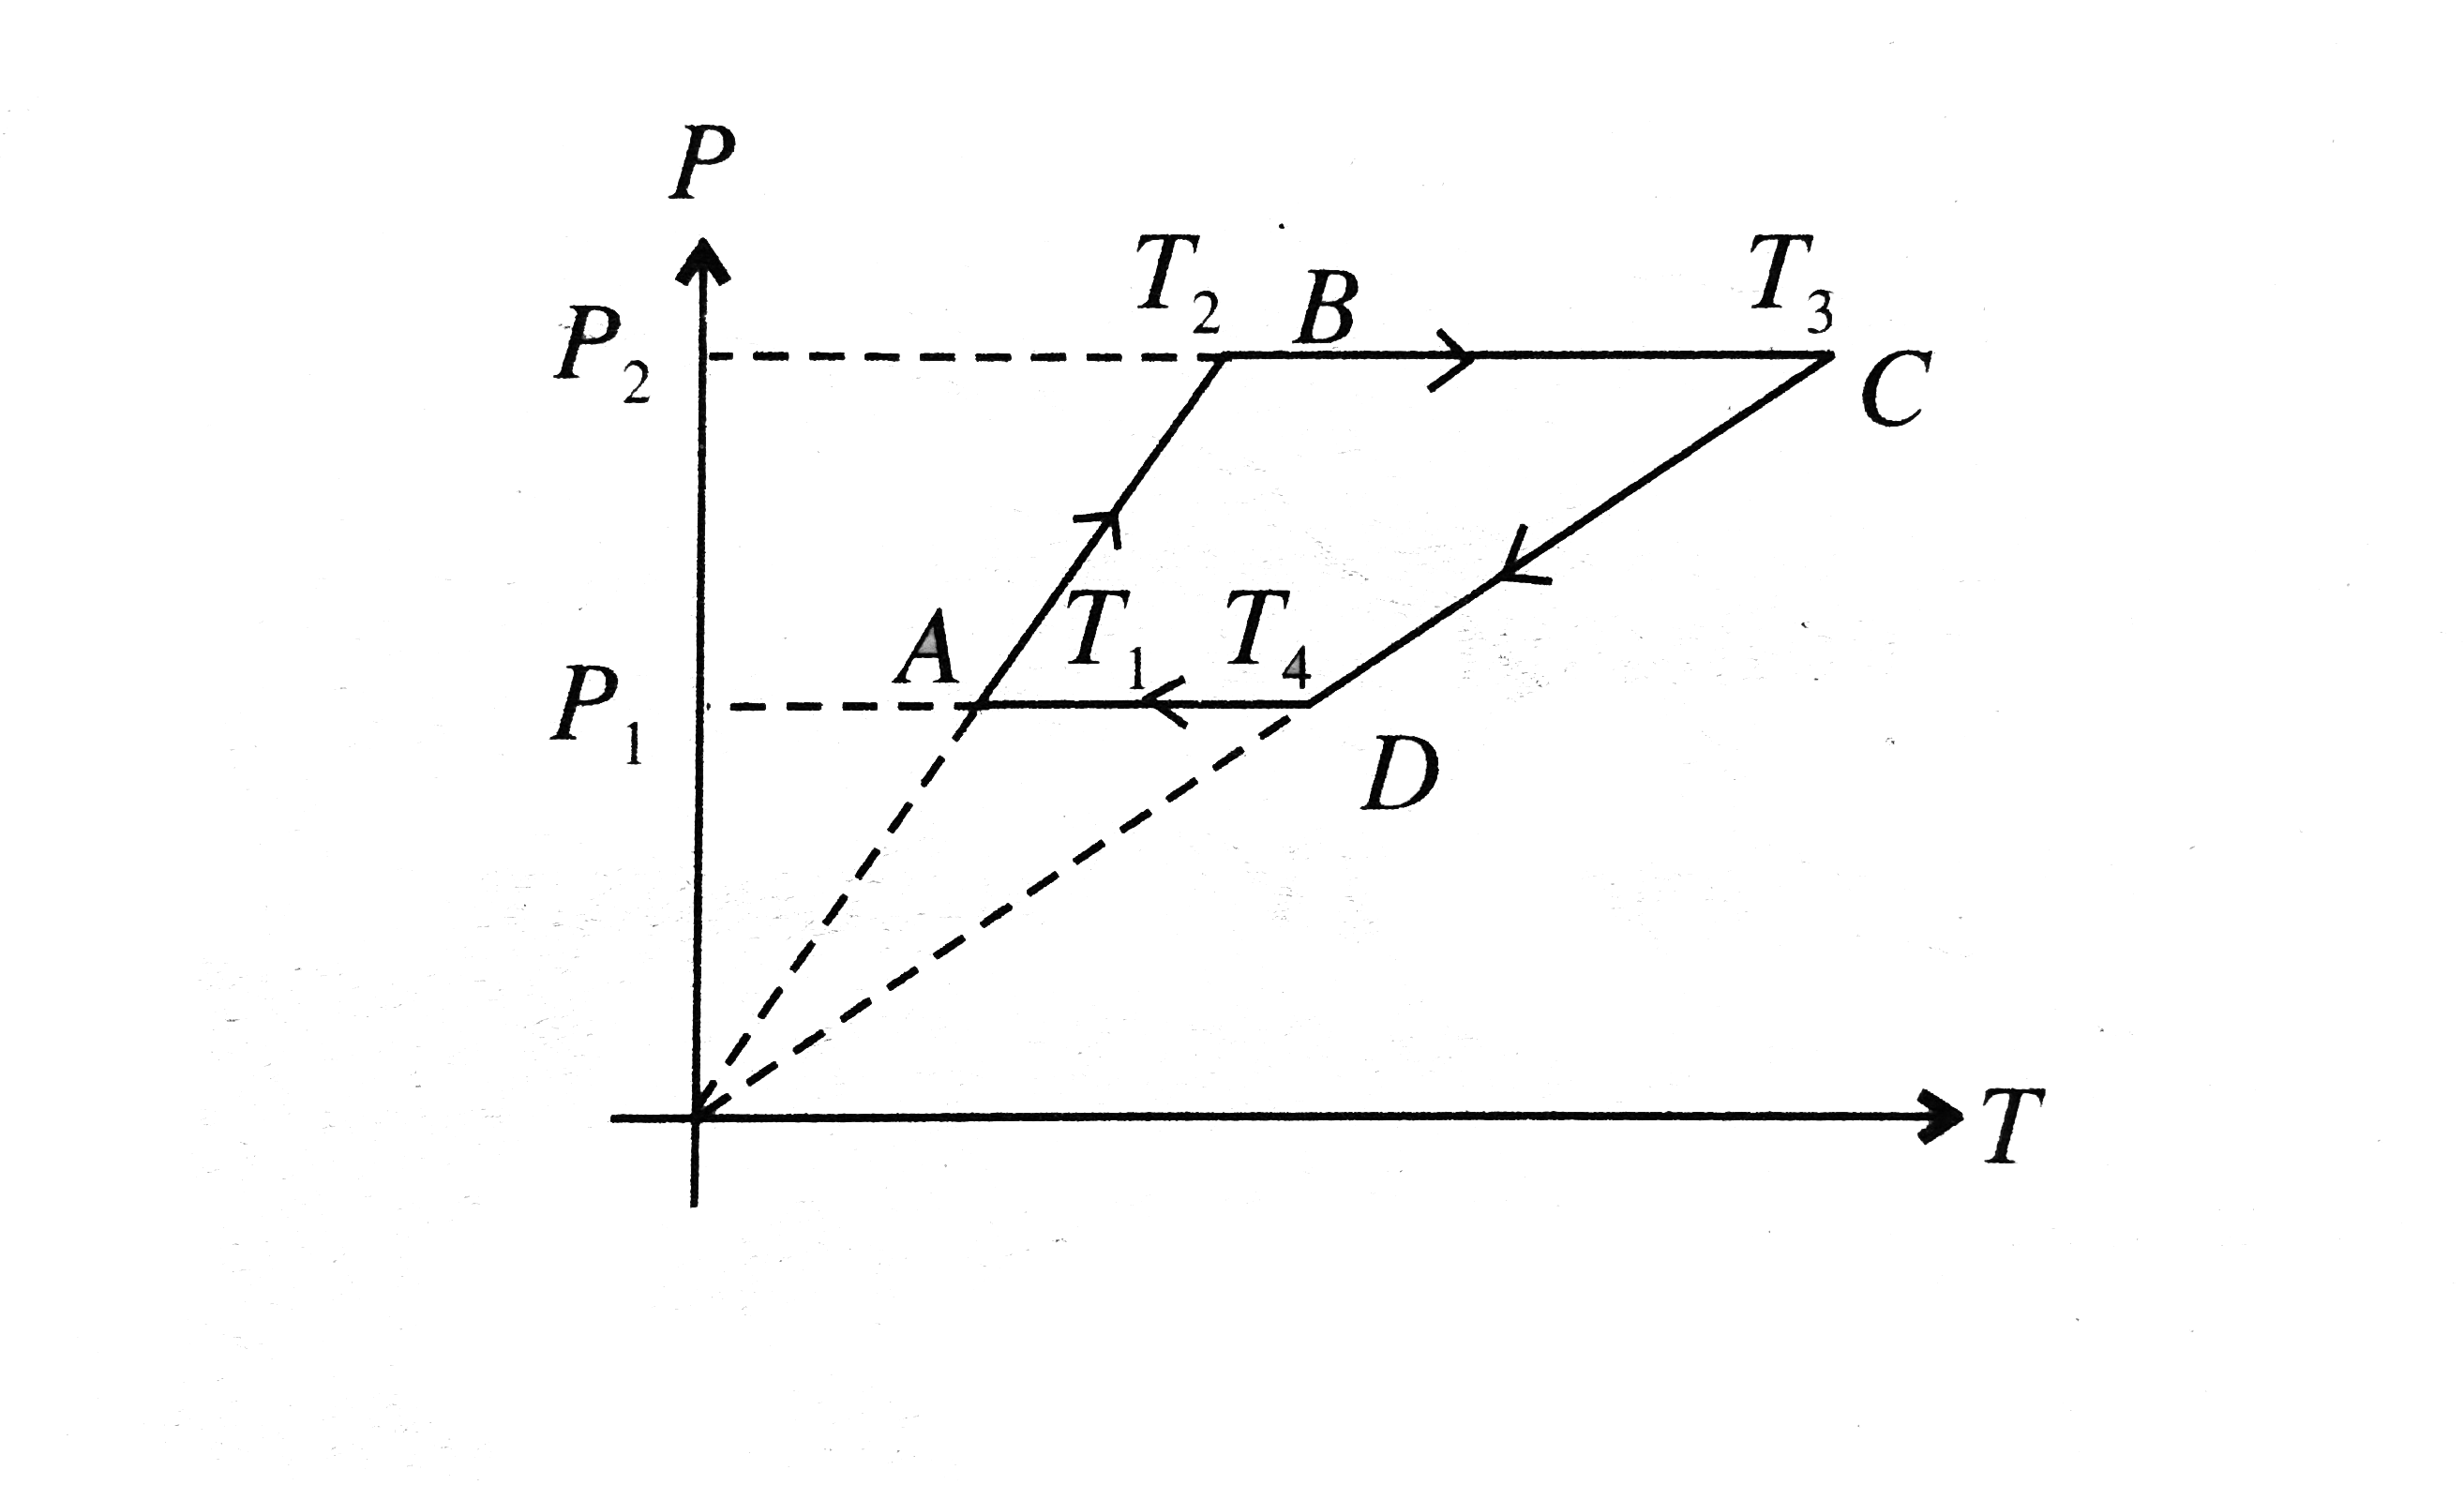
Find out the work done in the given graph. Also draw the corresponding T -V curve and P-T curve.
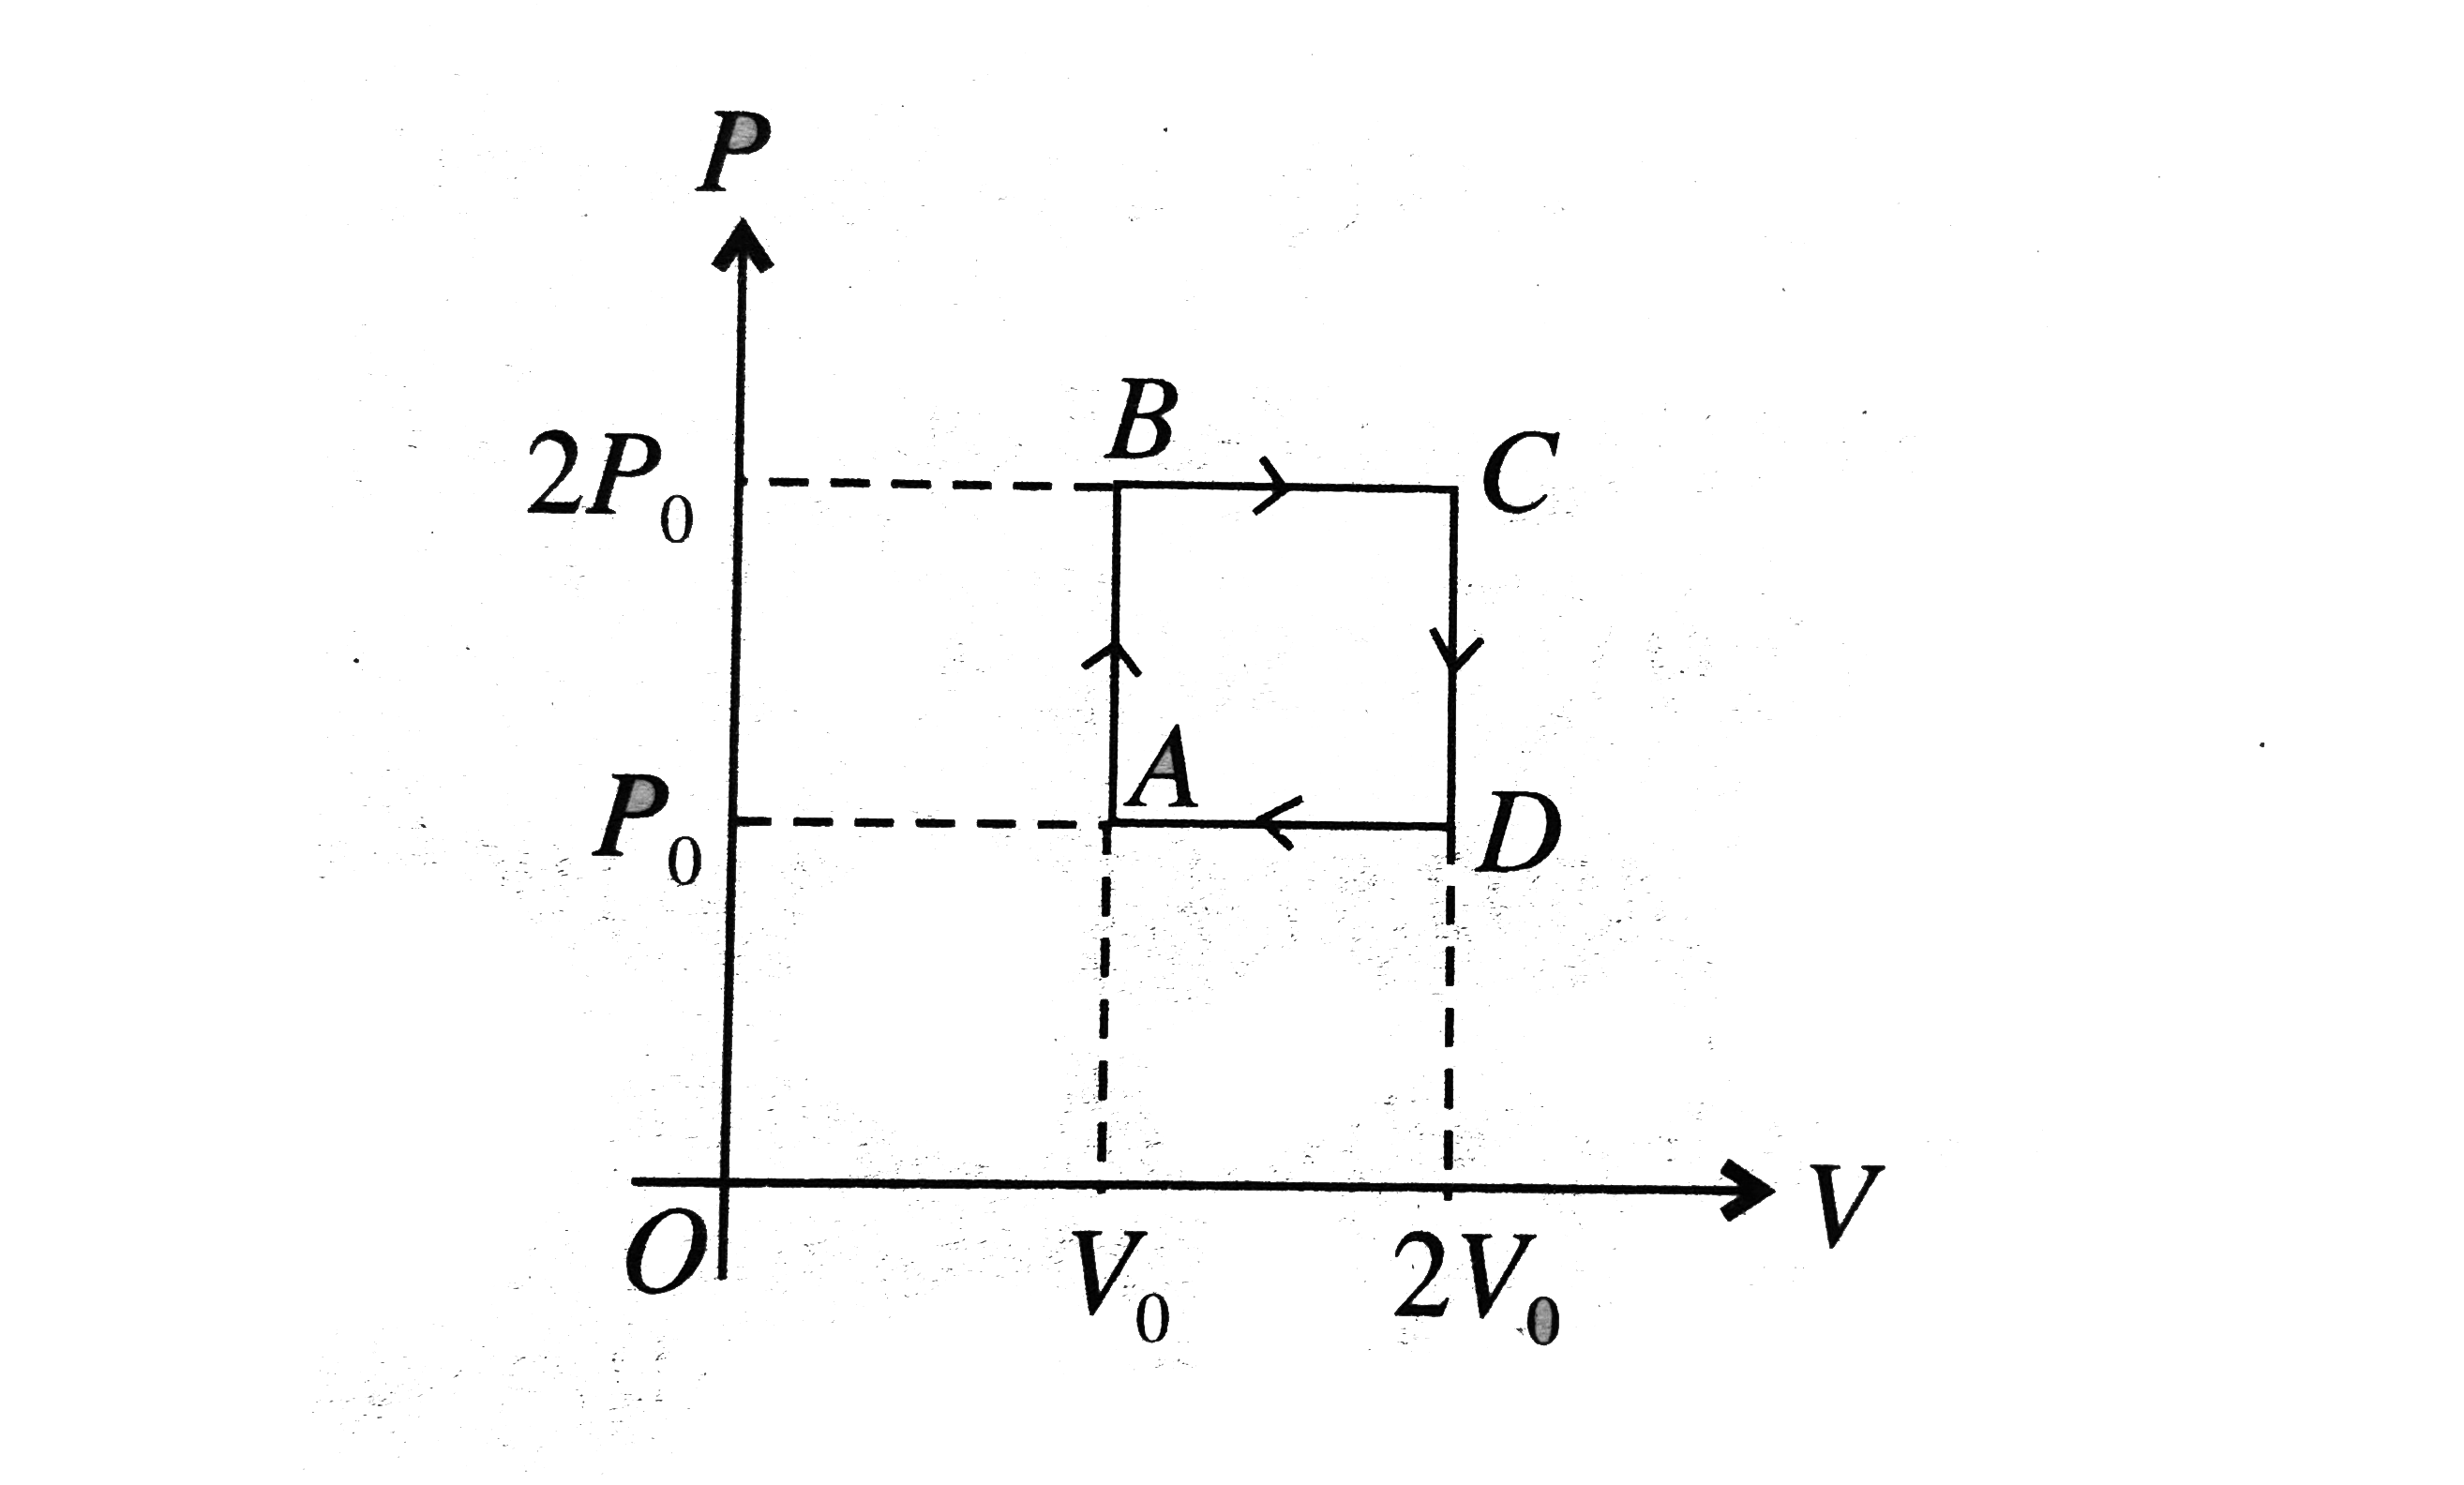
Step by step video & image solution for Find out the work done in the given graph. Also draw the corresponding T -V curve and P-T curve. by Chemistry experts to help you in doubts & scoring excellent marks in Class 12 exams.
Updated on:21/07/2023Topper's Solved these Questions
- CLASSROOM PROBLEMS 1BOOK - MOTIONCHAPTER - CLASSROOM PROBLEMS 1EXERCISE - THERMODYNAMICS
17 Videos
- CLASSROOM PROBLEMS BOOK - MOTIONCHAPTER - CLASSROOM PROBLEMS EXERCISE - Electrochemistry
22 Videos
- COORDINATION COMPOUNDBOOK - MOTIONCHAPTER - COORDINATION COMPOUNDEXERCISE - EXERCISE-4 LEVEL-II PREVIOUS YEAR JEE ADVANCED
37 Videos
Similar Questions
Knowledge Check
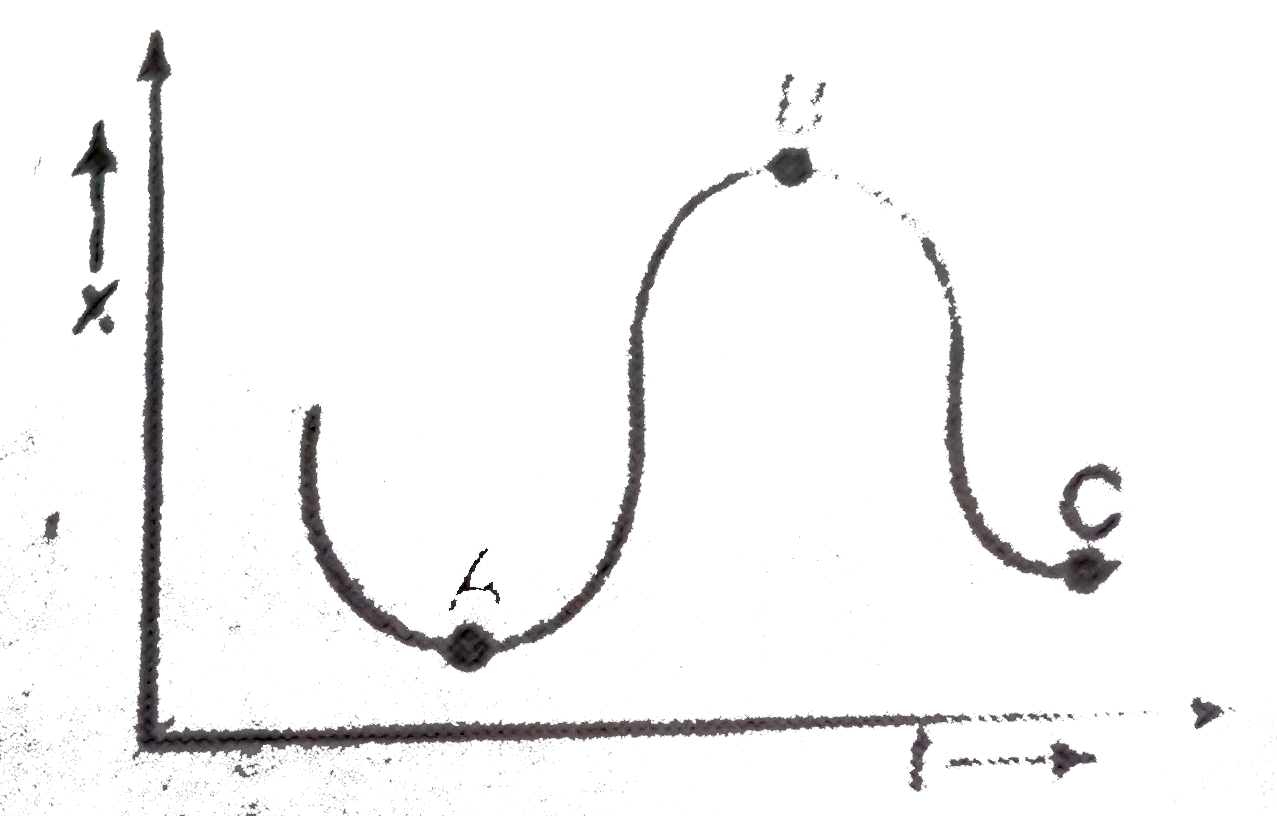
The x-t equation is given as x=2t+1. The corresponding v-t graph is
Aa straight line passing through originBa straight line not passing through originCa parabolaDNone of the aboveThe total work done in the following PV curve is
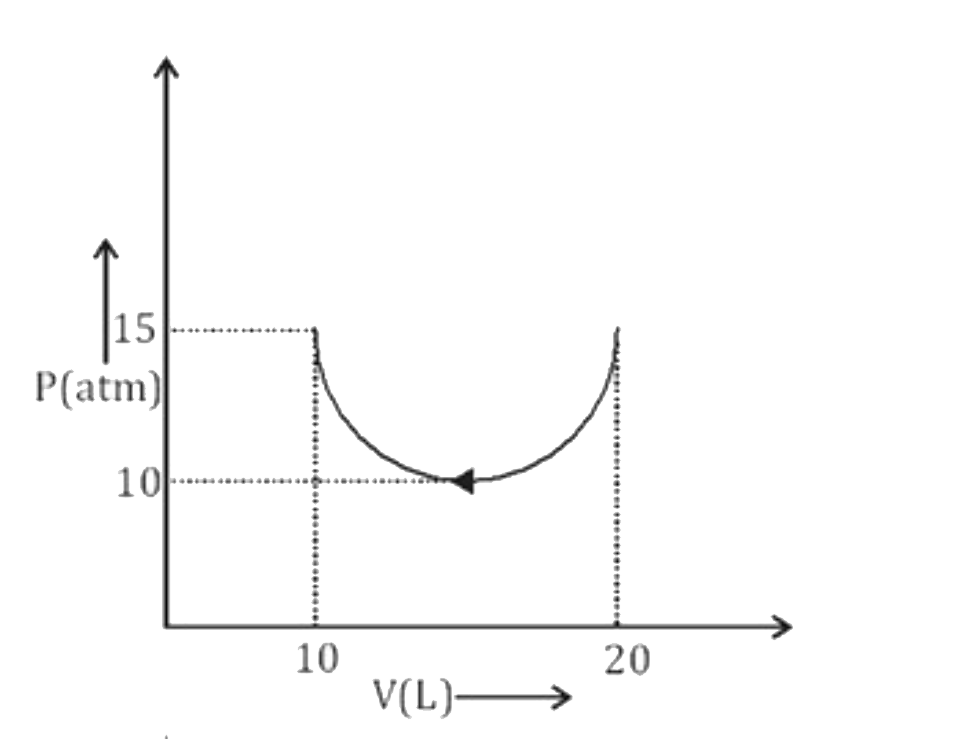 A(150−25π2)L - atmB(150+25π2)L - atmC(−25π2)L - atmD150 L - atm
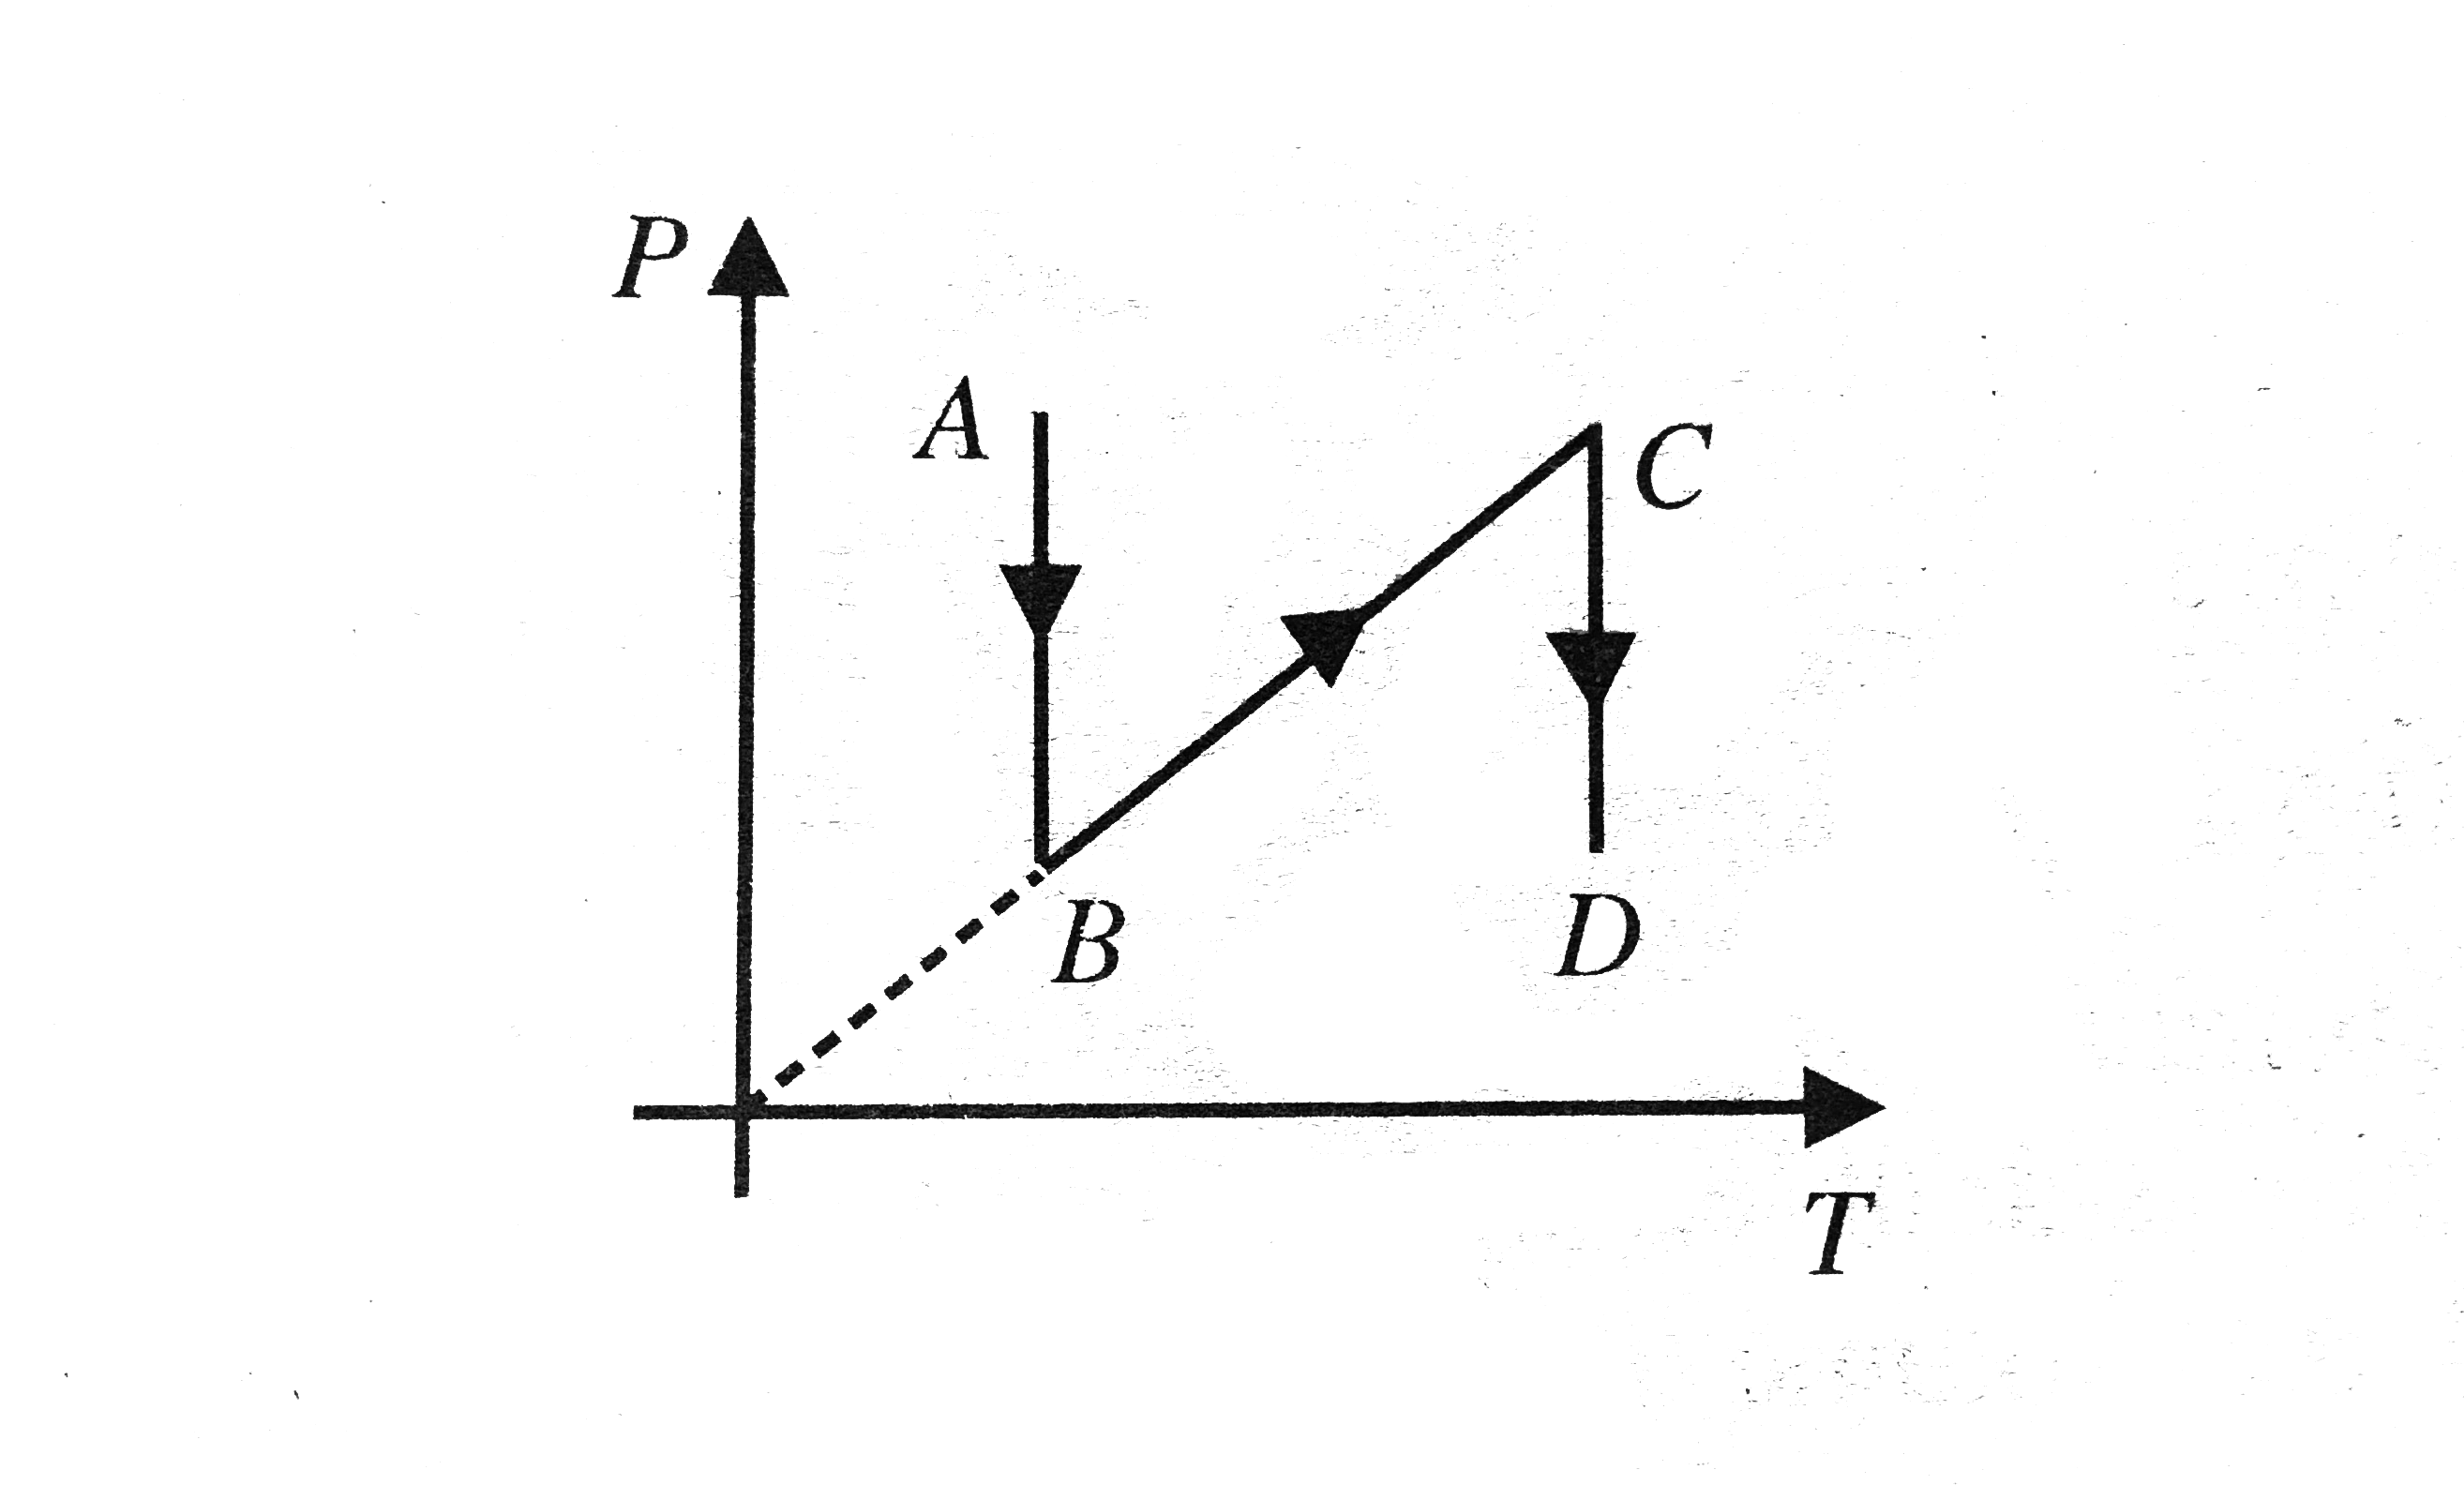
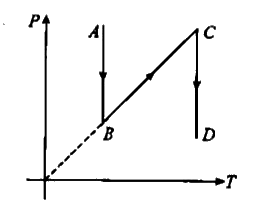
P−T diagram is shown in Fig. Choose the corresponding V−T diagram.
 A
A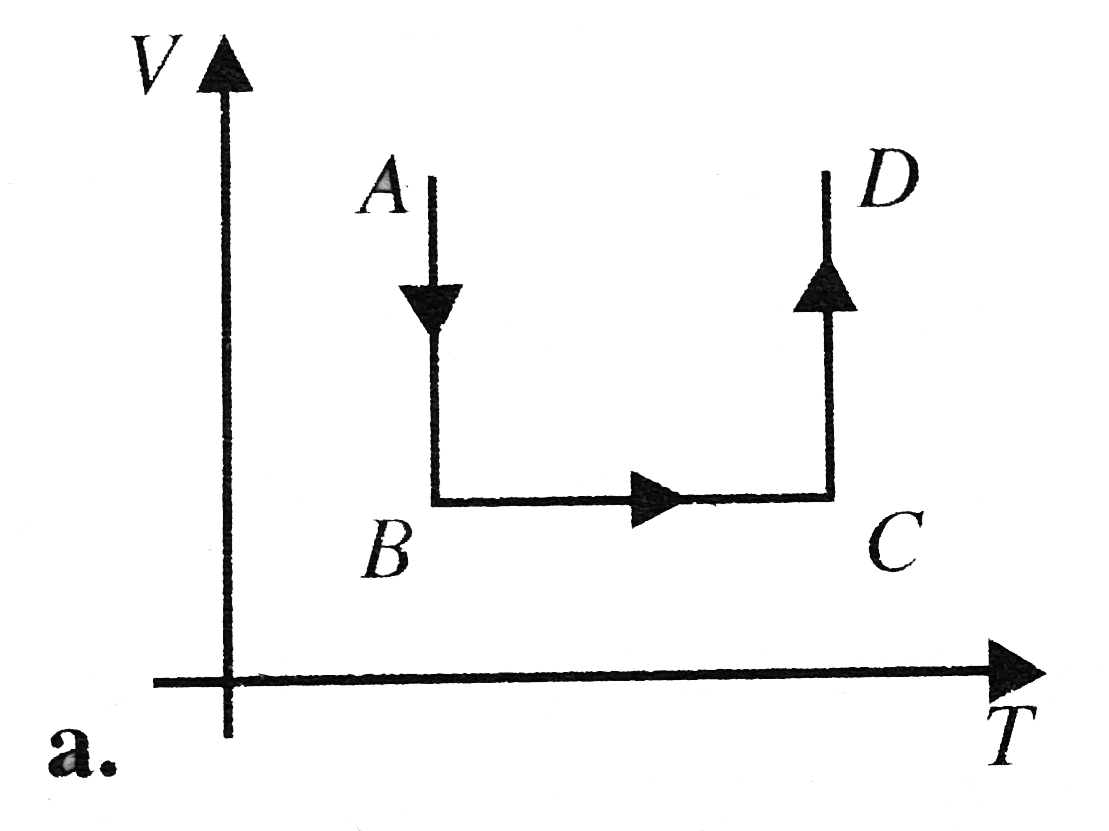 B
B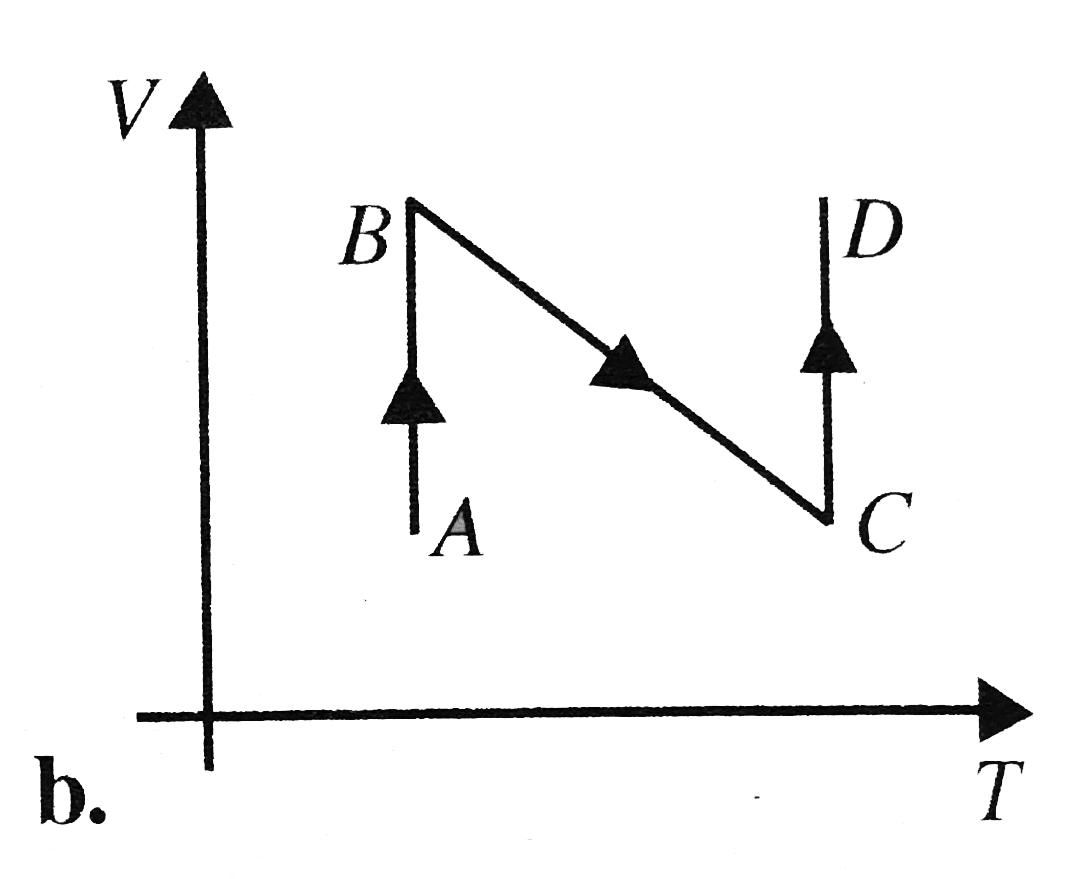 C
C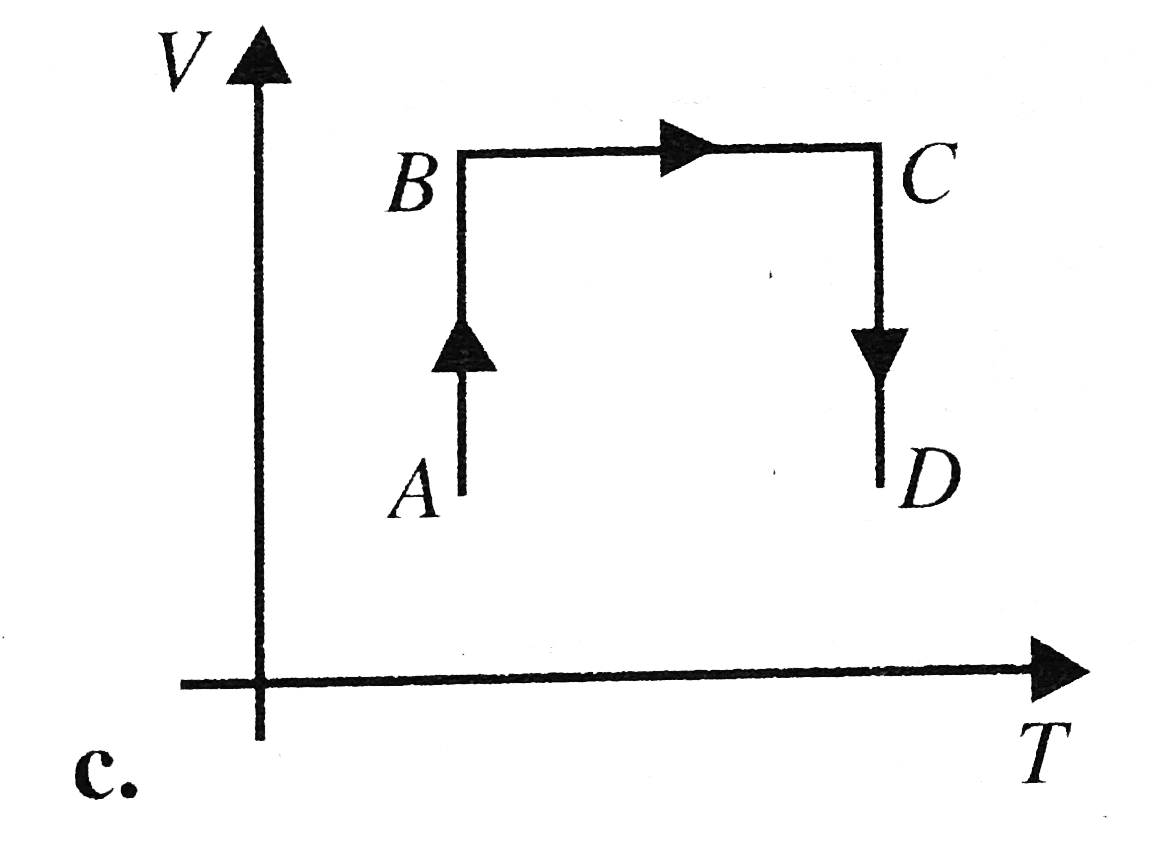 D
D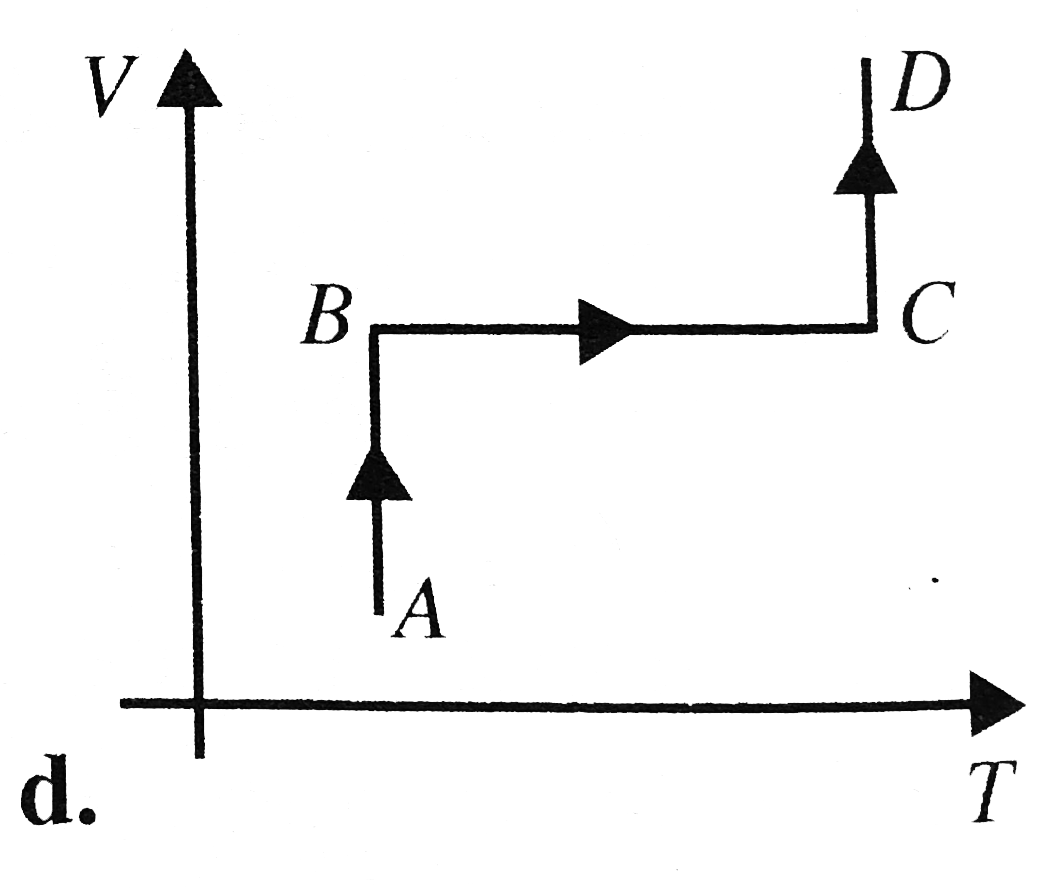
P-T diagram is shown below then choose the corresponding V-T diagram
View Solution2.The velocity-time (v-t) graph for a particle in straight line motion is given below the corresponding acceleration time graph will be?
View SolutionFind the area of the region bounded by the curve x=at2 and y=2at between the ordinates corresponding to t = 1 and t = 2.
View Solution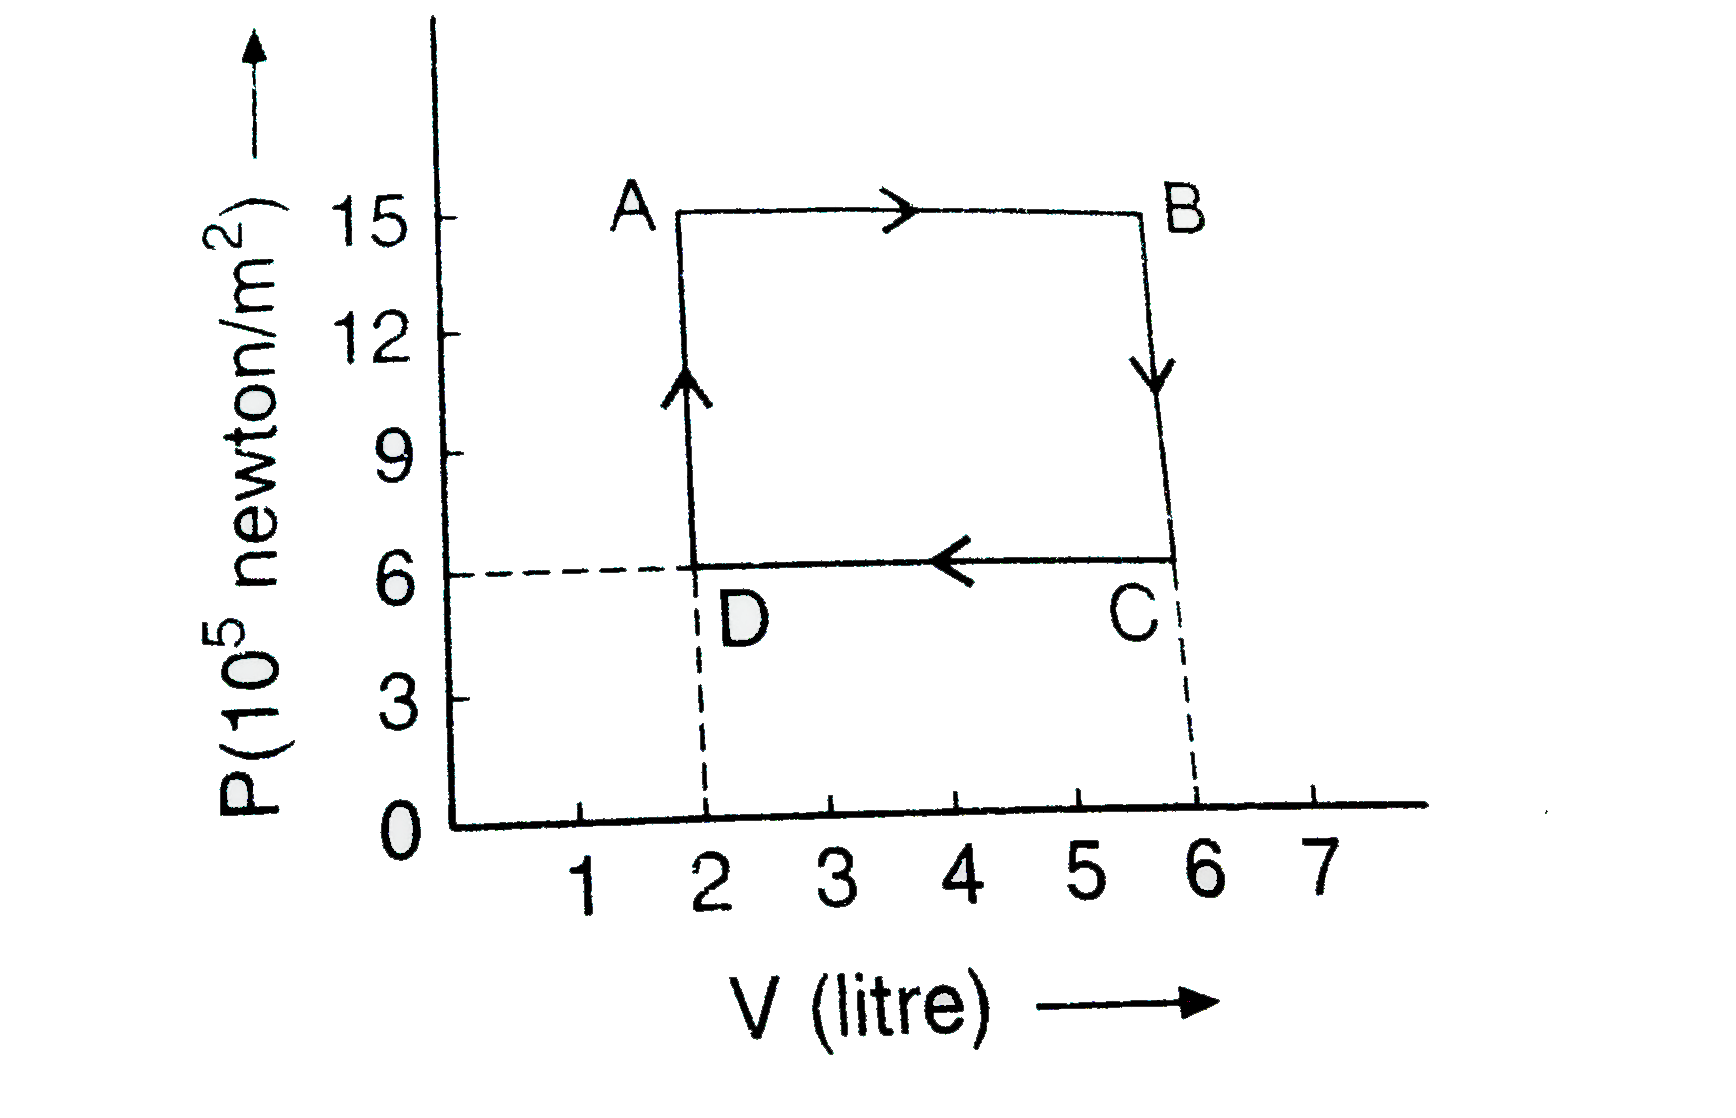
In the adjoining diagram, the p-V graph of an ideal gas is shown. Find out from the graph (i) work done in taking the gas
From the state A→B (ii) Work done in taking the gas from B→C (iii) Work done in a complete cycle. (1 litre=10−3m3)
View SolutionWhen a sample of ideal gas is changed from an initial state to a final state, various curves can be plotted for the process like P-V curve, V-T curve,P-T curve etc.
For example, P-V curve for a fixed amount of an ideal gas at constant temperature is a rectangular hyperbola, V-T curve for a fixed amount of an ideal gas at constant volume is again a straight line. However, the shapes may vary if the constant parameters are also changed.
Now, answer the following questions :
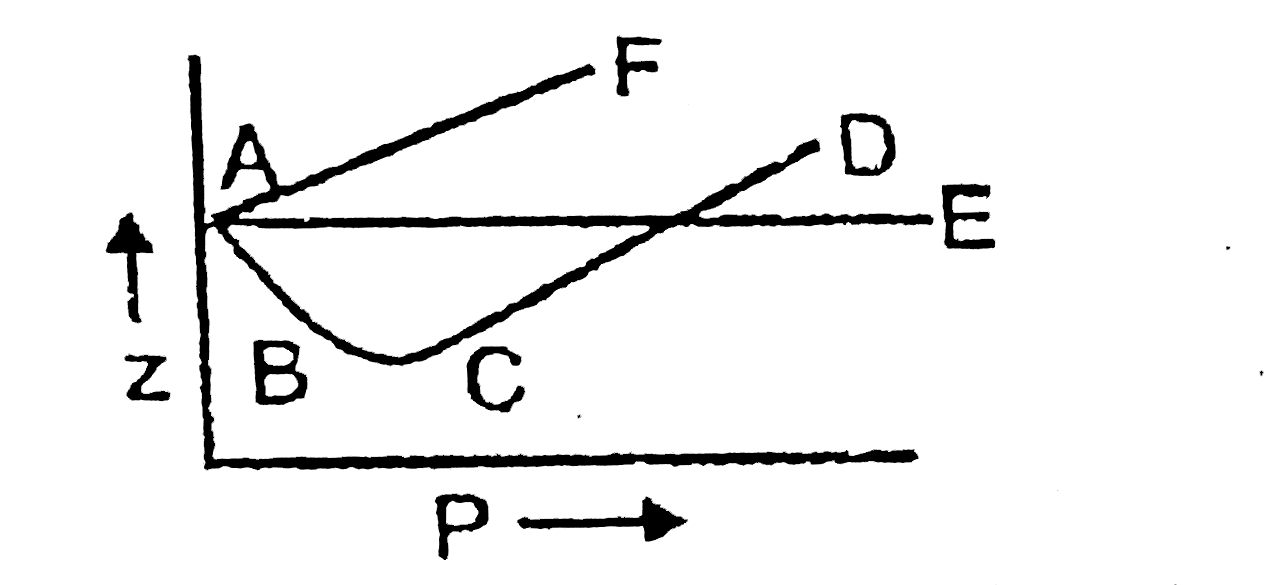
The figure shows the effect of pressure on the compressibility factor, Z of a gas :
View Solution

