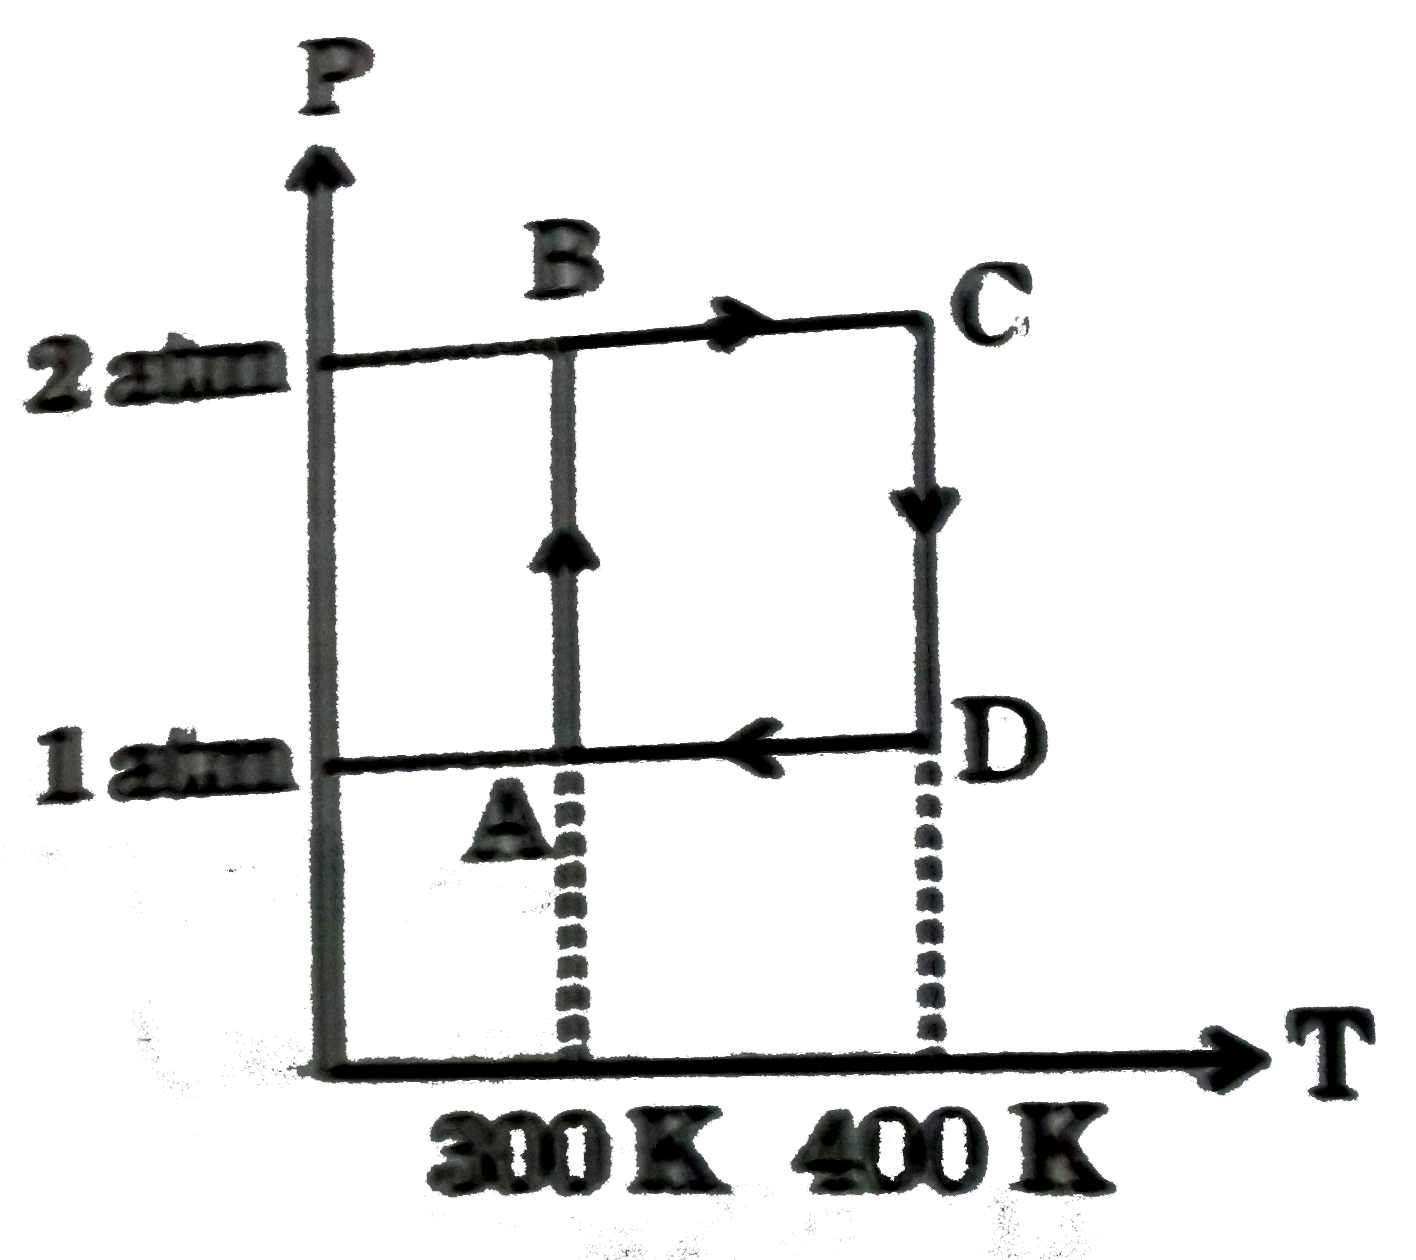
T-V curve of cyclic process is shown below, number of moles of the gas are n find the total work done during the cycle.
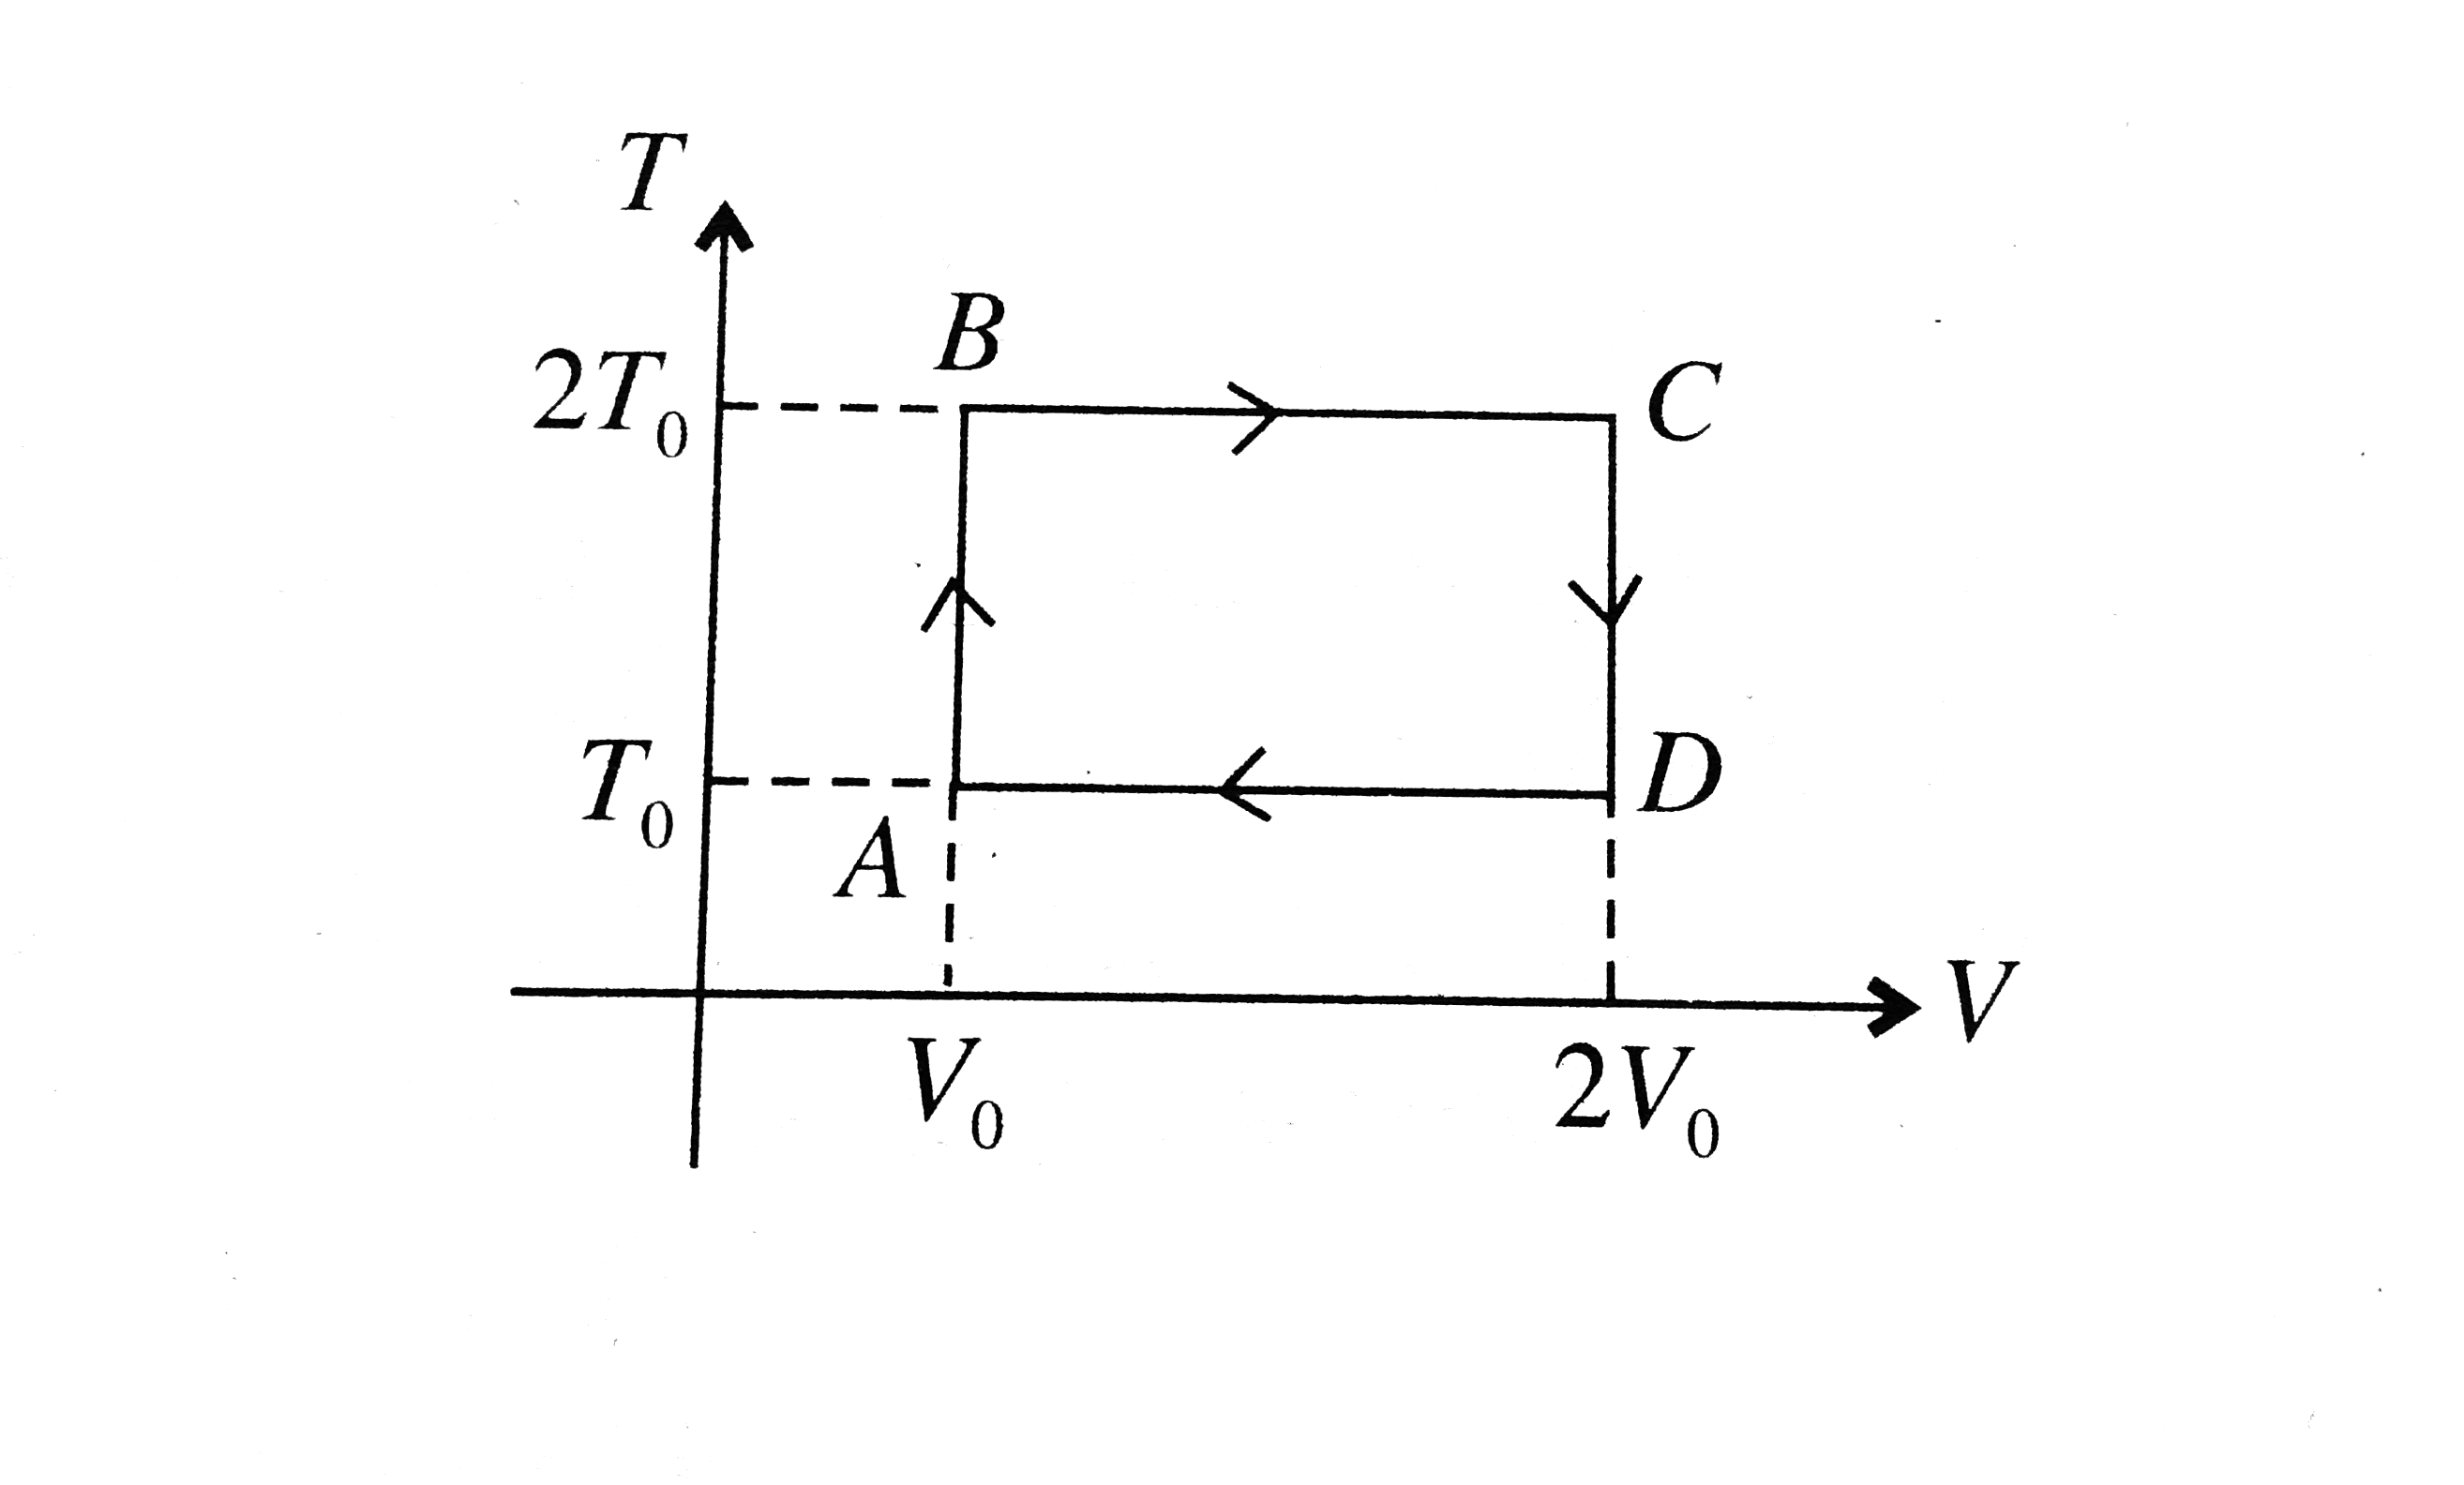
Step by step video & image solution for T-V curve of cyclic process is shown below, number of moles of the gas are n find the total work done during the cycle. by Chemistry experts to help you in doubts & scoring excellent marks in Class 12 exams.
Updated on:21/07/2023Topper's Solved these Questions
- CLASSROOM PROBLEMS 1BOOK - MOTIONCHAPTER - CLASSROOM PROBLEMS 1EXERCISE - THERMODYNAMICS
17 Videos
- CLASSROOM PROBLEMS BOOK - MOTIONCHAPTER - CLASSROOM PROBLEMS EXERCISE - Electrochemistry
22 Videos
- COORDINATION COMPOUNDBOOK - MOTIONCHAPTER - COORDINATION COMPOUNDEXERCISE - EXERCISE-4 LEVEL-II PREVIOUS YEAR JEE ADVANCED
37 Videos
Similar Questions
Knowledge Check
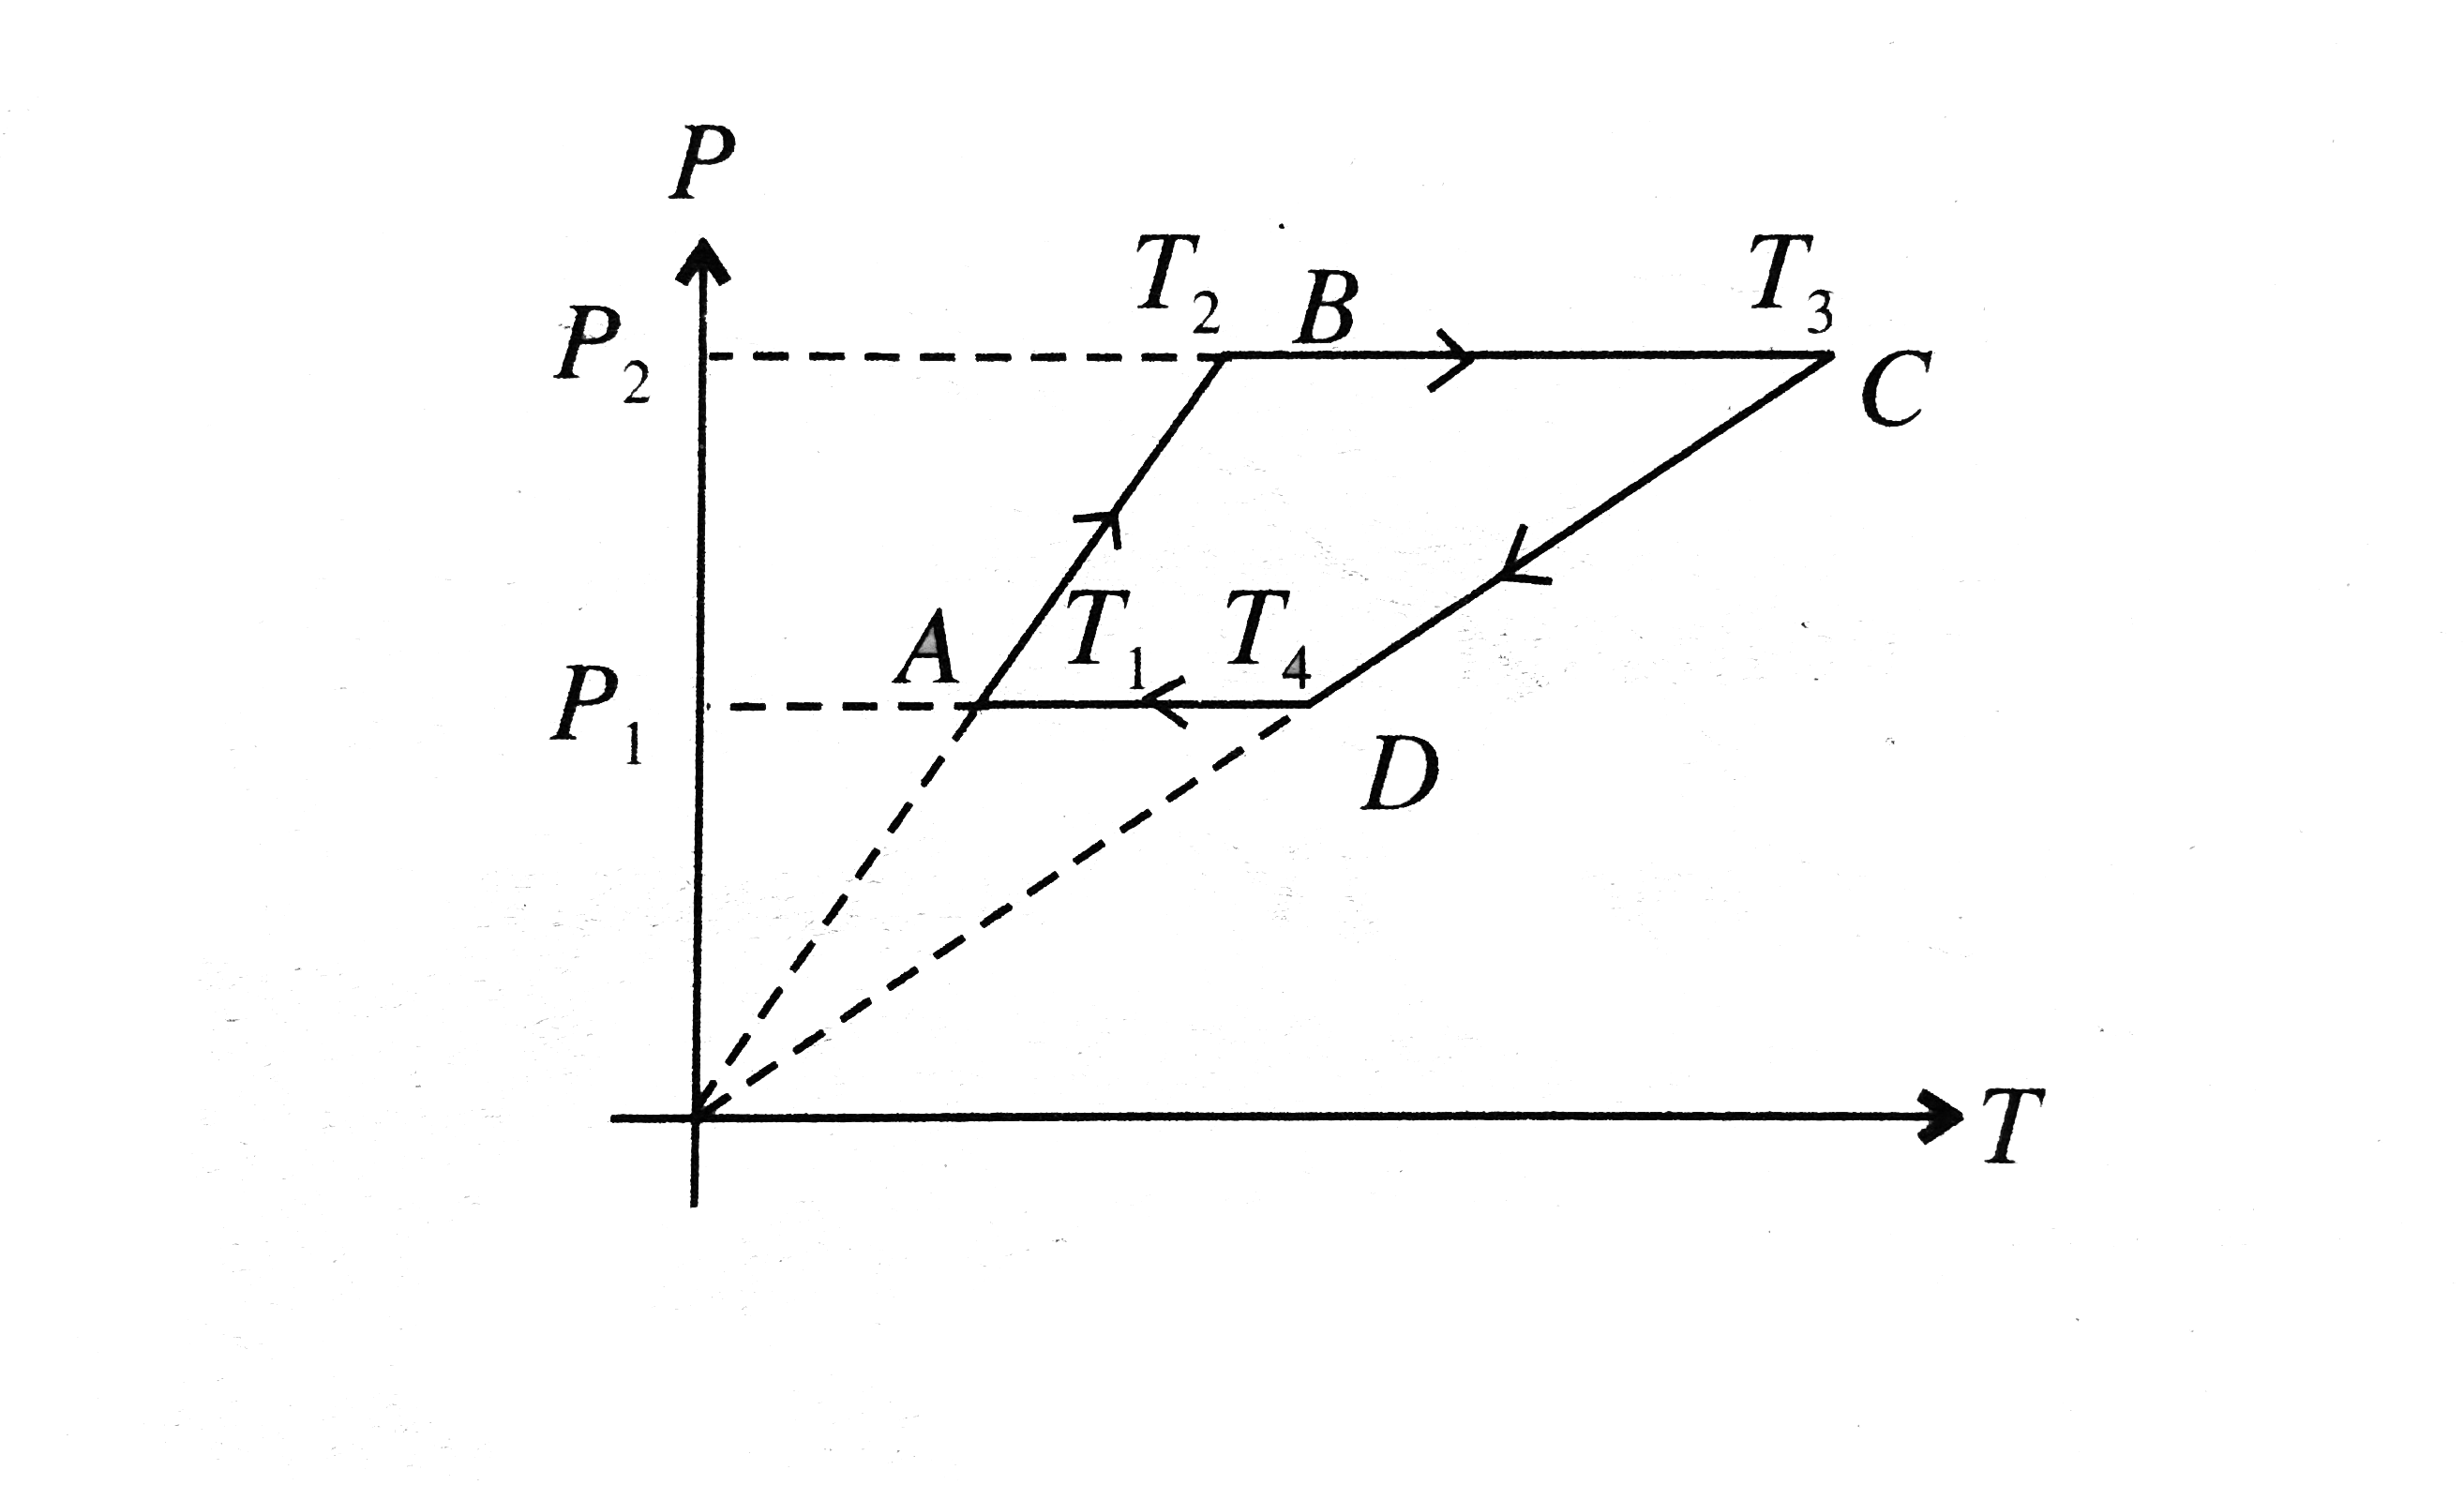
p−T curve for a cyclic process is as shown
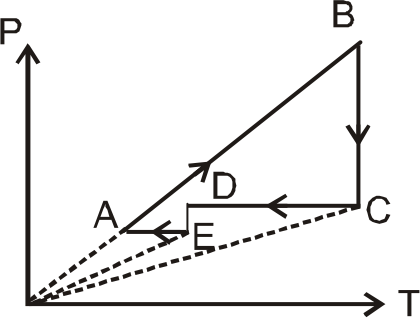
P−V graph for this process will be:A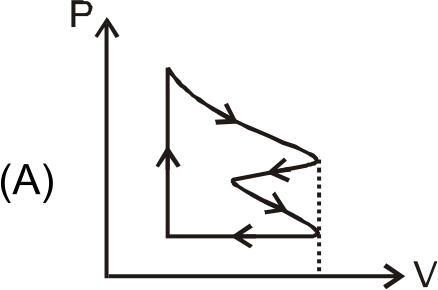 B
B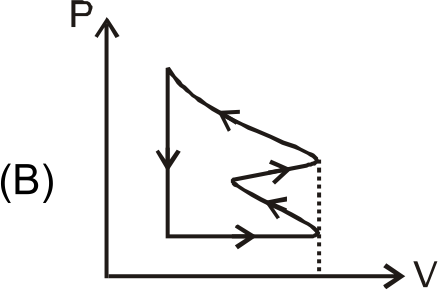 C
C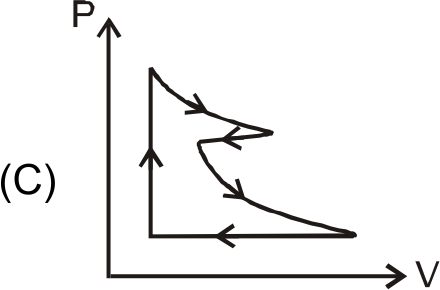 D
D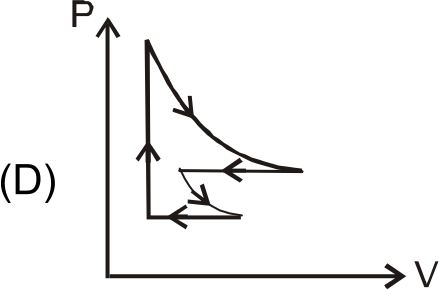
An ideal monoatomic gas undergoes a cyclic process ABCA as shown in the figure. The ratio of heat absorbed during AB to the work done on the gas during BC id
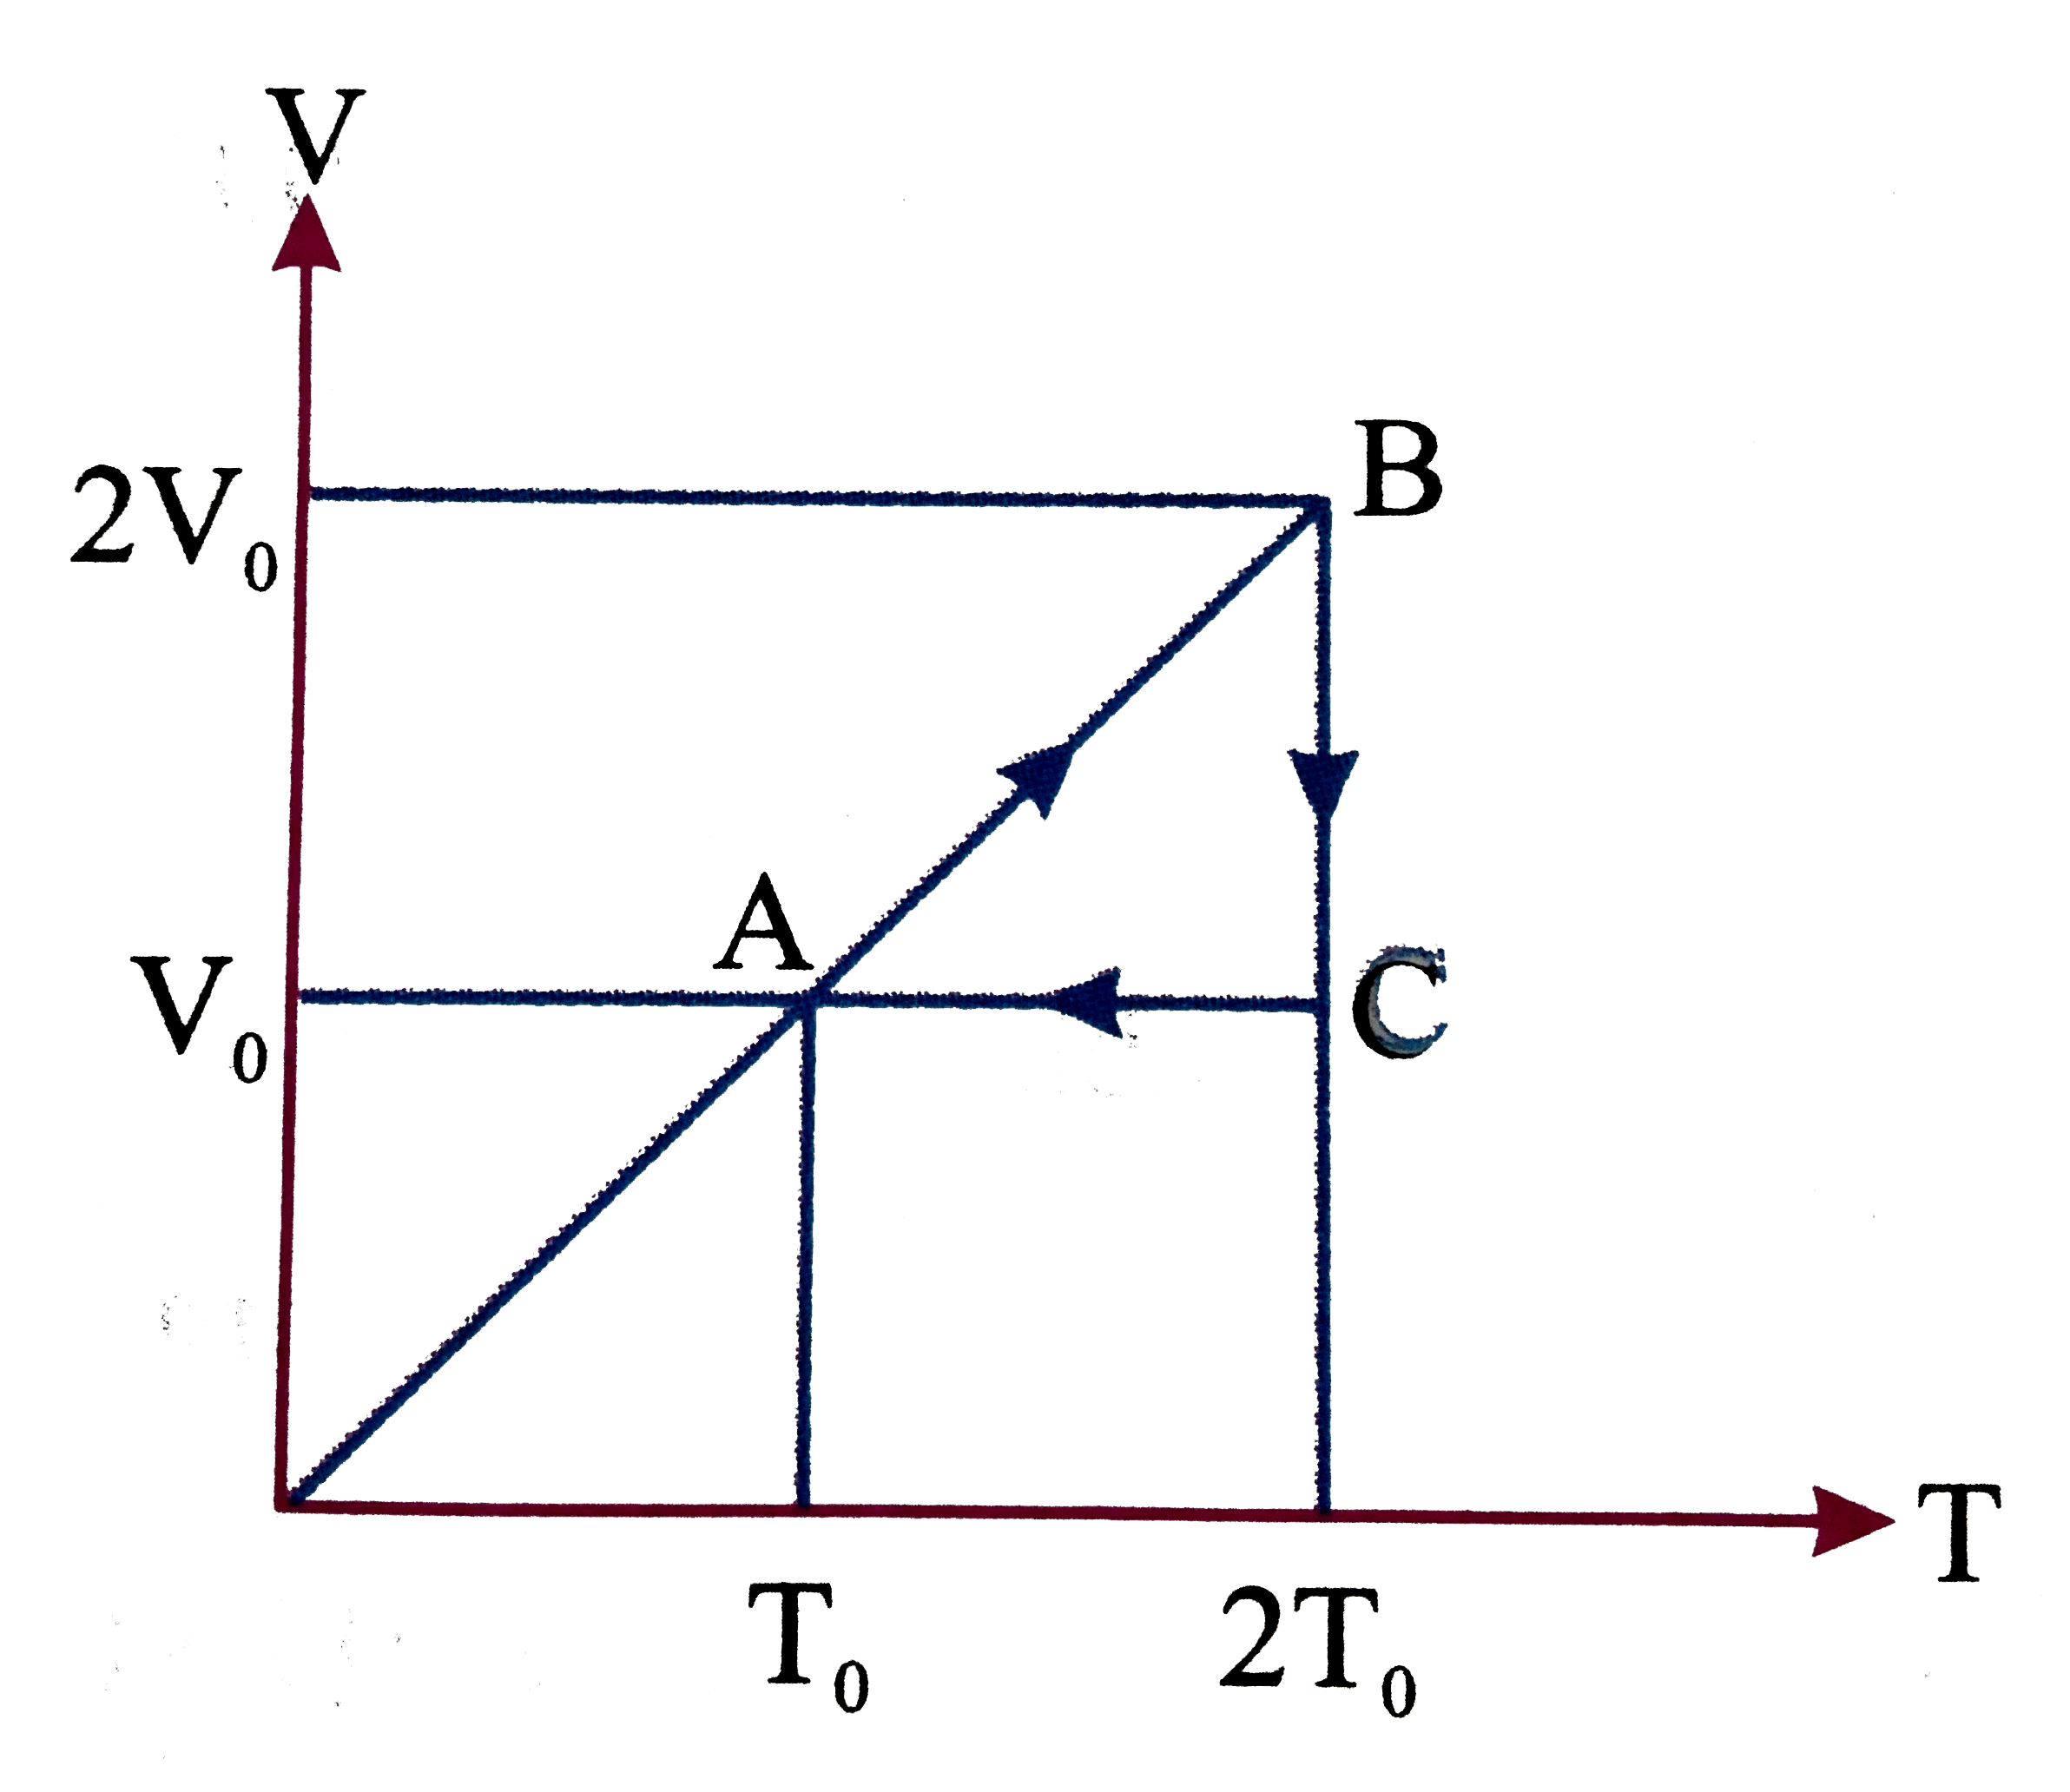 A52ln2B53C54ln2D56
One mole of ideal monatomic gas is carried through the reversible cyclic process as shown in figure. Calculate the max temperature attained by the gas during the cycle.
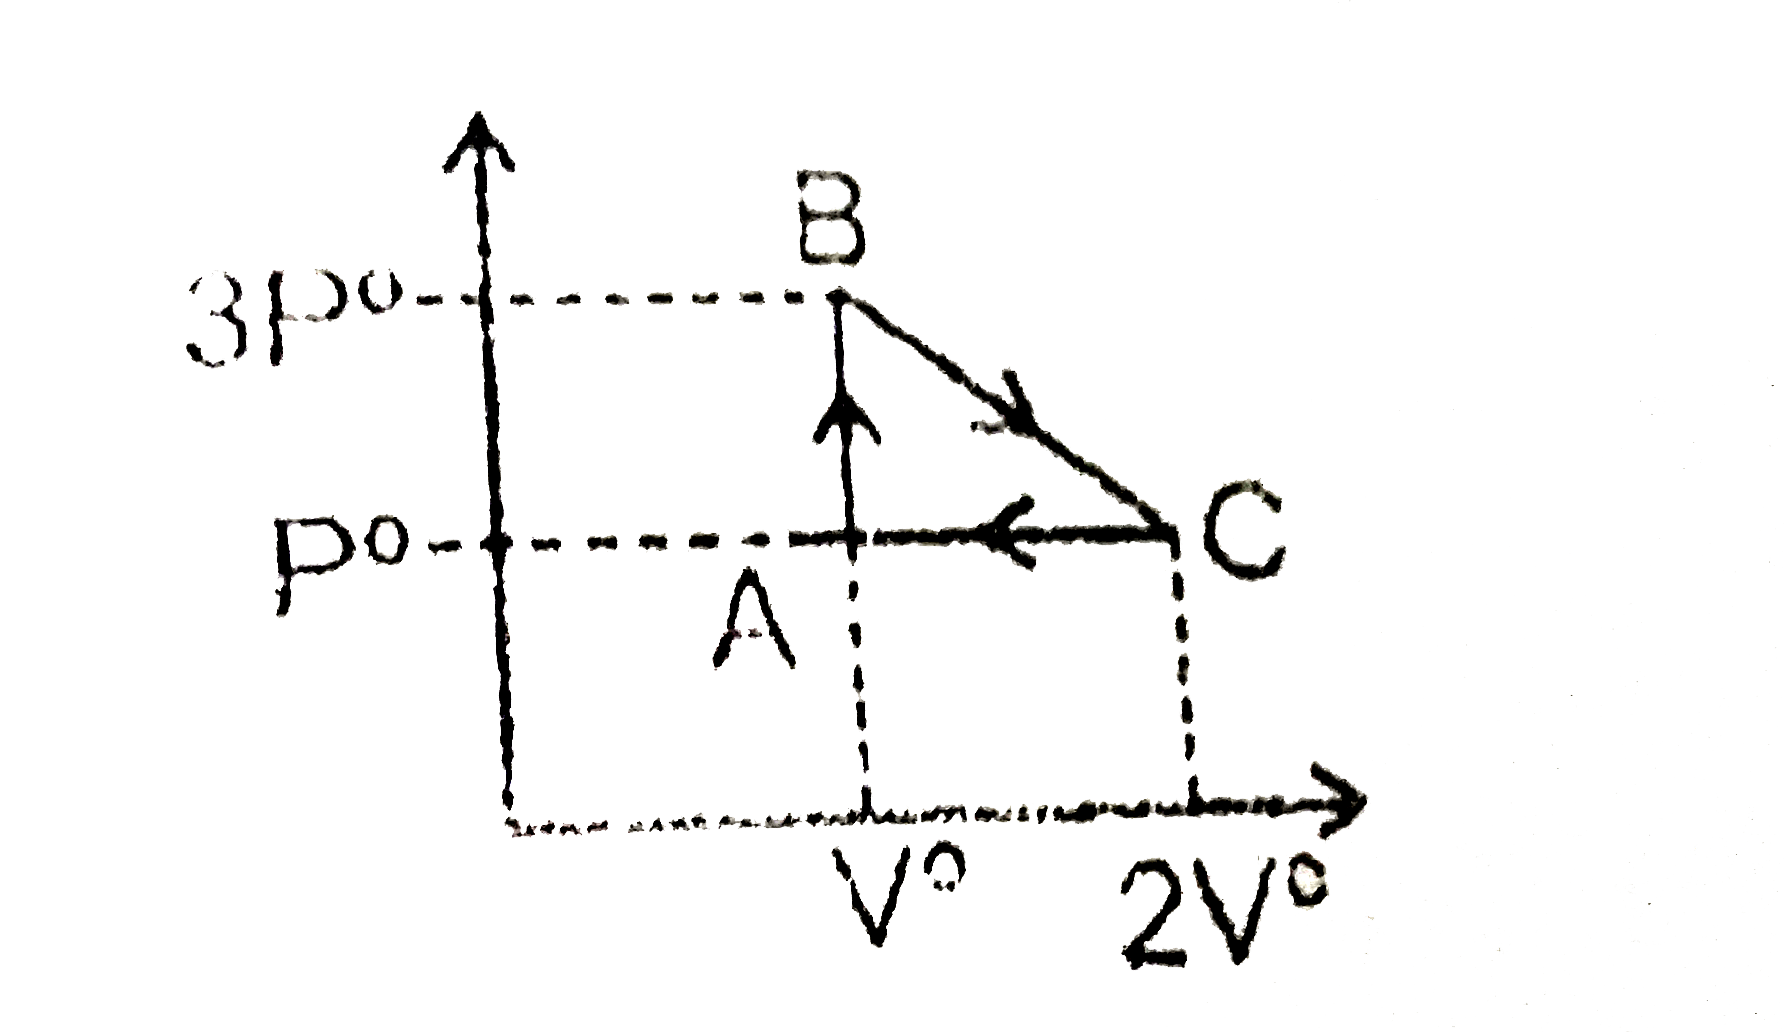 A258(P∘V∘R)B−258(P∘V∘R)C358(P∘V∘R)D−358(P∘V∘R)
P – V graph for a cyclic process is shown in figure . Work done is given by
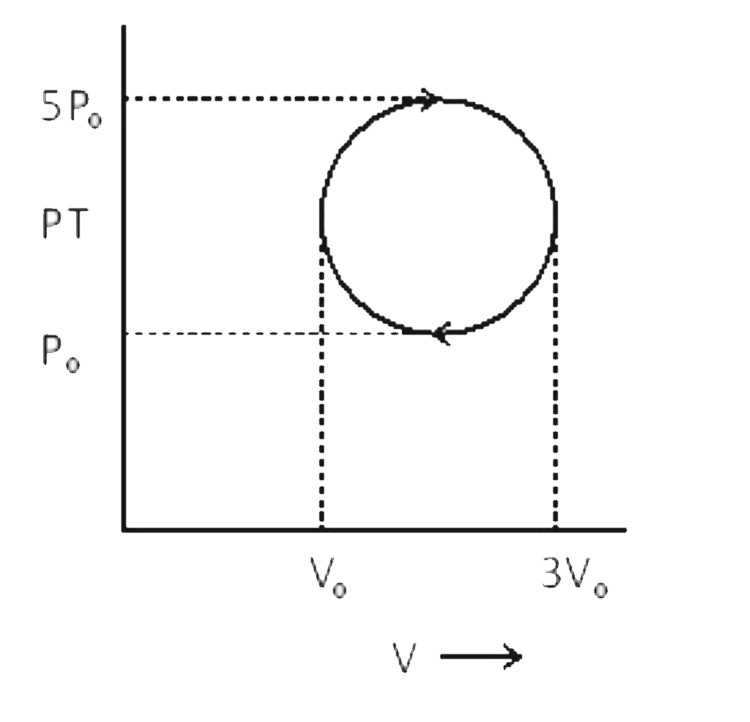
View SolutionIn the cyclic process shown in the figure, the work done by the gas in one cycle is
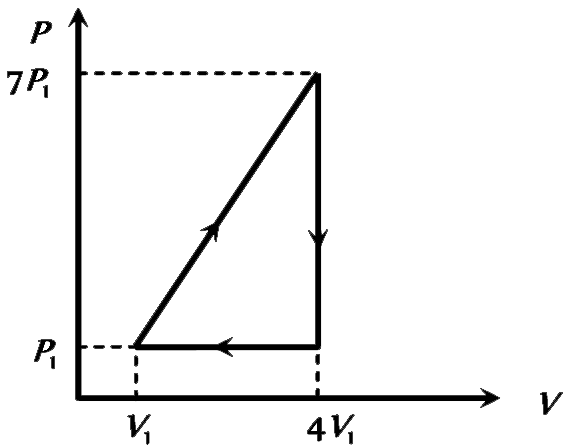
View SolutionTwo moles of helium gas undergo a cyclic process as shown in figure. Assuming the gas to be ideal. The net work done by the gas is
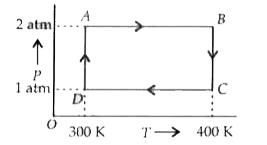
View SolutionTwo moles of Helium gas undergo a reversible cyclic process as shown in figure. Assuming gas to be ideal, what is the net work involved in the cyclic process ?
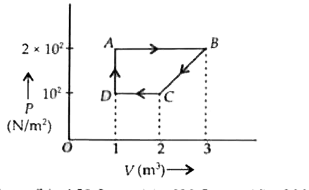
View SolutionA cyclic process is shown in the figure. Work done during the cyclic process ABCDA is
View Solution

