The graph of compressibility factor (Z) vs. P for one mole of a real gas is shown in following diagram. The graph is plotted at constant temperature 273K. If the slope of graph at very high pressure (dZdP) is (12.8)atm−1 , then calculate volume of one mole of real gas molecules (in L/mol)
Given : NA=6×10²³ and R=22.4273LatmK−1mol−1
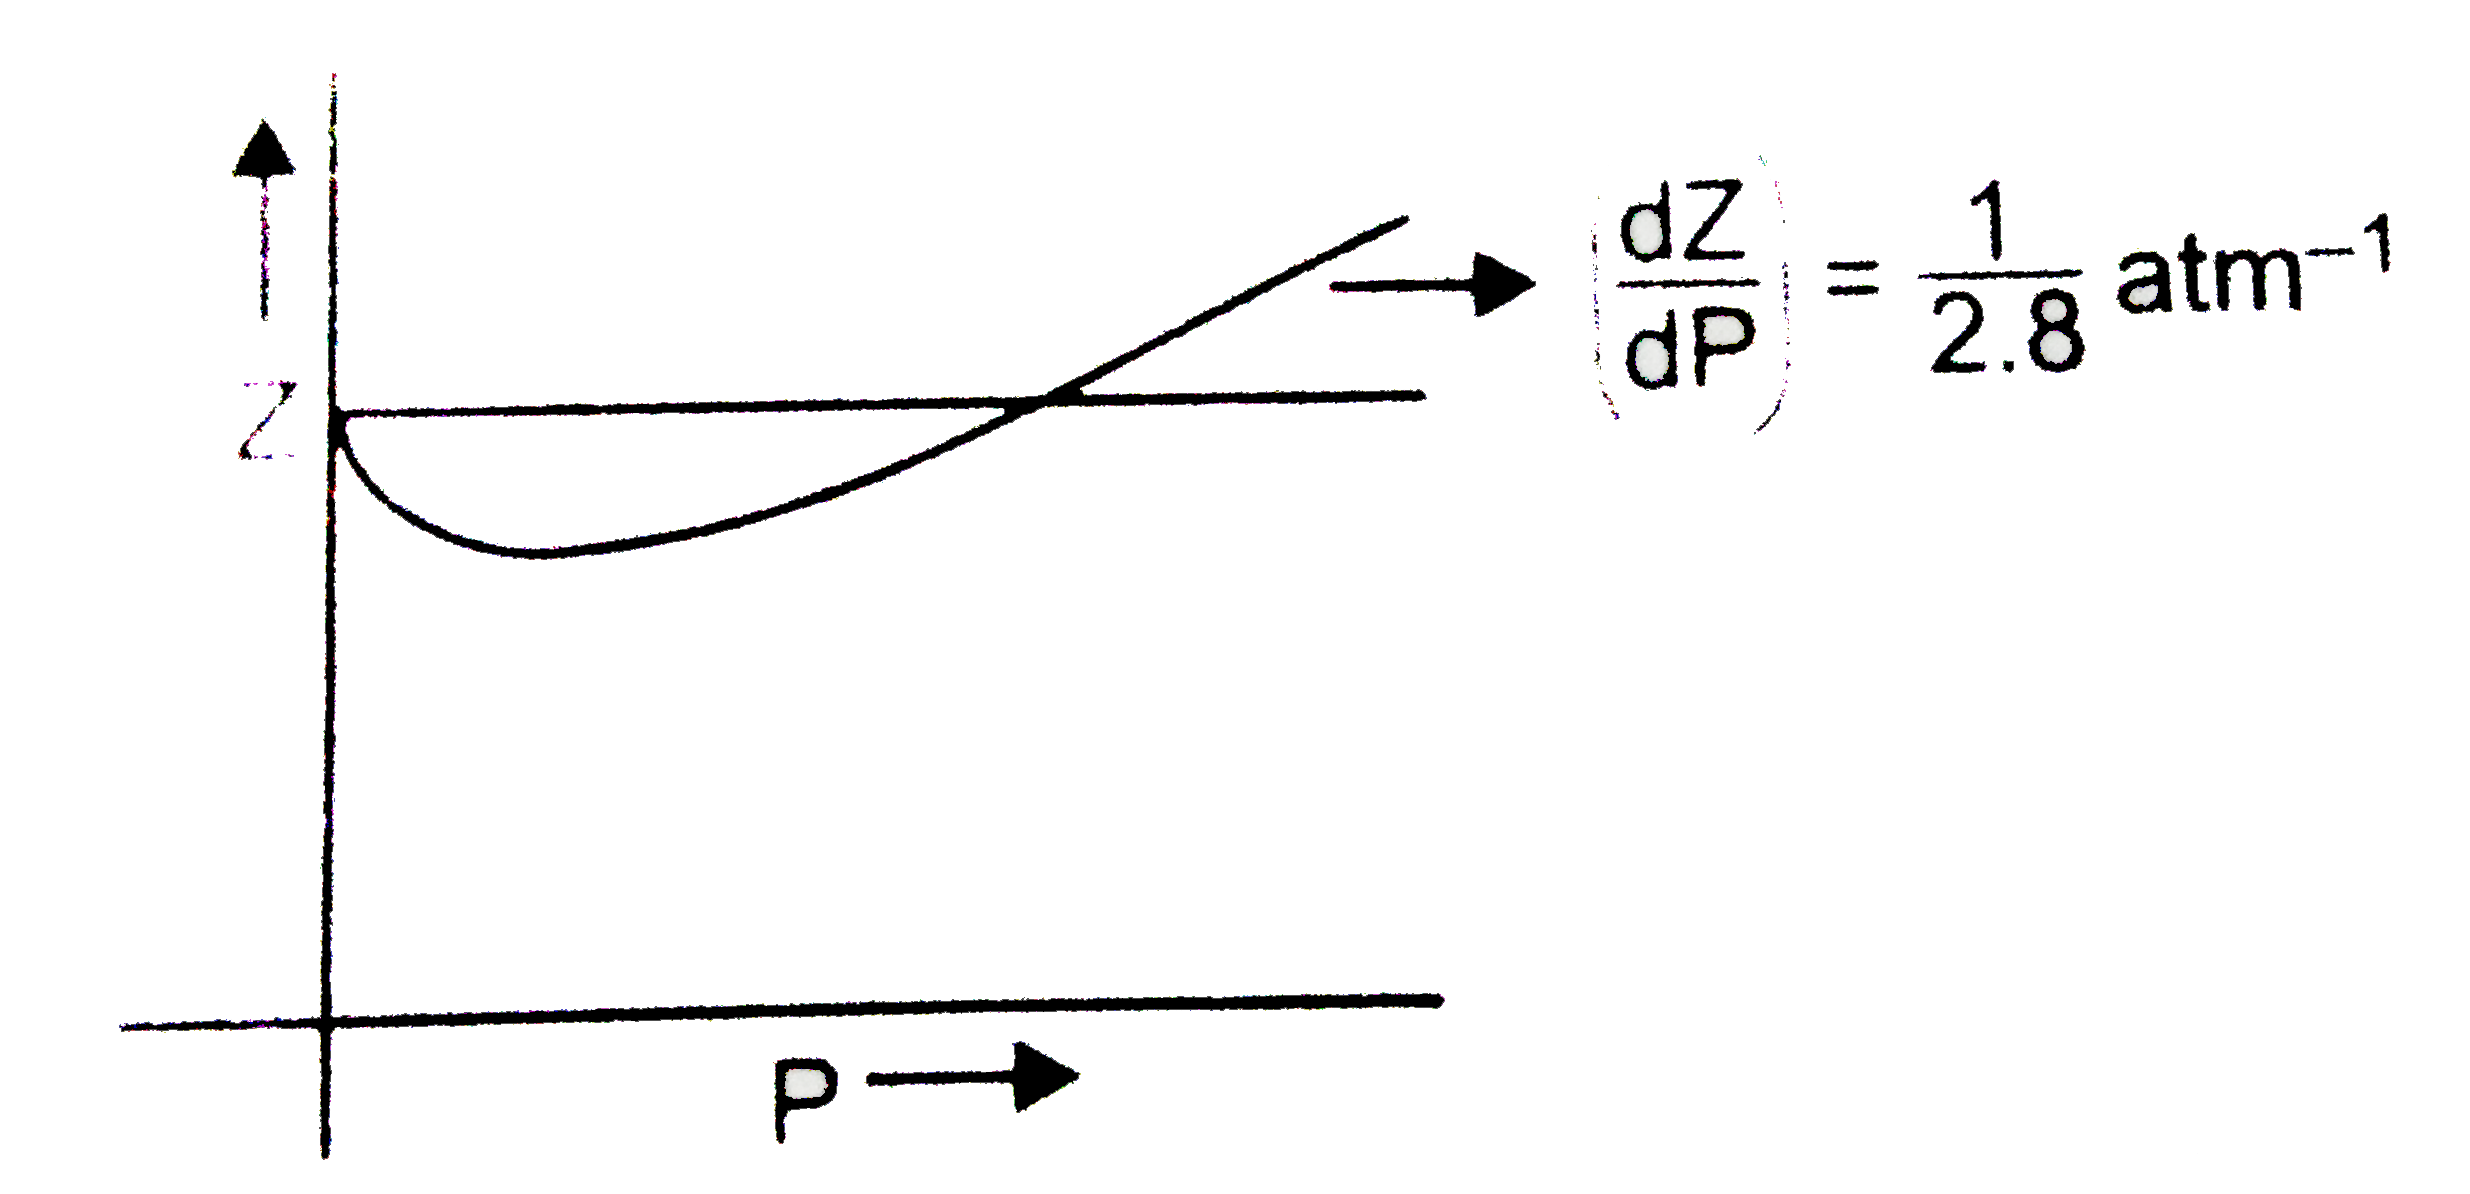
The correct Answer is:2
Z=1+PbRT high pressure
dZdP=bRT=12.8
b=RT2.8=22.42.8=4×(NA×43πR3)
(NA×43πR3)=Volume of 1 mole gas
=5.62.8=2
Topper's Solved these Questions
- BOOK - NARENDRA AWASTHICHAPTER - GASEOUS STATEEXERCISE - Level 1 (Q.31 To Q.60)1videos
GASEOUS STATE
- BOOK - NARENDRA AWASTHICHAPTER - GASEOUS STATEEXERCISE - Level 1 (Q.121 To Q.150)1videos
GASEOUS STATE
- BOOK - NARENDRA AWASTHICHAPTER - ELECTROCHEMISTRYEXERCISE - Level 3 - Subjective Problems1videos
ELECTROCHEMISTRY
- BOOK - NARENDRA AWASTHICHAPTER - IONIC EEQUILIBRIUMEXERCISE - Exercise196videos
IONIC EEQUILIBRIUM
Similar Questions
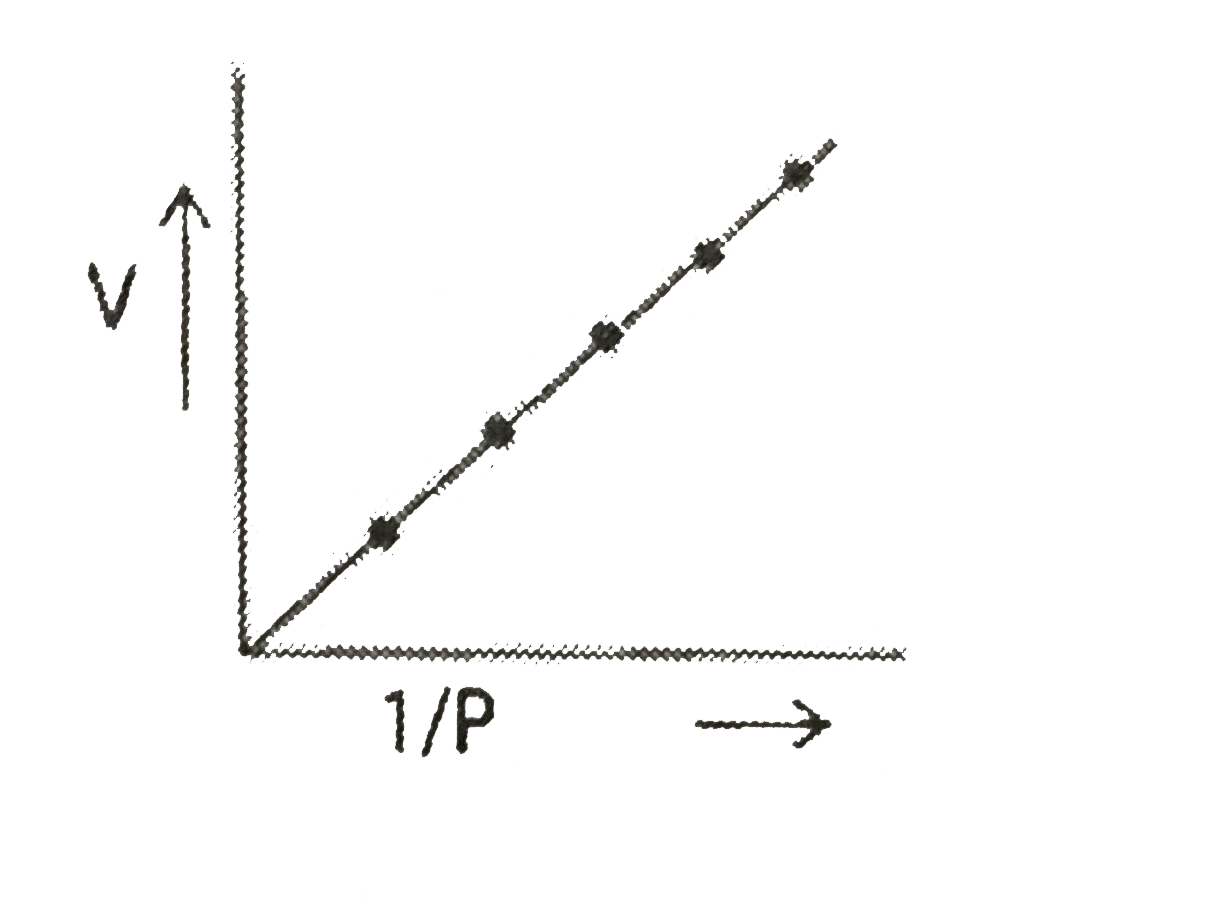
The slope of a given straight lime graph with constant temperature is found to be 0.2 L atm at 5 atm pressure. Calculate the volume of gas at that pressure.
 View Solution
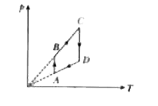
Pressure temperature (p-1) graph of n moles of an ideal gas is shown in the figure. Among the following four graphs, which are the corresponding pressure volume (p-V) and density pressure (p-p) graphs?
 View Solution
Knowledge Check
- Question 1 - Select One
If the slope of 'Z' (compressibility factor) vs. 'p' curve is constant (slope=π492.6atm−1) at a particular temperature (300 K) abd very high pressure, then calculate diameter of the molecules.
(Given : NA=6.0×10²³,R=0.0821atm.Lmol−1K−1)A7.5 ÅB5 ÅC2.5 ÅD1.25 Å - Question 2 - Select One
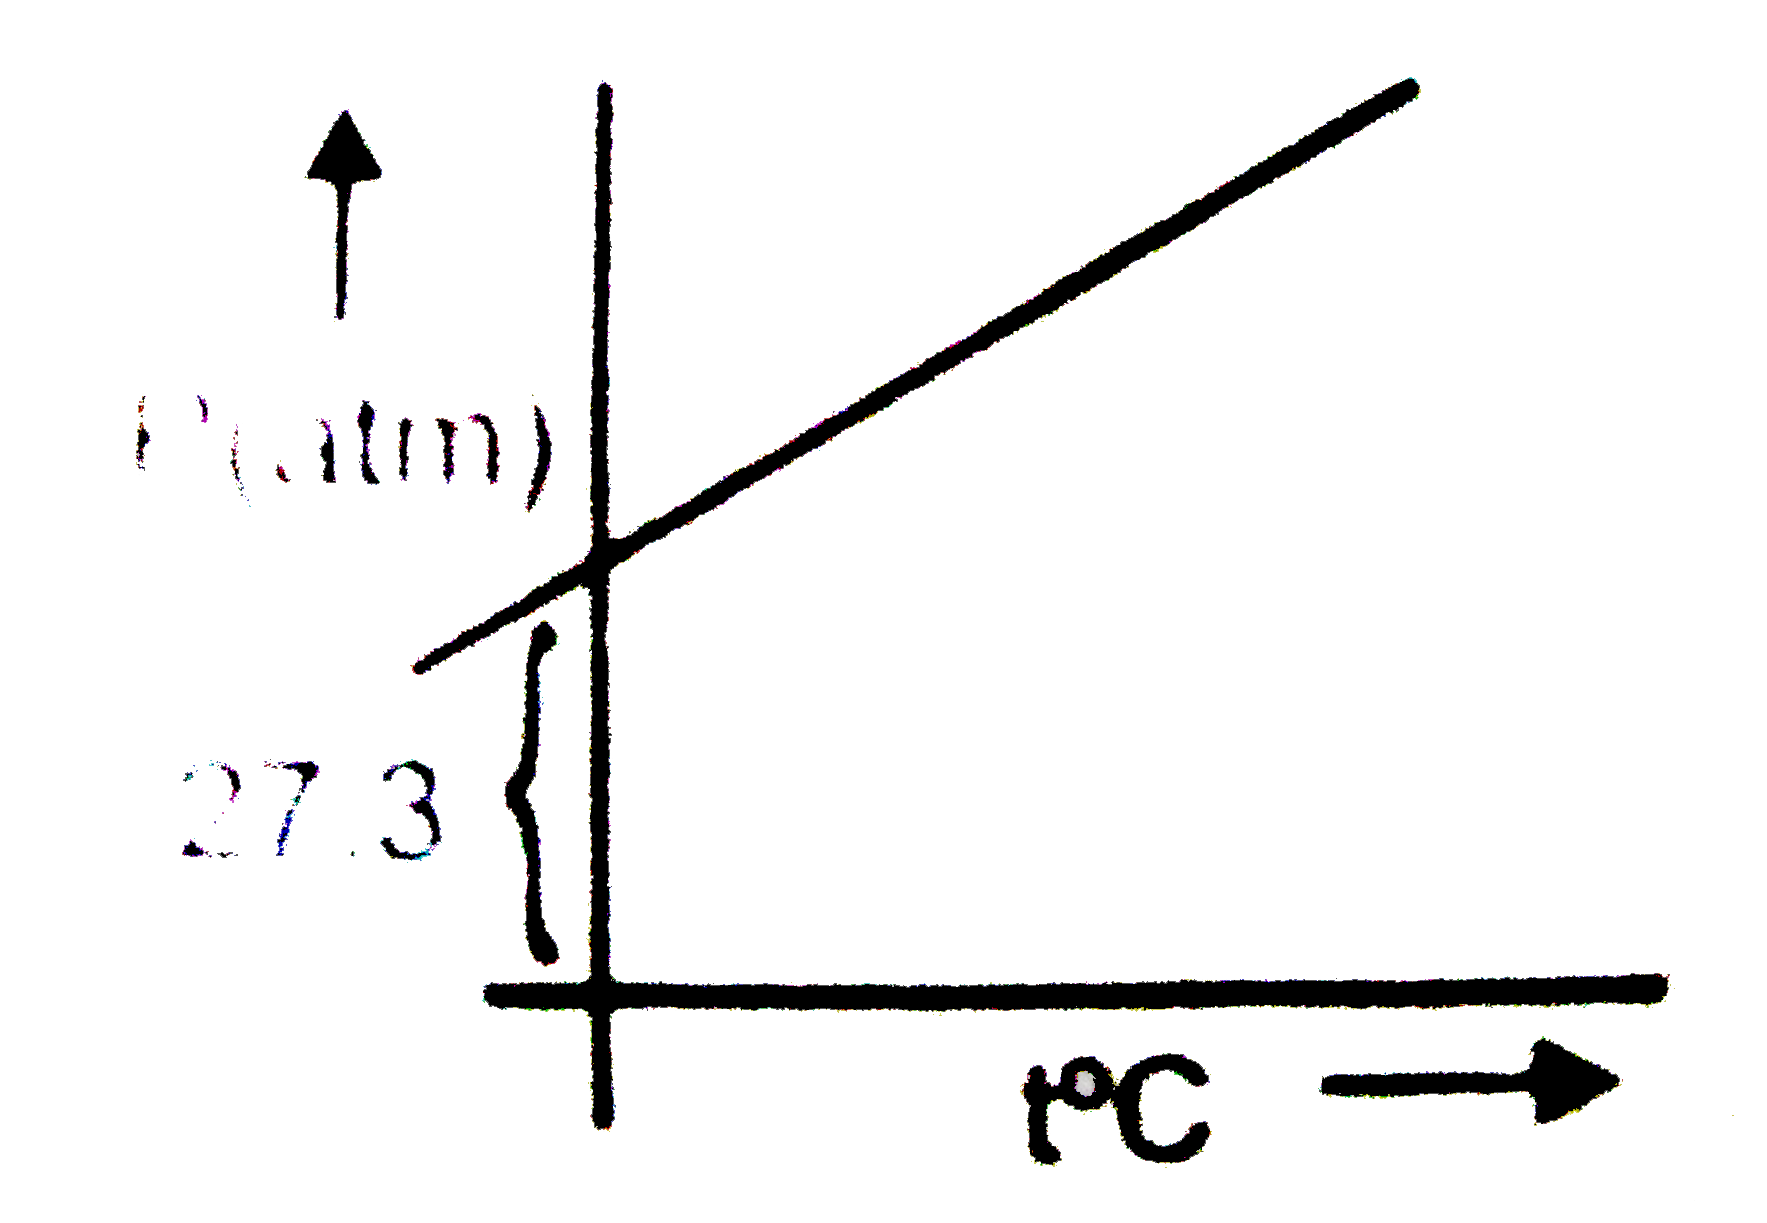
A graph is plotted between p (atm) vs t∘C for 10 mol of an ideal gas as follows:
Then slope of curve and volume of container (L) respectively, are:
 A0.1,8.21B8.21,0.1C27.3,8.21D8.21,27.3
 - Question 3 - Select One
At low pressure, the graph of PVvs1V for a given amount at a constant temperature for a real gas is:
Astraight line parallel to x-axisBstraight line having positive intercept and negative slopeCstraight line passing through origin having positive slopeDnone of the above
Two moles of a real gas confined in a 5 L flask exerts a pressure 9.1 atm at a temperature of 27∘C. Calculate the value of 'a' given the value of b is 0.052 L mol−1.
View SolutionOne mole of an ideal gas is heated from 273K to 546K at constant pressure of 1 atmosphere. Calculate the work done by the gas in the process.
View SolutionCalculate the value of proportionality constant k for 1 mole of a gas which occupies 22.4L of volume under the given conditions of temperature and pressure.
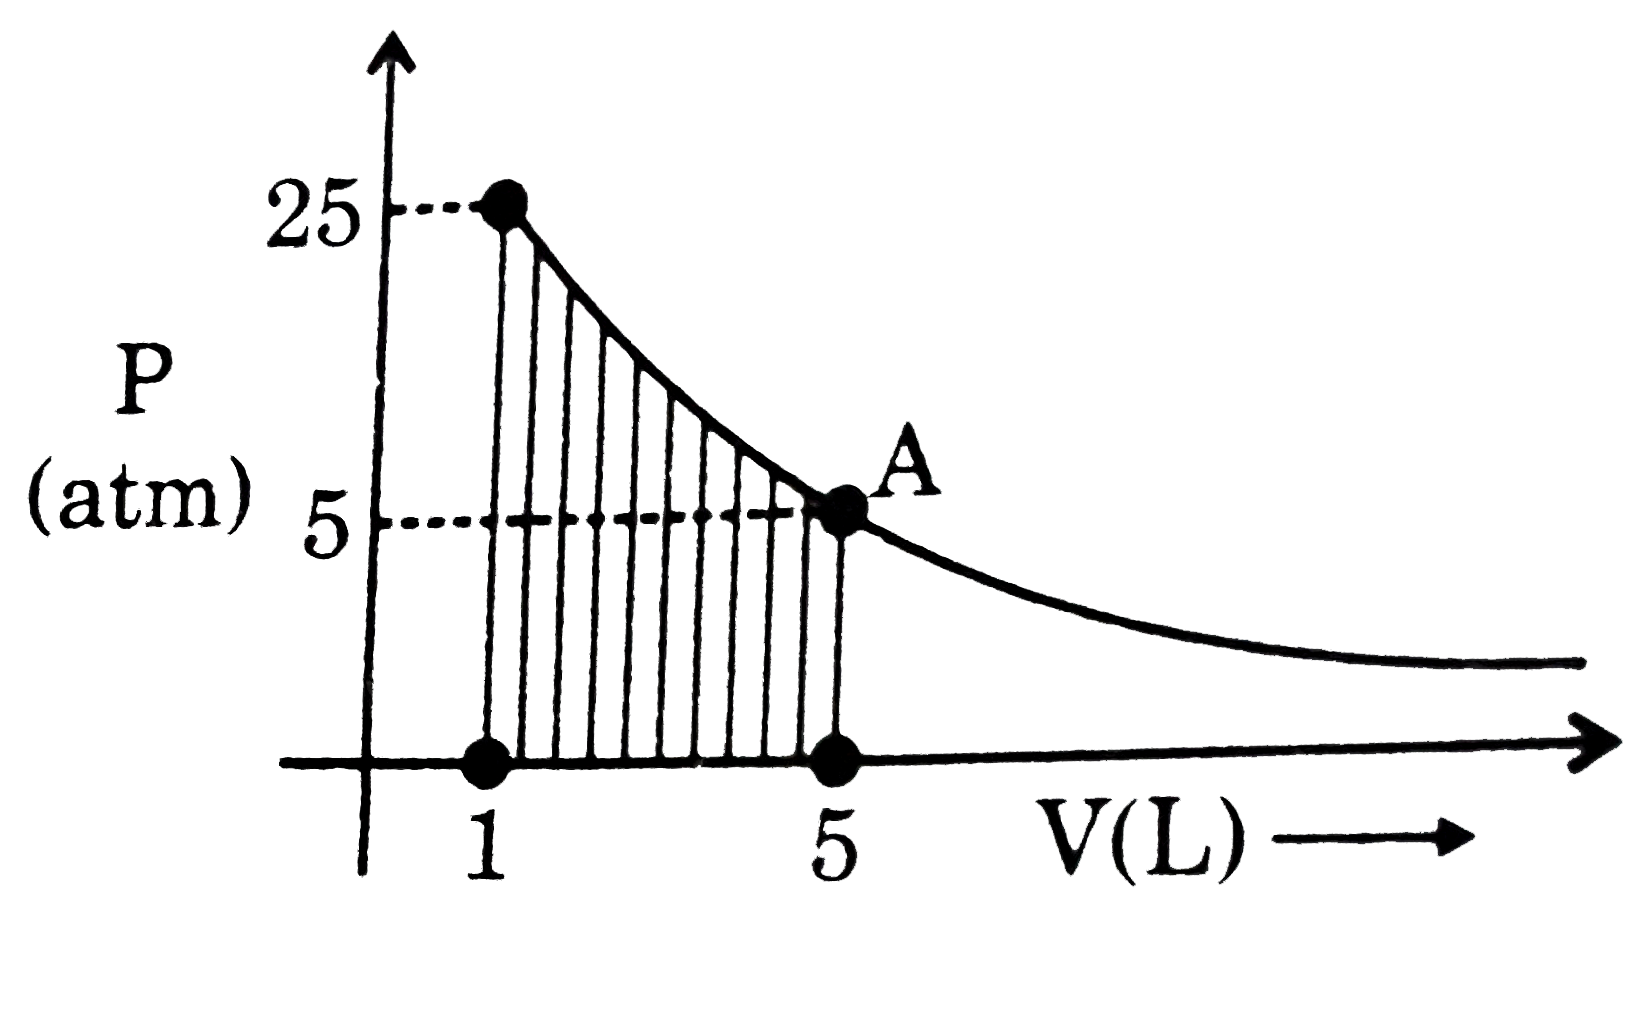
View SolutionOne mole of an ideal gas is undergoing process as shown in figure then what is the shaded area (atm-L) in the graph. (ln 5 = 1.5)
 View Solution
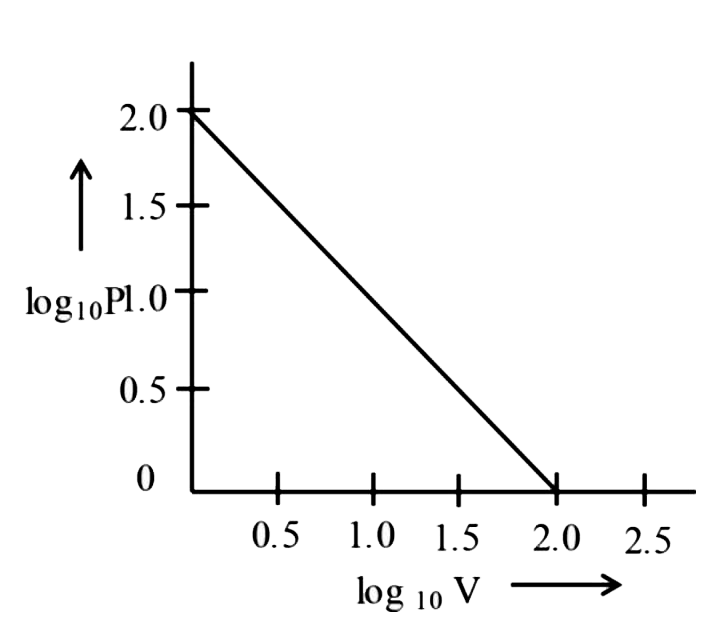
For the given isotherm for one mole of an ideal gas, which follows Boyle's law, what will be the value of temperature (R = 0.0821 (L atm/mol/K))
 View Solution

