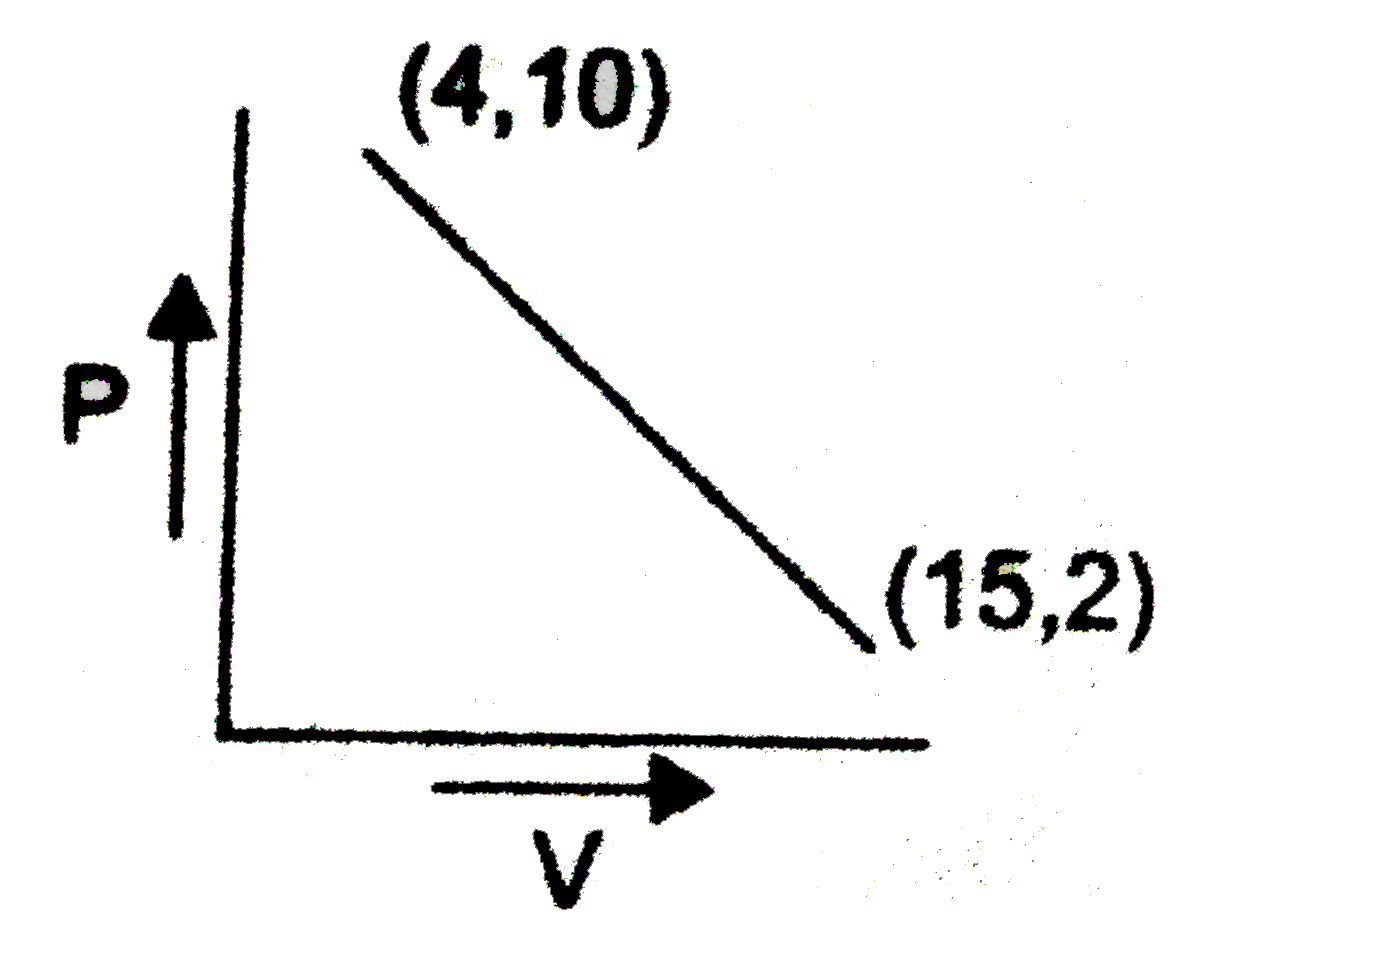
One mole of a gas changed from its initial state (15L,2 atm) to final state (4L,10 atm) reversibly. If this change can be represented by a straight line in P - V curve maximum temperature (approximate), the gas attained is x×102K. Then find the value of x.
The correct Answer is:7
Equation of line
P−2=10−24−15(V−15)
P−2=811(V−15)
P=2−8V11+15×811
P=(14211−8V11)
f(T)=1nR(142V11−8V211)
d(F(T))dV=1nR(14211−8V211)=0
V=14211×16=8.875
P=14211−811×8.87516=7111
TMax=PVnR=7111×14216×0.0821=700
=7×10²K
Topper's Solved these Questions
- GASEOUS STATEBOOK - NARENDRA AWASTHICHAPTER - GASEOUS STATEEXERCISE - Level 3 - Passage
1 Videos
- ELECTROCHEMISTRYBOOK - NARENDRA AWASTHICHAPTER - ELECTROCHEMISTRYEXERCISE - Level 3 - Subjective Problems
1 Videos
- IONIC EEQUILIBRIUMBOOK - NARENDRA AWASTHICHAPTER - IONIC EEQUILIBRIUMEXERCISE - Exercise
196 Videos
Similar Questions
1mol of a gas is changed from its initial state (15L,2atm) to final state (4L,10atm). If this change can be represented by a straight line in P−V curve, calculate the maximum temperature that, the gas attained.
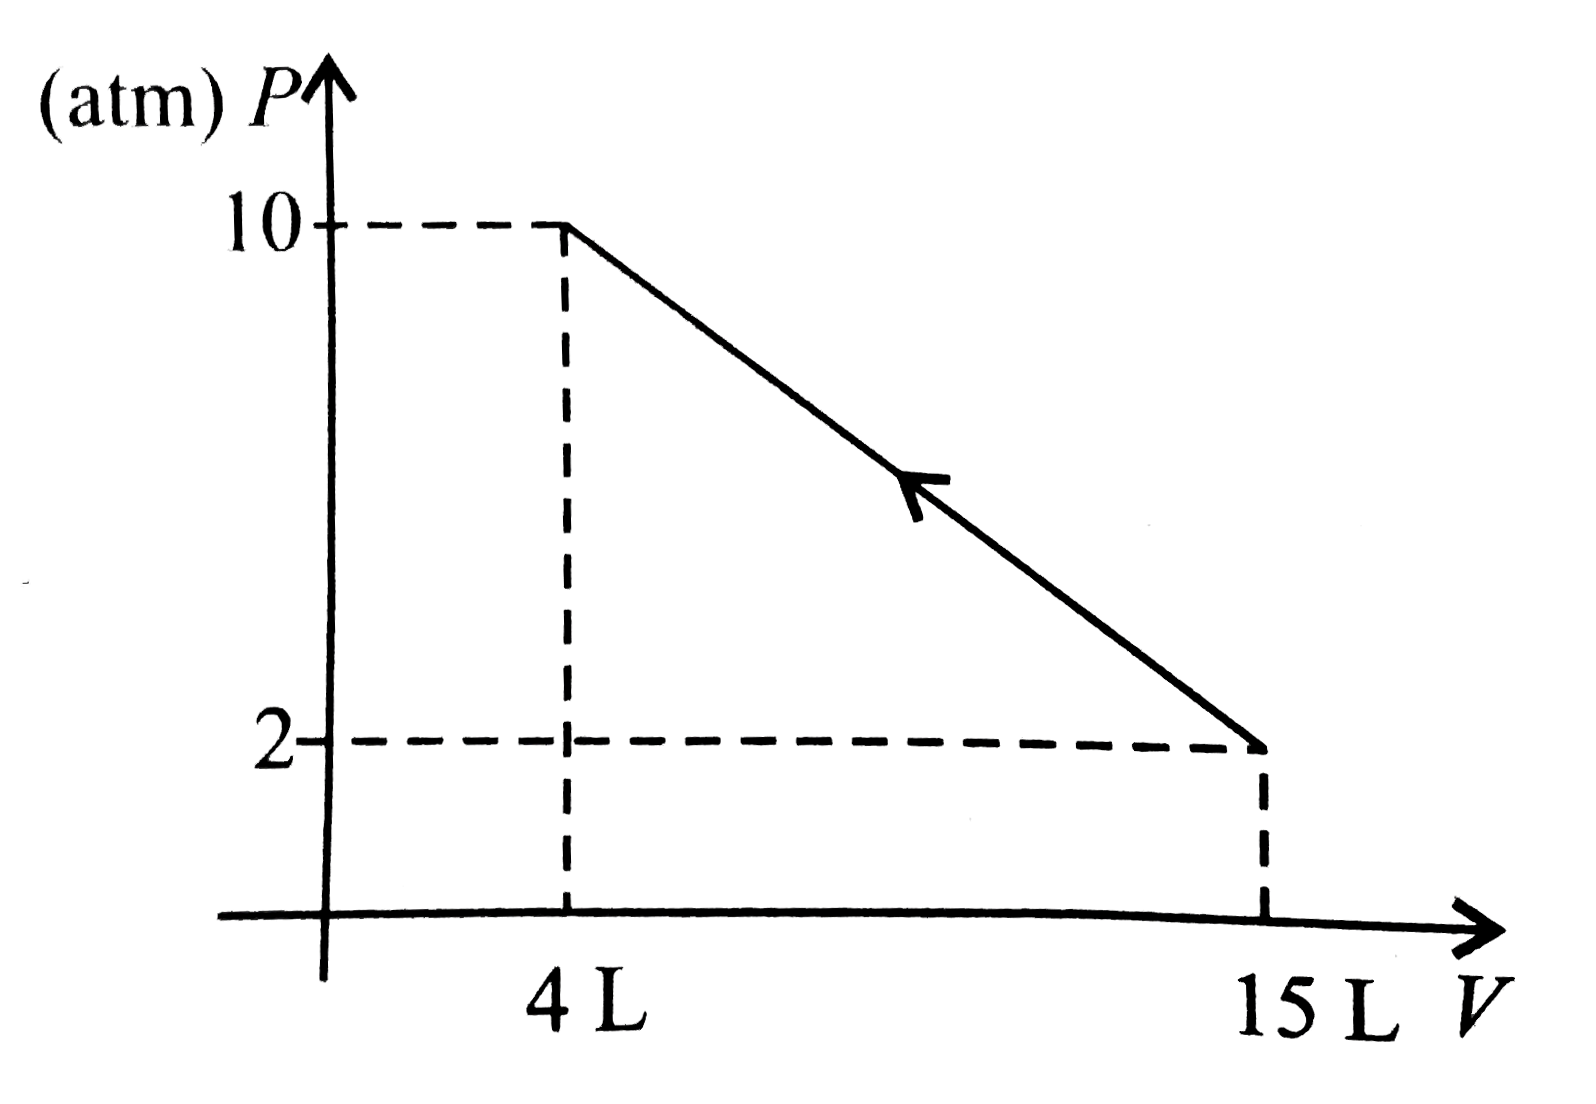
View Solution1mol of a gas is changed from its initial state (15L,2atm) to final state (4L,10atm). If this change can be represented by a straight line in P−V curve, calculate the maximum temperature that, the gas attained.

View Solution
Knowledge Check
When a sample of ideal gas is changed from an initial state to a final state, various curves can be plotted for the process like P-V curve, V-T curve,P-T curve etc.
For example, P-V curve for a fixed amount of an ideal gas at constant temperature is a rectangular hyperbola, V-T curve for a fixed amount of an ideal gas at constant volume is again a straight line. However, the shapes may vary if the constant parameters are also changed.
Now, answer the following questions :
Two moles of an ideal gas is changed from its initial state (16 atm, 6L) to final state (4 atm, 15L) in such a way that this change can be represented by a straight line in P-V curve.The maximum temperature attained by the gas during the above change is :(Take : R=112LatmK−1mol−1)A324 KB648 KC1296 KD972 KOne mole of an ideal gas undergoes a process (10L, 4atm) to (4L, 10 atm ). The process may be represented by straight line in P-V diagram
The correct statement for the process :AThe temperature of gas is constant throughout the processBThe temperature of gas will first increase and then decrease in the processCThe temperature of gas will first decrease and then increase in the processDThe initial and final temperature if gas are differentOne mole of an ideal gas undergoes a process (10L, 4atm) to (4L, 10 atm ). The process may be represented by straight line in P-V diagram
The incorrect graph regarding the process is ltbgtA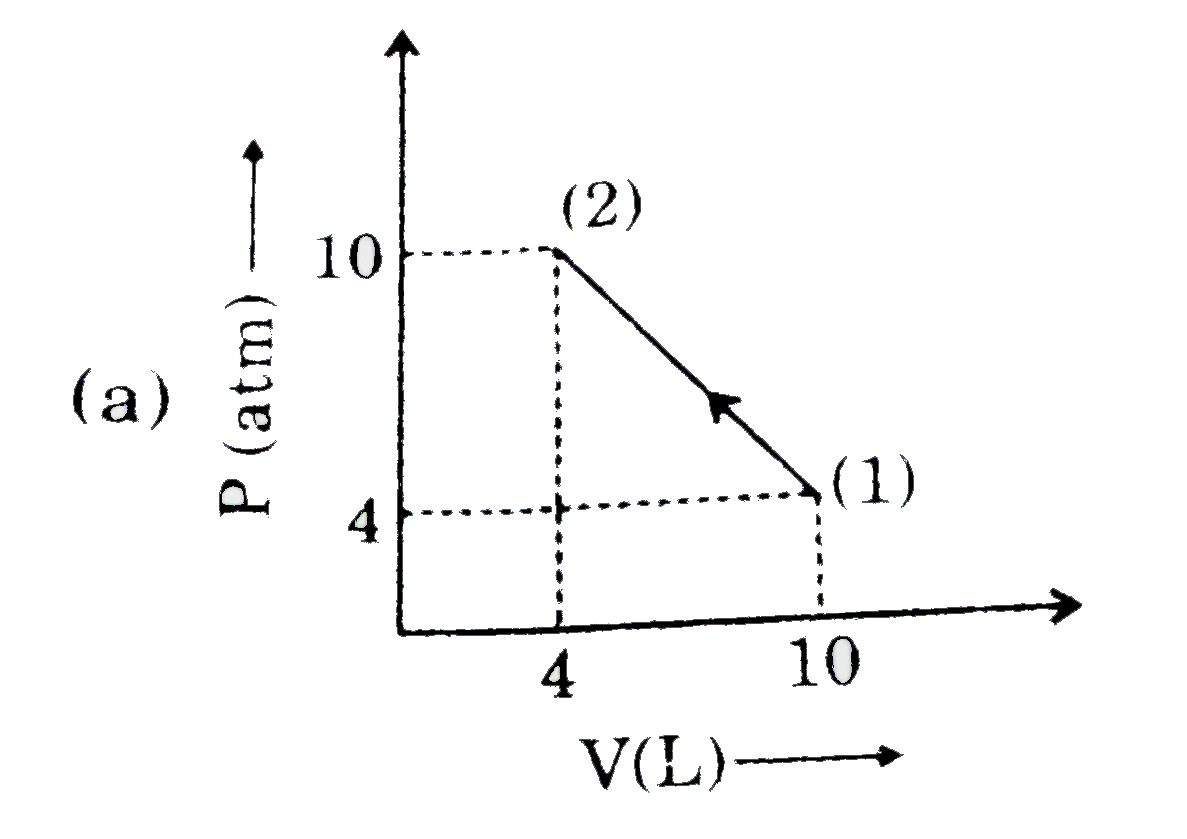 B
B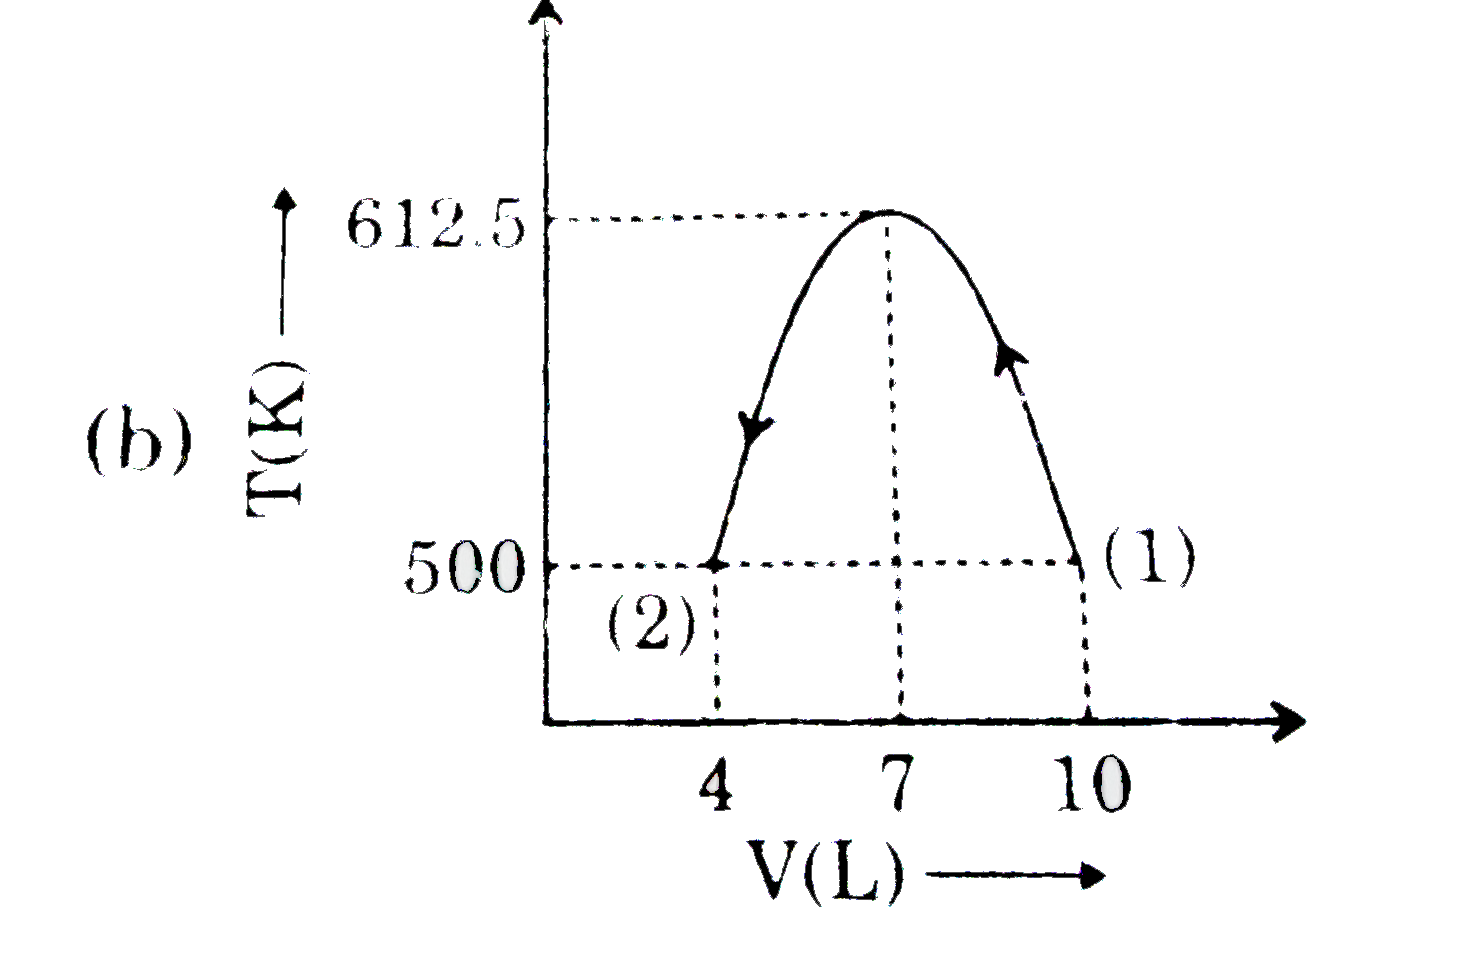 C
C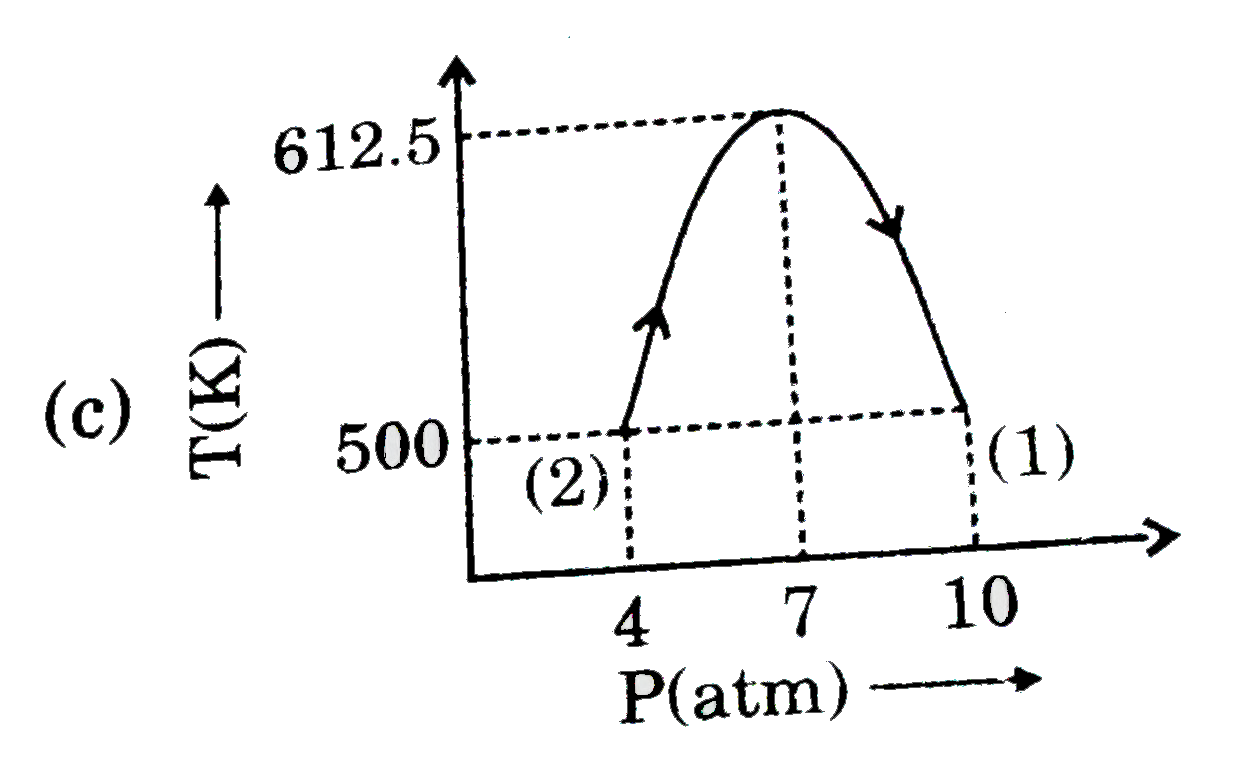 D
D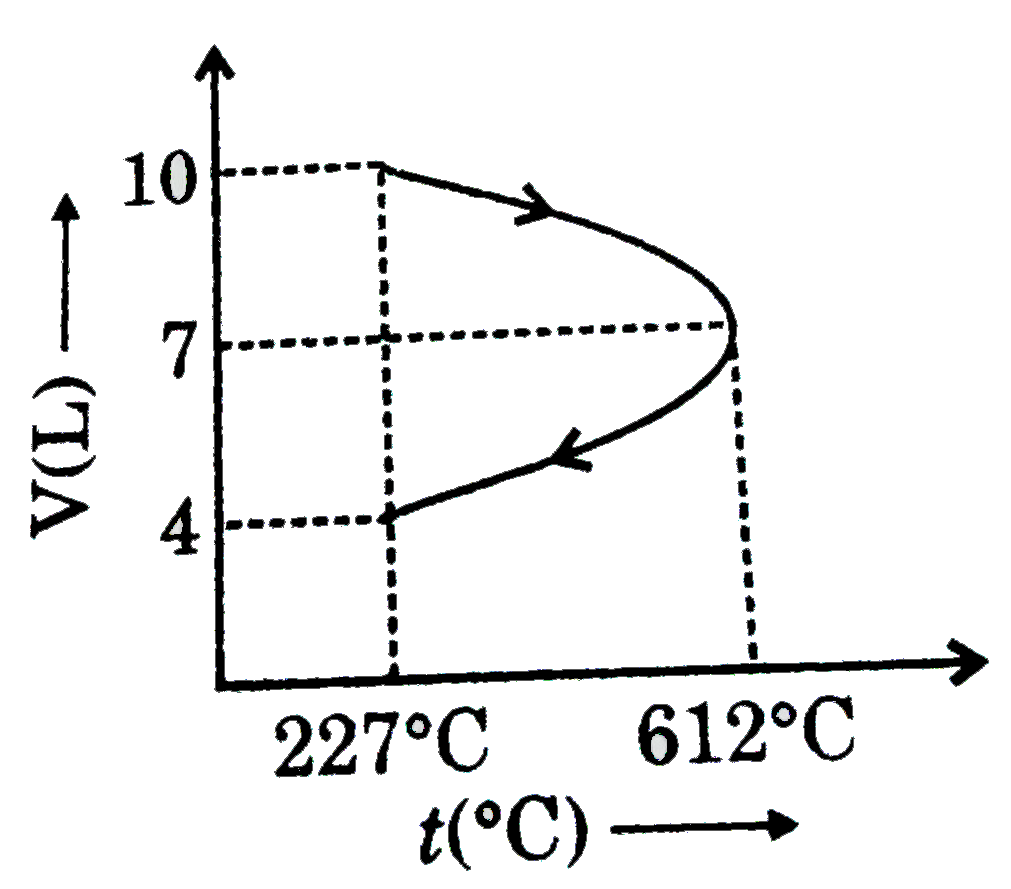
When a sample of ideal gas is changed from an initial state to a final state, various curves can be plotted for the process like P-V curve, V-T curve,P-T curve etc.
For example, P-V curve for a fixed amount of an ideal gas at constant temperature is a rectangular hyperbola, V-T curve for a fixed amount of an ideal gas at constant volume is again a straight line. However, the shapes may vary if the constant parameters are also changed.
Now, answer the following questions :
Two moles of an ideal gas is changed from its initial state (16 atm, 6L) to final state (4 atm, 15L) in such a way that this change can be represented by a straight line in P-V curve.The maximum temperature attained by the gas during the above change is :(Take : R=112LatmK−1mol−1)
View SolutionOne mole of an ideal gas undergoes change of state from (4 L, 3 atm) to (6 L, 5 atm). If the change in internal energy is 45 L-atm then the change of enthalpy for the process is
View SolutionOne mole of an ideal gas undergoes change of state from (4 L, 3 atm) to (6 L, 5 atm). If the change in internal energy is 45 L-atm then the change of enthalpy for the process is
View SolutionOne mole of an ideal gas undergoes a process (10L, 4atm) to (4L, 10 atm ). The process may be represented by straight line in P-V diagram
The only incorrect statement is :
(R = 0.08 L-atm/K-mol)
View SolutionOne mole of an ideal gas undergoes change of state from (4 L, 3 atm) to (6 L, 5 atm). If the change in internal energy is 45 L-atm then the change of enthalpy for the process is
View Solution
