The relation between species richness and area for a wide variety of taxa turns out to be a rectangular hyperbola. Give a brief explanation.
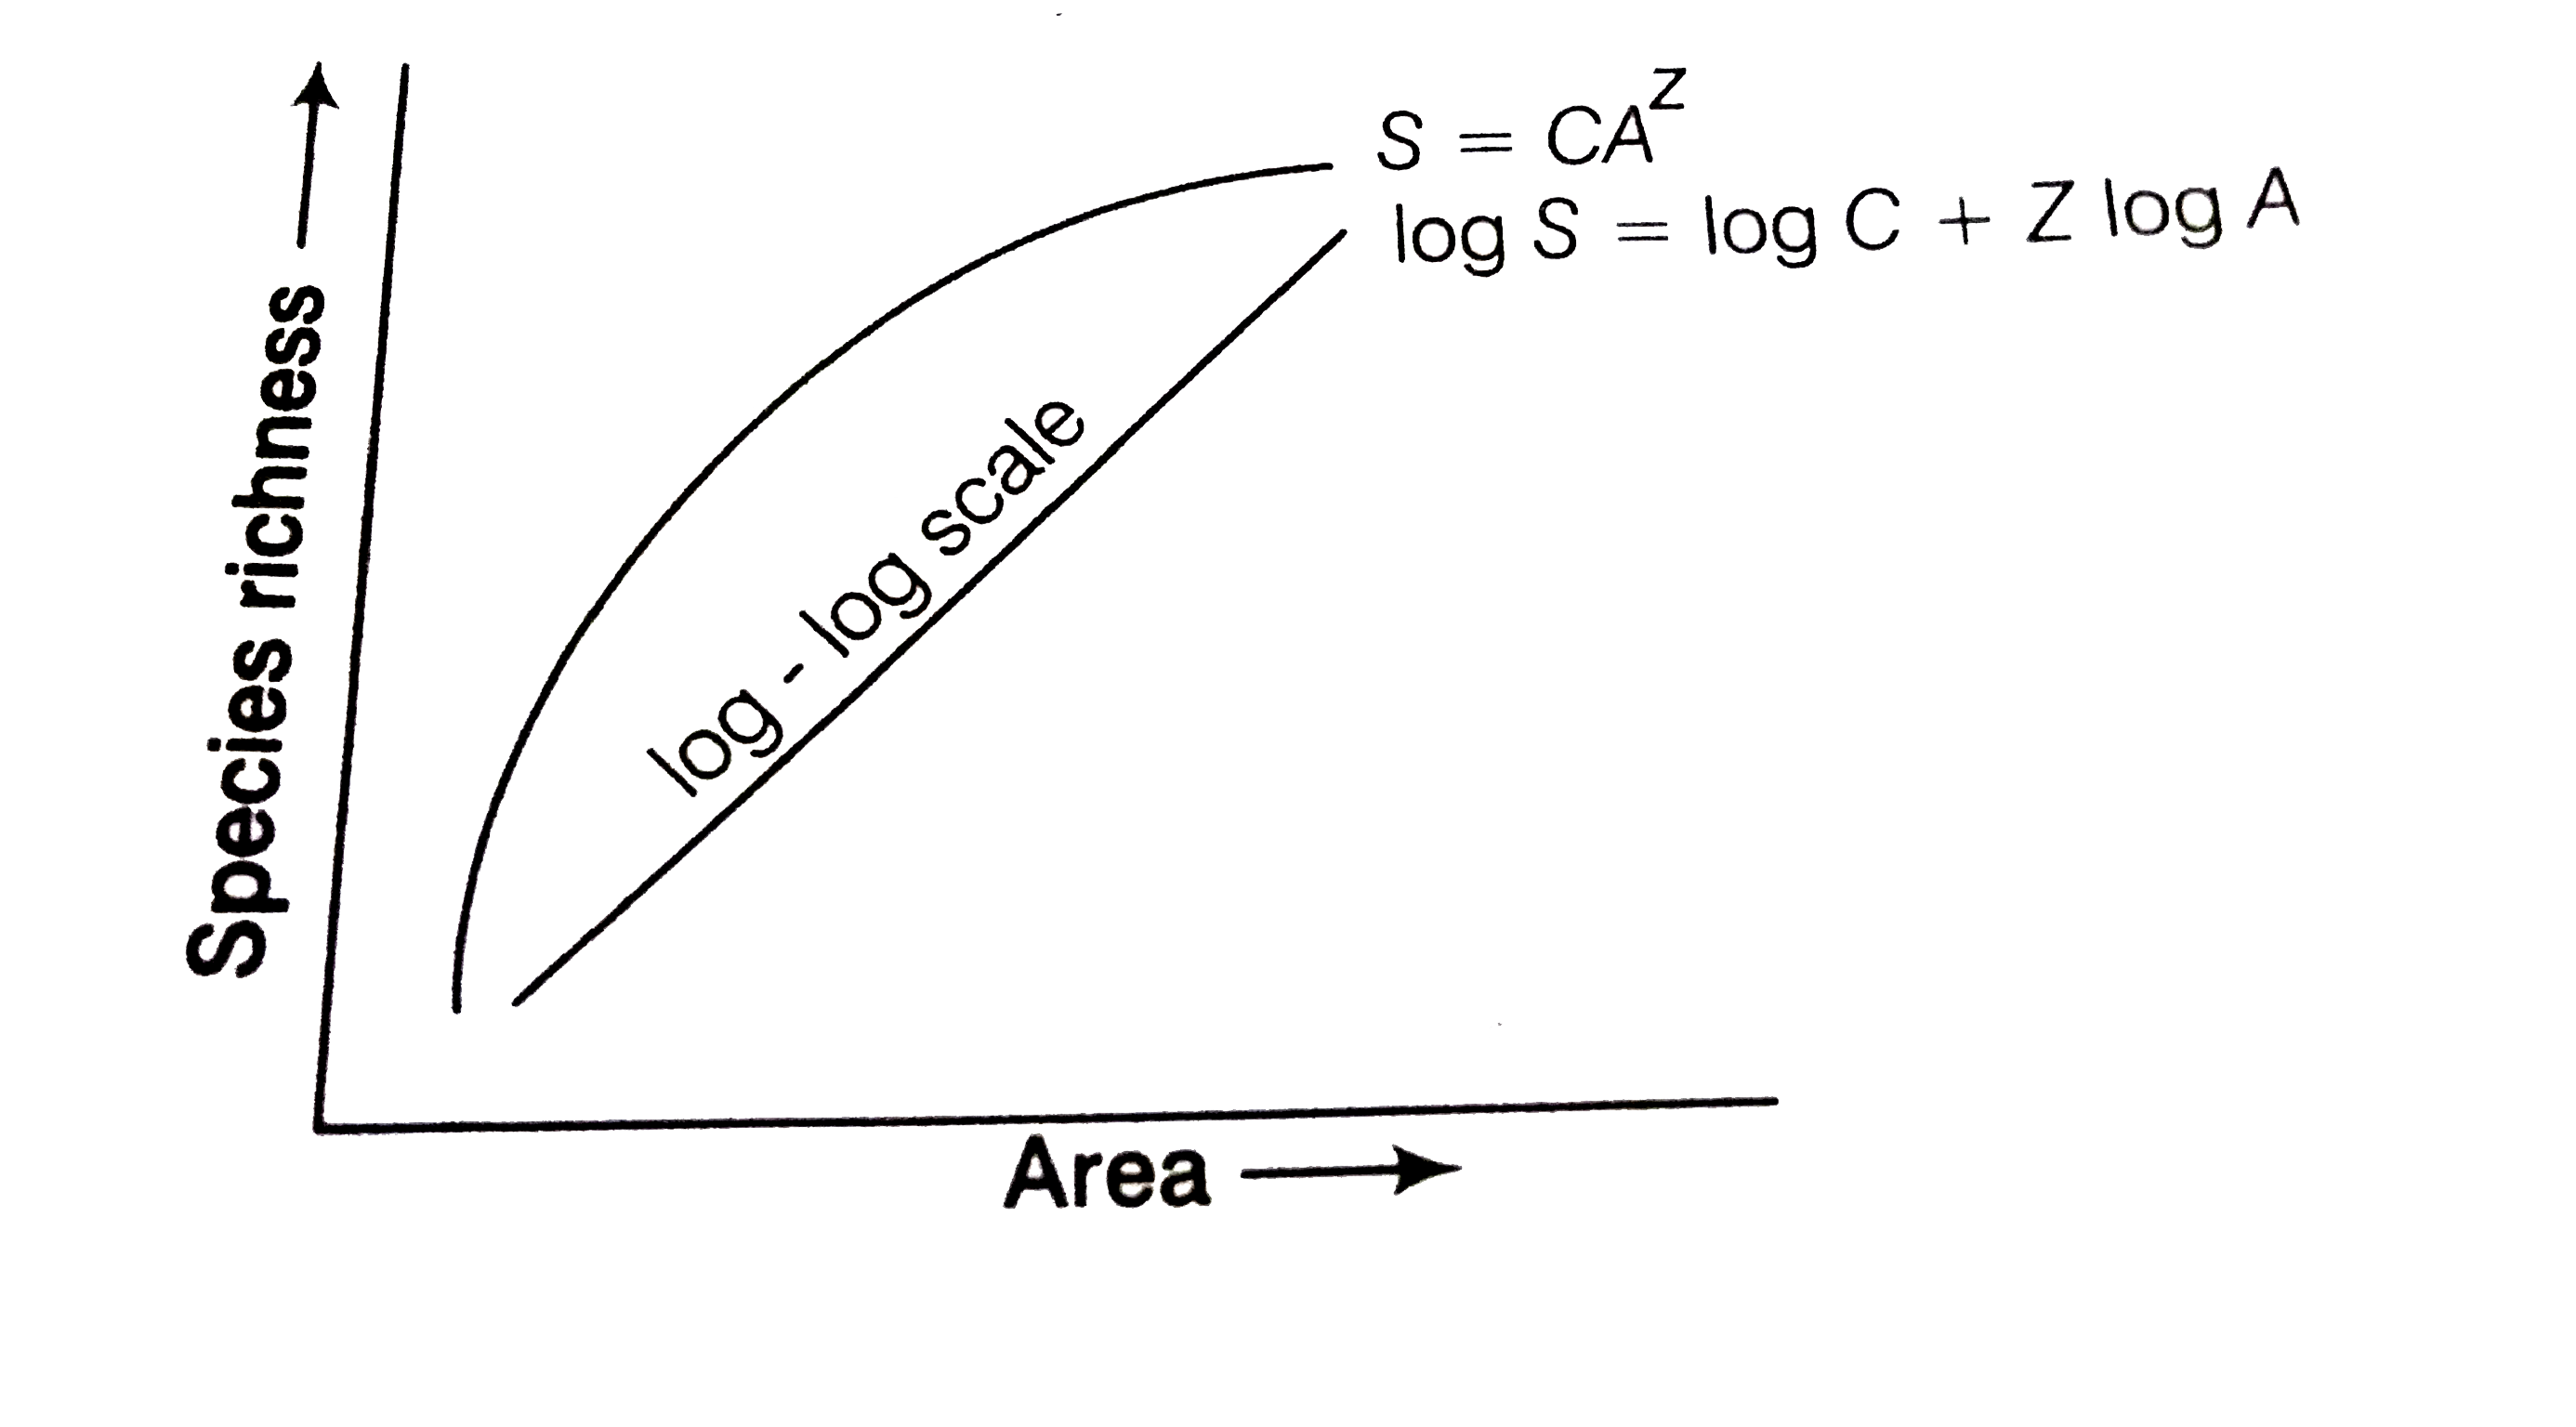
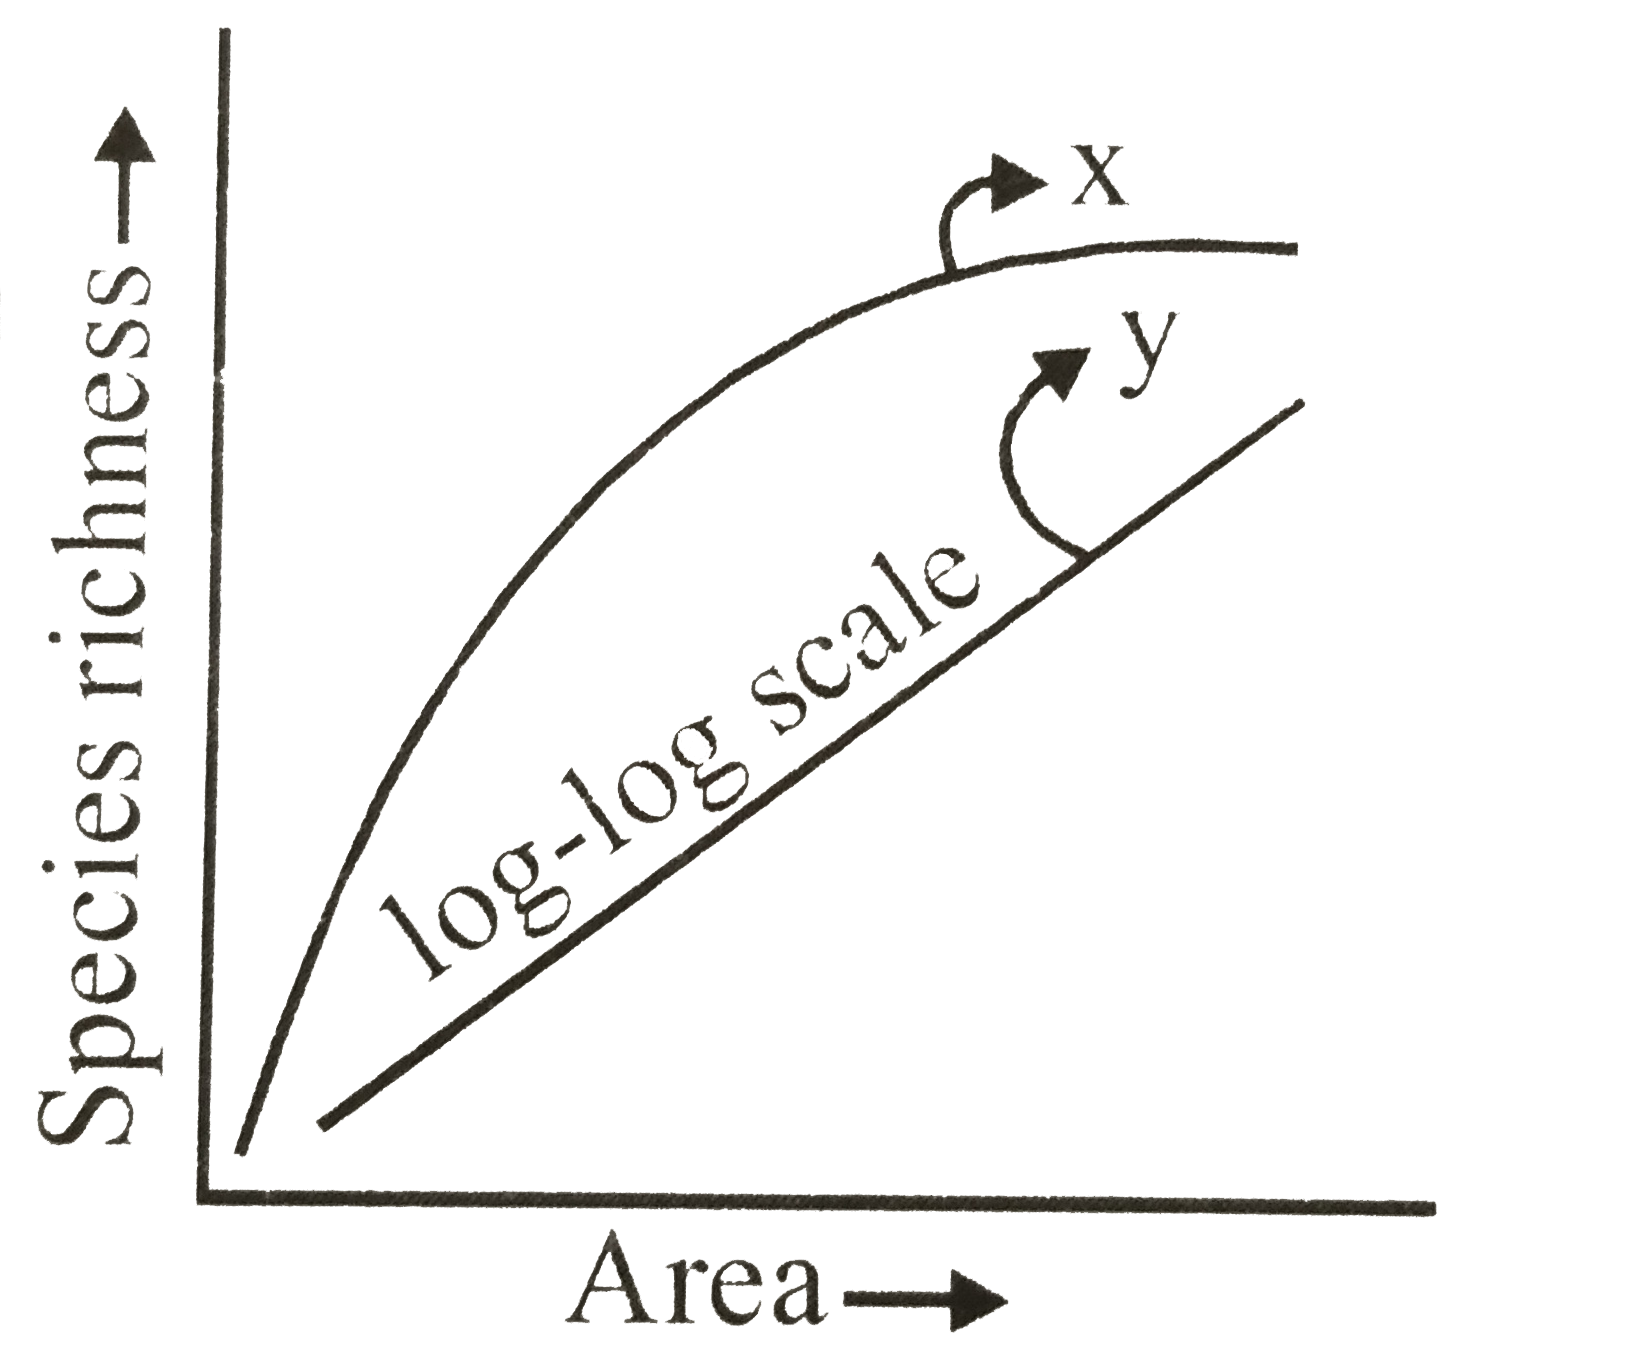
According to AV Humboldt, a German scientist within, a region, species richness increased with icreasing explored area (only upto a limit). Accordingly the relation between species richness and area for a wide variety of taxa (birds, bat, angiosperms, aquatic fishes) turns out to be a rectangular hyperbola.
The relationship depicts a straight line on a logaithimic scale described by the following equation
logS=logC+ZlogA
Where 'S' stands for species richness, 'A' is area and 'Z' and 'C' are slope of line (regression coefficient) and y intercept respectively.

Topper's Solved these Questions
Similar Questions
Indicate whether the following statements are true or false :
(i) New York in temperate area has 56 species of birds.
(ii) Tropical biomes unlike temperate ones, are more seasonal, relatively less constant and predictable.
(iii) Relationship between species richness (S) and area (A) turned out to be rectangular hyperboia on a logarithmic scale.
(iv) Slope of regression (Z) is 1.15 for frugivorous birds and mammals in tropical forests of different continents.
View Solution
Study the above graph and answer the following questions -
(i) Identify x and y
(ii) The relation between species richness and area can be denoted as generally
(iii) The value of z lies in range of
(iv) On a log scale the relation between species richness and area is
View Solution
Knowledge Check
The relation between species richness and area is correctly depicted by
ALogS=logC−ZlogABLogS=ZlogACLogS=logC+ZlogADLogS=logCThe relation between species richness and area for a wide variety of taxa (angiosperm plants, birds, bats, freshwater fishes) is a
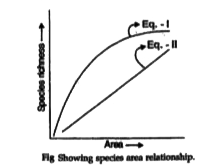
AParabolaBRectangular hyperbolaCEllipseDStraight lineThe great German naturalist and geographer Alexander von Humboldt observed that within a region species richness increased with increasing explored area, but only up to a limit. In fact, relation between species richness and area for a wide variety of taxa (angiosperm plants, birds, bats, freshwater fi ishes) turns out to be a rectangular hyperbola. Now find out correct equations shown in the graph.
 AI - S−CAZ II -LogS=logC+ZlogABI - LogS=logC+ZlogA, II - S−CAZCI - S−CAZ+logC, II - LogS=logC+ZlogADI - S−CAZ+logA, II - LogS=logC+ZlogA
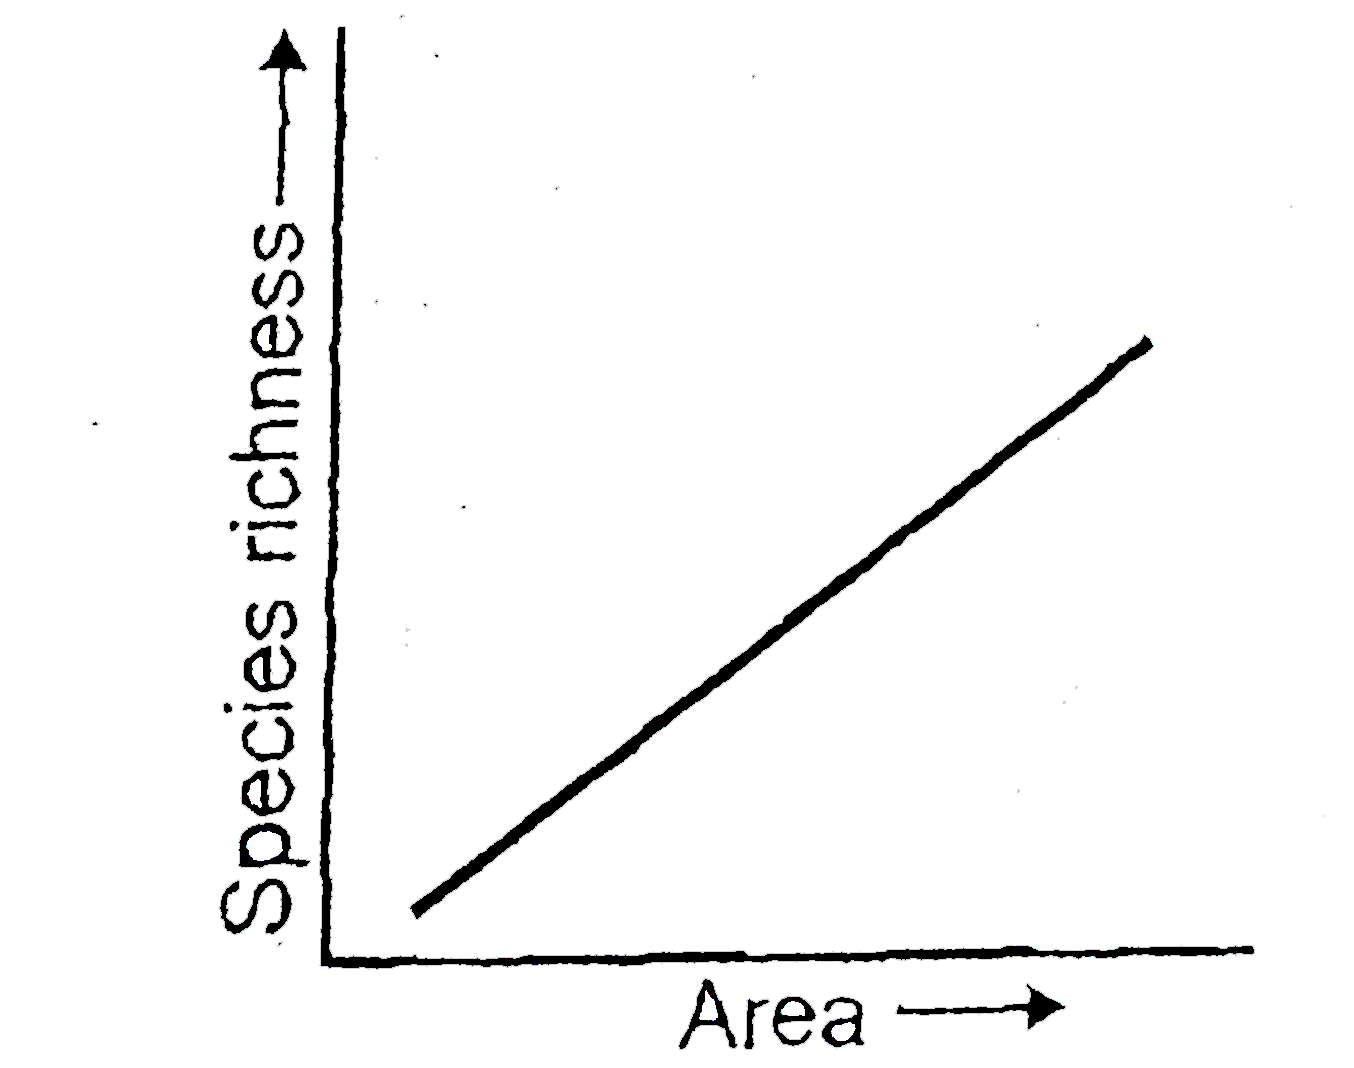
Relationship between species richness (S) and area (A) represent in the following graph is described by the equation

View SolutionWhich of the statement are in accordance with the observation of geographer Alexander von Humboldt ?
I. Within a region species, richness increases with increasing explored area but within a limit.
II. The relation between species richness and area is a rectangular hyperbole.
III. The richness of species decreases with the increasing explored area.
IV. There is no relation between the explored area and species richness .
View SolutionThe graph formed by plotting species richness against area for a wide variety of taxa (angiosperm plants, birds , bats , fresh water fishes , etc) turns out to be a
View SolutionThe relation between specises richness and area is described on a logarithmic scale by the equation [where S = species richness, A = area, Z = slope of the line (regression coefficient ), C= Y - intercept]
View SolutionThe relation between specles richness and area Is described on a logarithmic scale by the equaton (where 8 - specles richness, A= area, Z = slope of the line (regression co-efficient), C=Y-Intercept].
View Solution
