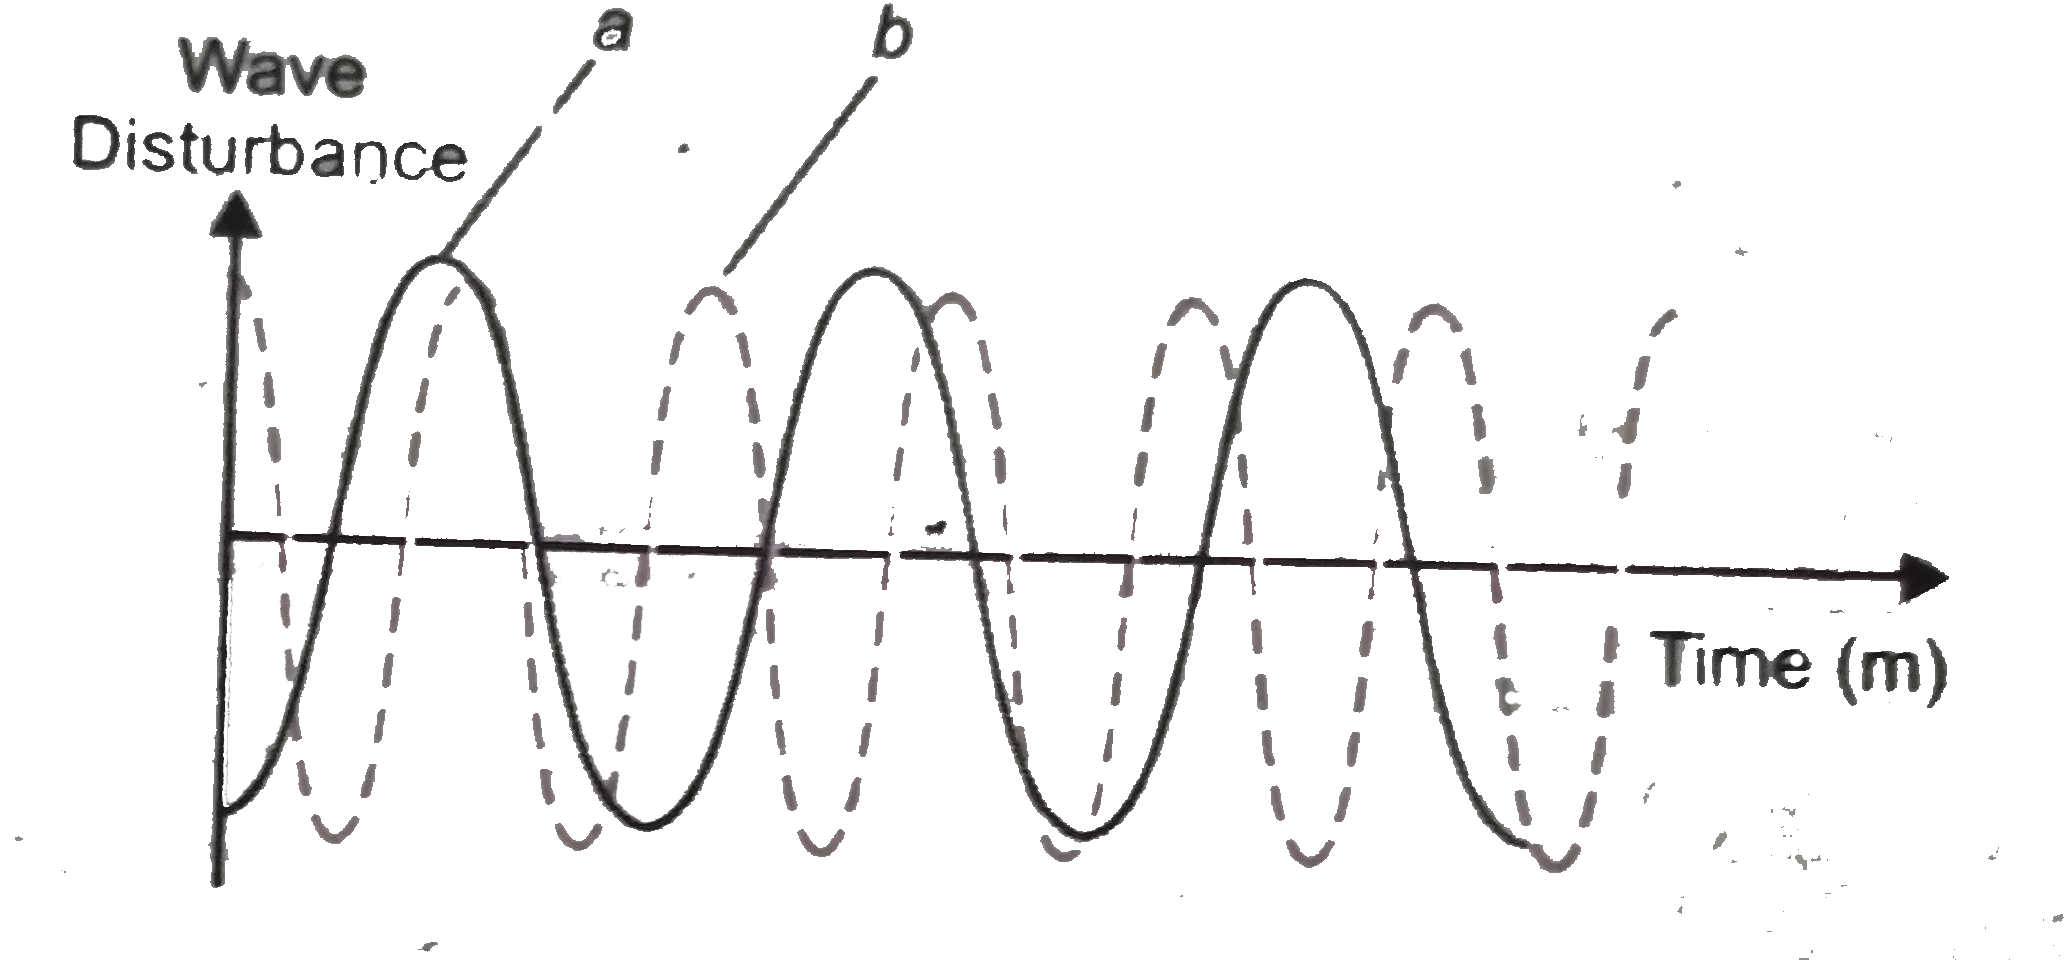
Which of the above two graphs : (a) and (b)the human voice is likely to be the male voice ? Give reason for your answer.
 .
.
Video Solution
Text Solution
Graph (i) represents the male voice. Since the pitch and frequency of male voice is lower than the pitch of female voice and vibration of graph (ii) represents higher frequency and higher pitch.
|
Updated on:21/07/2023
Topper's Solved these Questions
Similar Questions
Knowledge Check
- Question 1 - Select One
Which of the following voices is likely to have minimum frequency?
ABaby girlBBaby boyCA manDA woman
The surfaces of which planets, inner or outer, are more likely to support life? Give a reason for your answer.
View SolutionGive there reasons in support of your answer .
View SolutionWhich of the following sentences are statements ? Give reason for your answer.
Answer this question.View SolutionWhich of the following sentences are statements? Give reasons for your answer :
Answer this question.View SolutionWhat would your image look like if you stood close to a large :
(a) convex mirror ?
(b) concave mirror ?
Give reasons for your answer.View SolutionName the section of throat in which the human voice is produced.
View SolutionGive the location of testes in human male. Give reason.
View Solution

