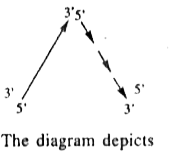
The following diagram depicts the situation of :
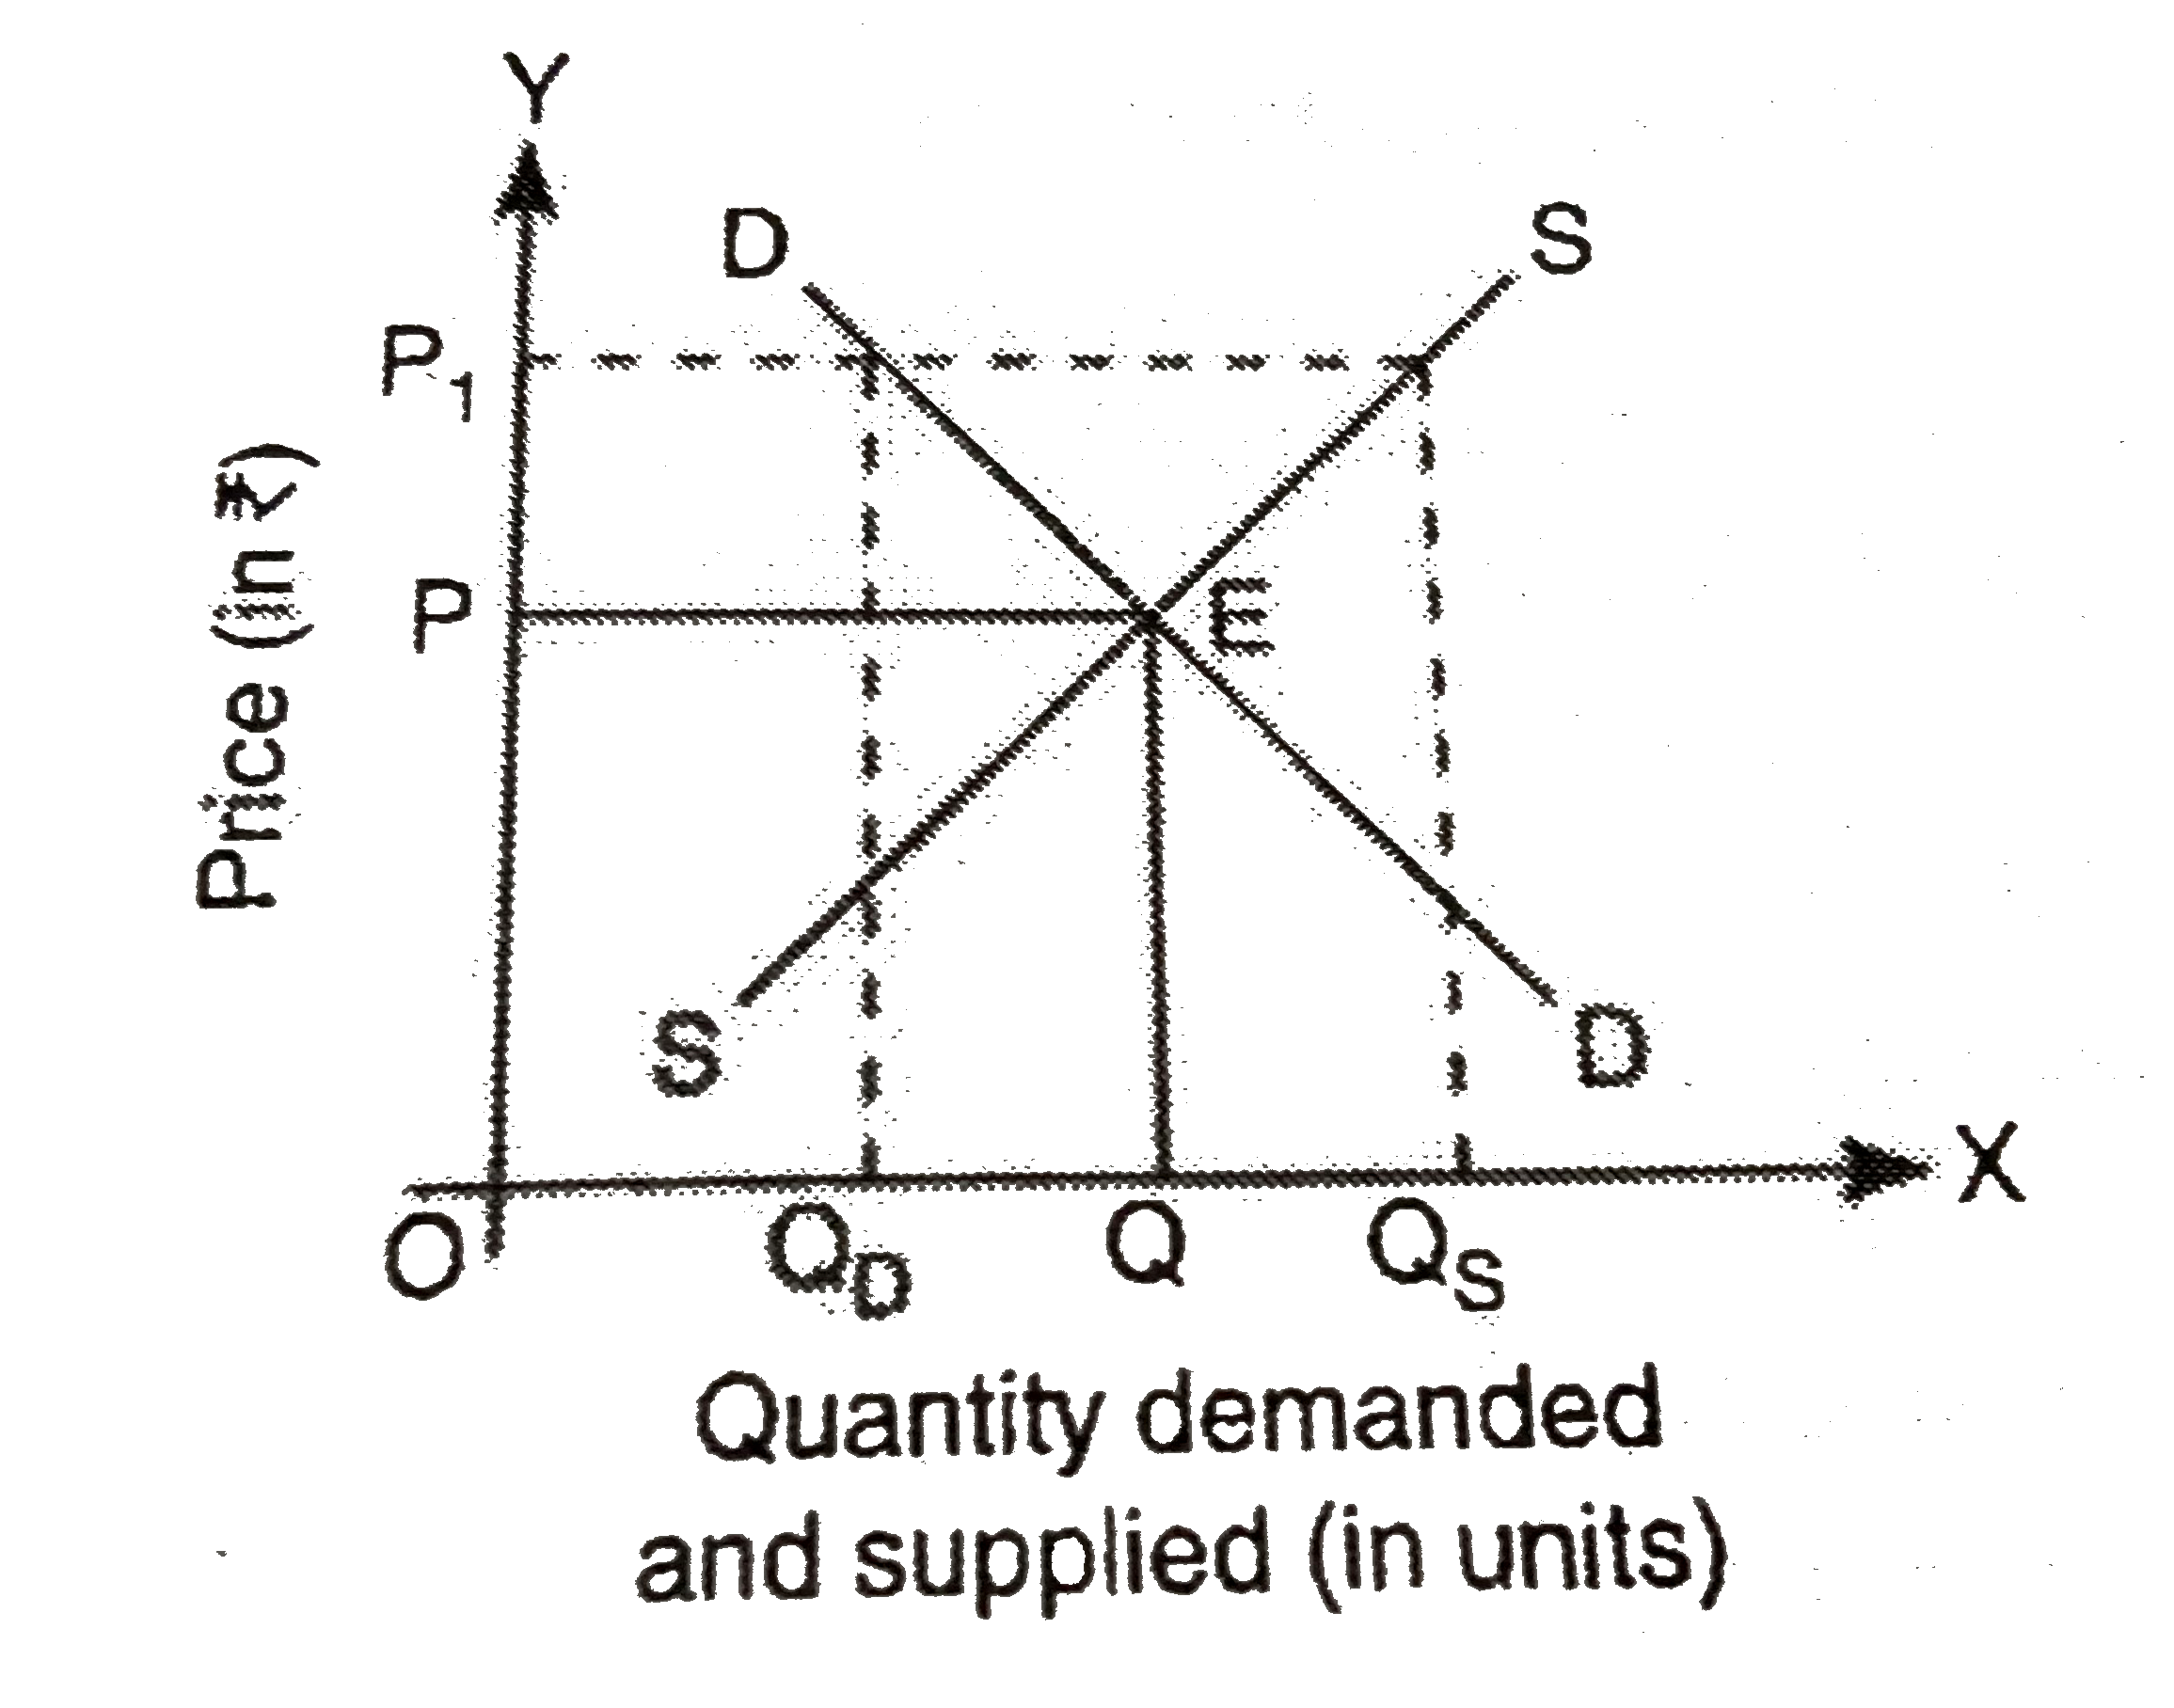
A
Excess Supply
B
Excess Demand
C
Equilibrium Condition
D
None of these
Text Solution
The correct Answer is:(a)
|
Topper's Solved these Questions
- PRICE DETERMINATION AND SIMPLE APPLICATIONSBOOK - SANDEEP GARGCHAPTER - PRICE DETERMINATION AND SIMPLE APPLICATIONSEXERCISE - Short Answer Type Questions
20 Videos
- PRICE DETERMINATION AND SIMPLE APPLICATIONSBOOK - SANDEEP GARGCHAPTER - PRICE DETERMINATION AND SIMPLE APPLICATIONSEXERCISE - Long Answer Type Questions
28 Videos
- PRICE DETERMINATION AND SIMPLE APPLICATIONSBOOK - SANDEEP GARGCHAPTER - PRICE DETERMINATION AND SIMPLE APPLICATIONSEXERCISE - Very Short Answer Type Questions
22 Videos
- MAIN MARKET FORMSBOOK - SANDEEP GARGCHAPTER - MAIN MARKET FORMSEXERCISE - Very short
17 Videos
- PRODUCER'S EQUILIBRIUMBOOK - SANDEEP GARGCHAPTER - PRODUCER'S EQUILIBRIUMEXERCISE - Unsolved Practicals
12 Videos
Similar Questions
Knowledge Check
The following diagram represents the situation of:
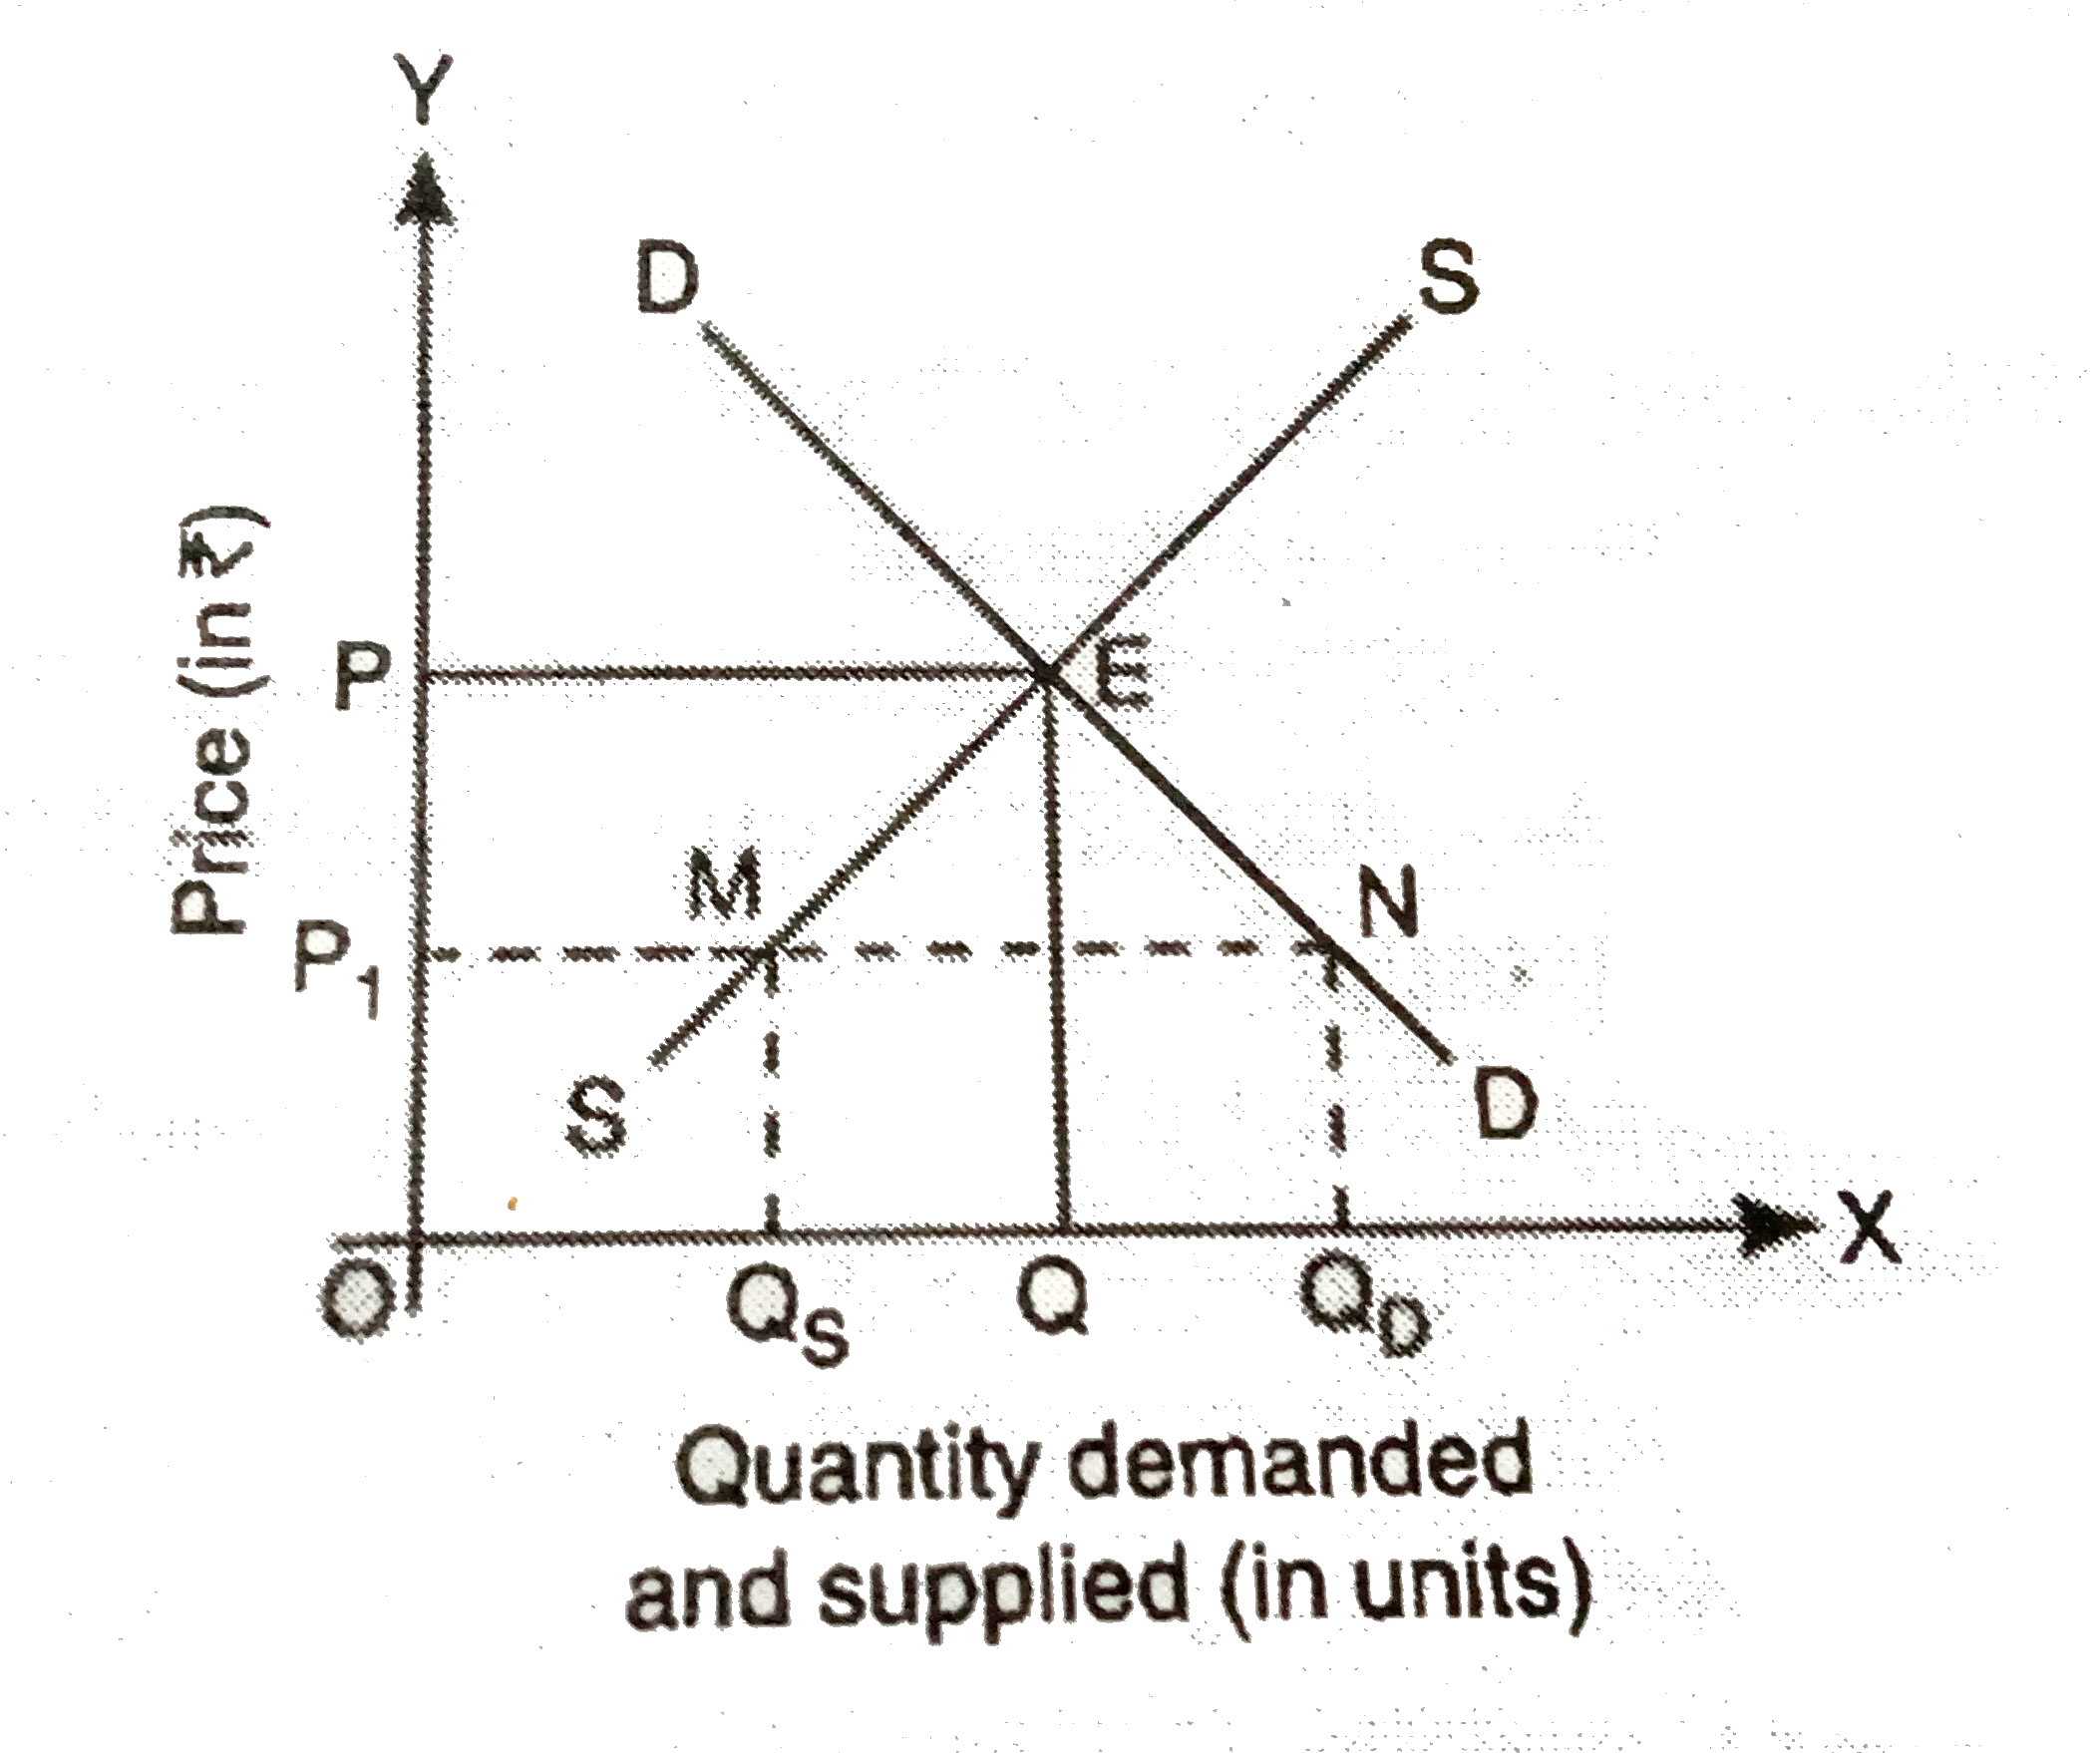 APrice FloorBPrice CeilingCEither (a) or (b)DNeither (a) nor (b)
Which of the following diagram represent the situation of 'Expansion in Demand' ?
A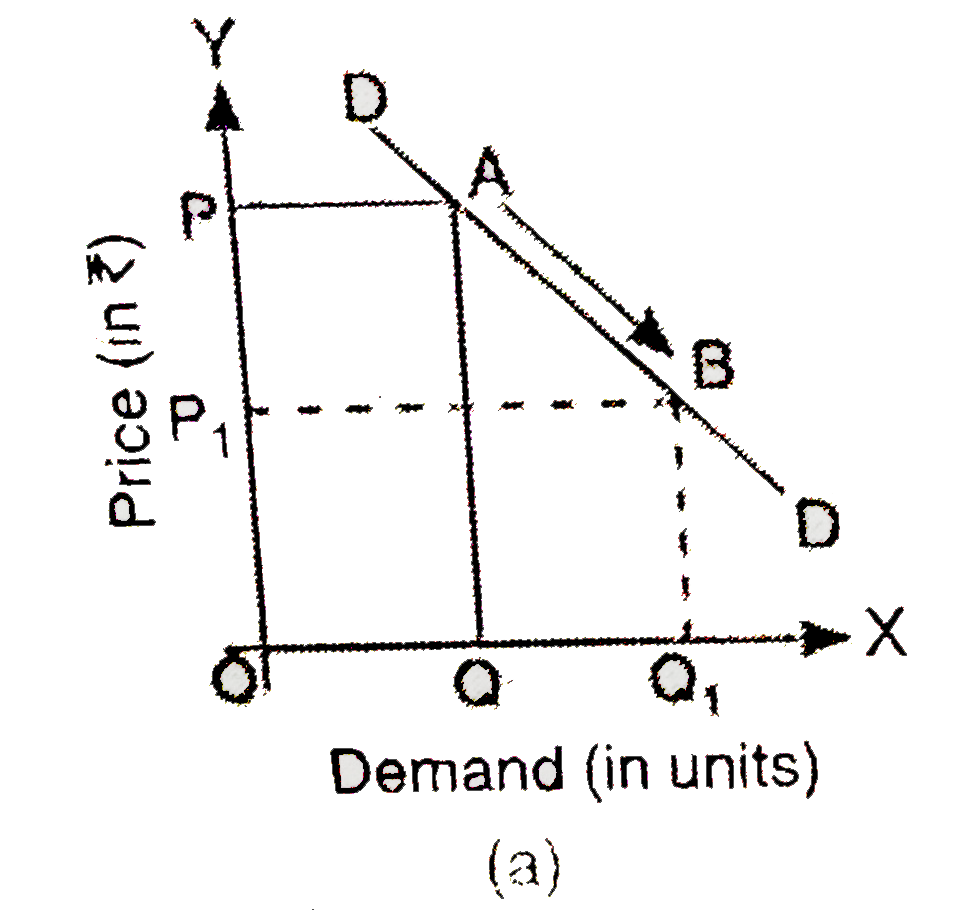 B
B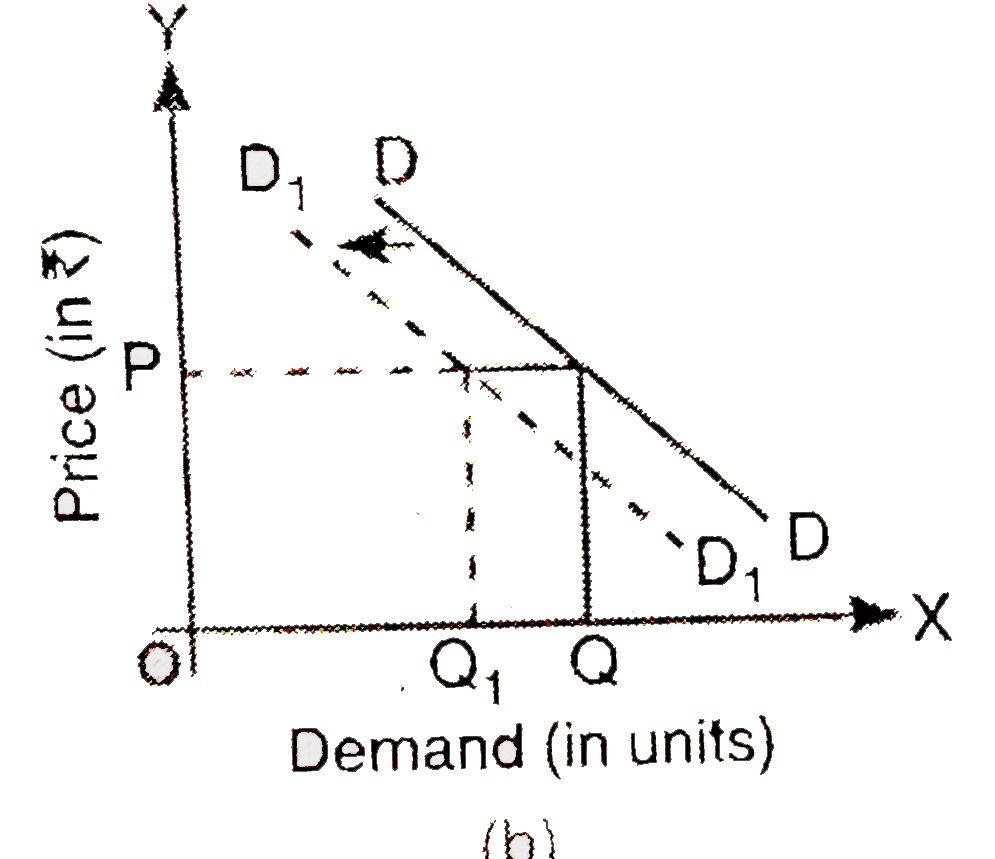 C
C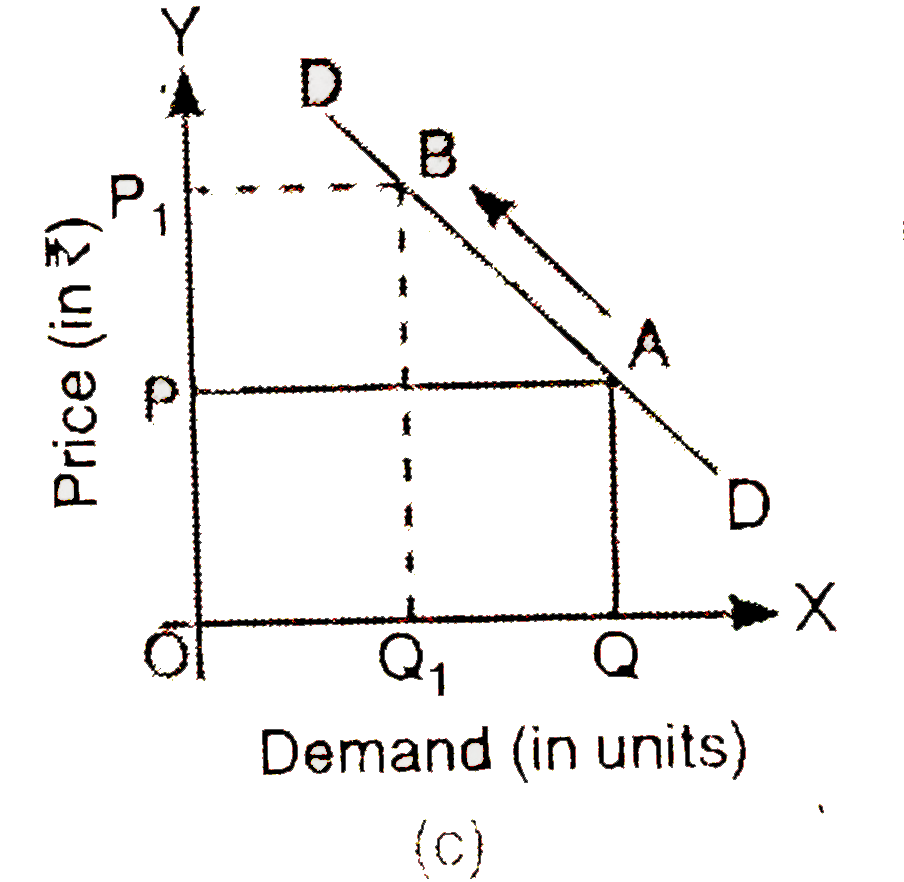 D
D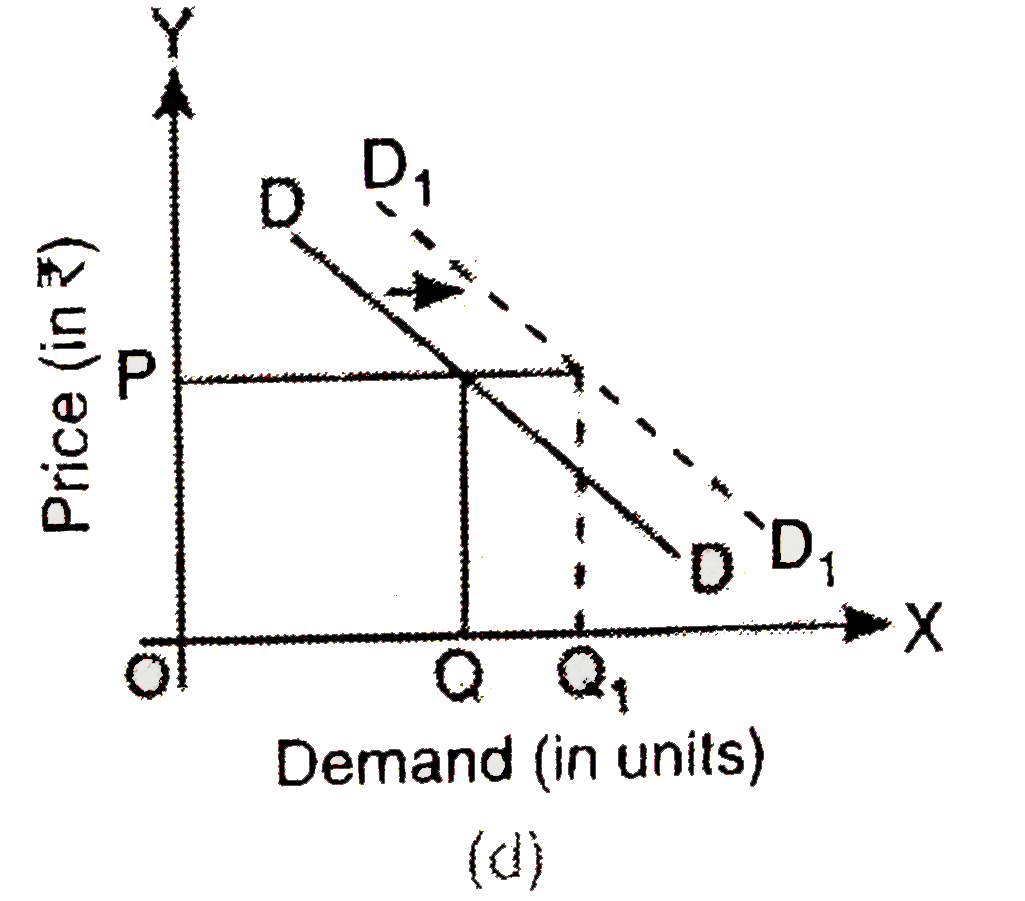
which of the following diagram correctly depicts the situation of Unitary Elastic Supply ?
A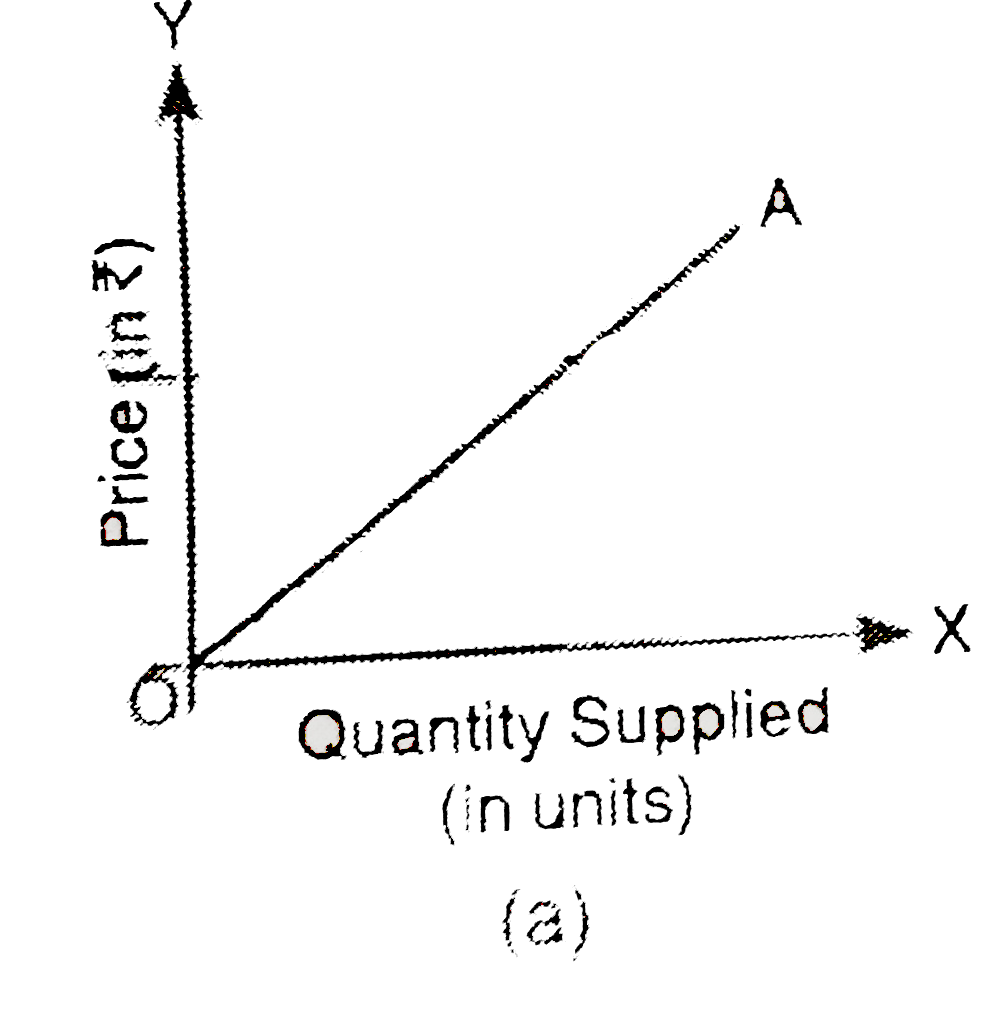 B
B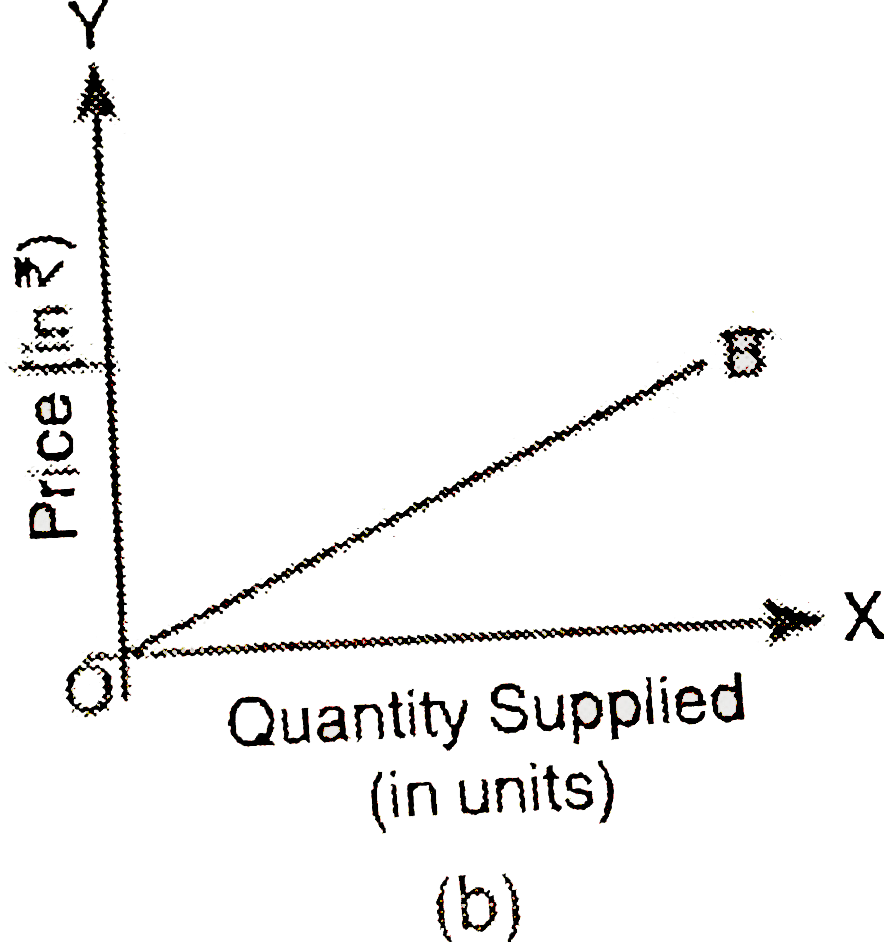 C
C DAll of these
Which of the following diagrams best depicts the relation among Liquids, Milk and River water?
View SolutionWhich of the following diagram best depicts the relationship between Professor, Author and Infants?
View SolutionWhich of the following diagram best depicts the relationship between student, college and school?

View SolutionWhich of the following diagram correctly depicts the situation of Less Demand ?
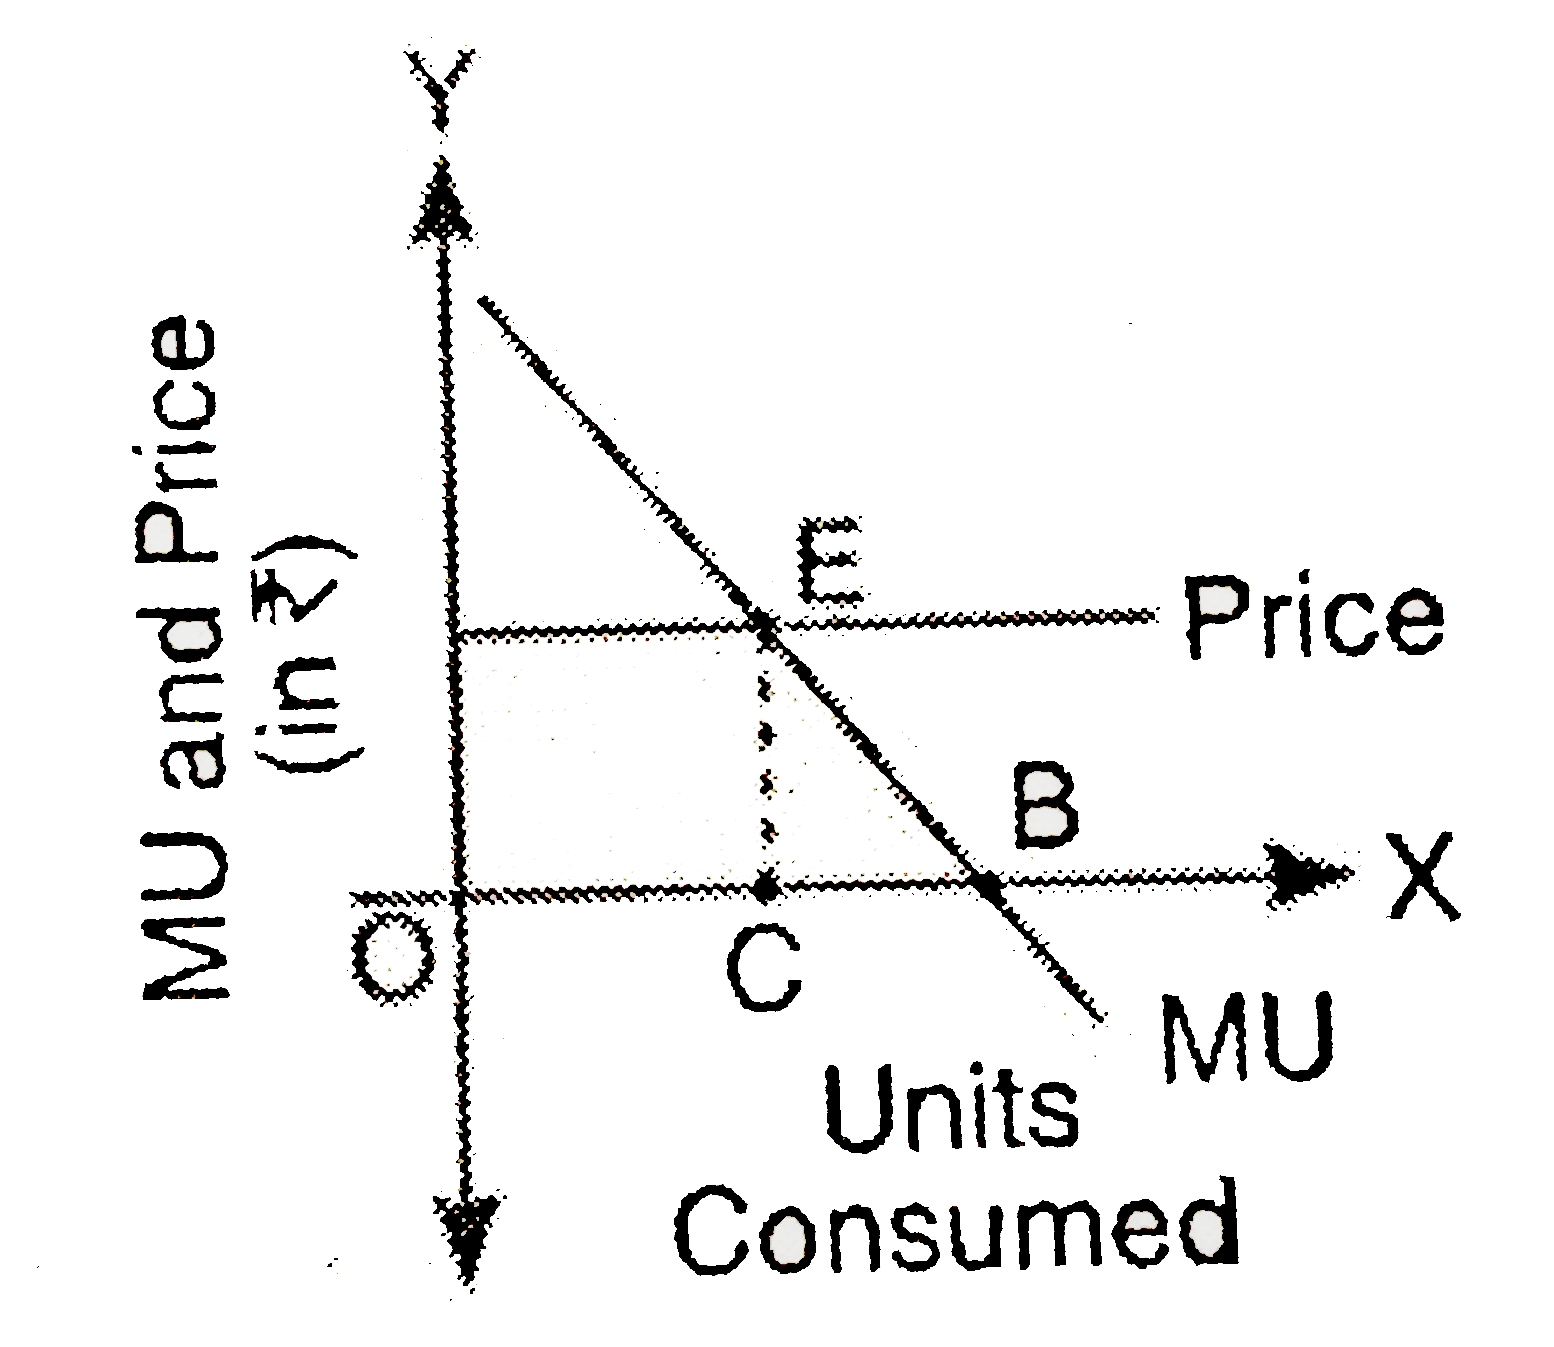
View SolutionIn the following diagram, the situation of Consumer's Equilibrium and Point of Satiety are represented by the points:
View Solution

