The supply curve of a given commodity is given to be S0. On the basis of this diagram, answer the following questions:
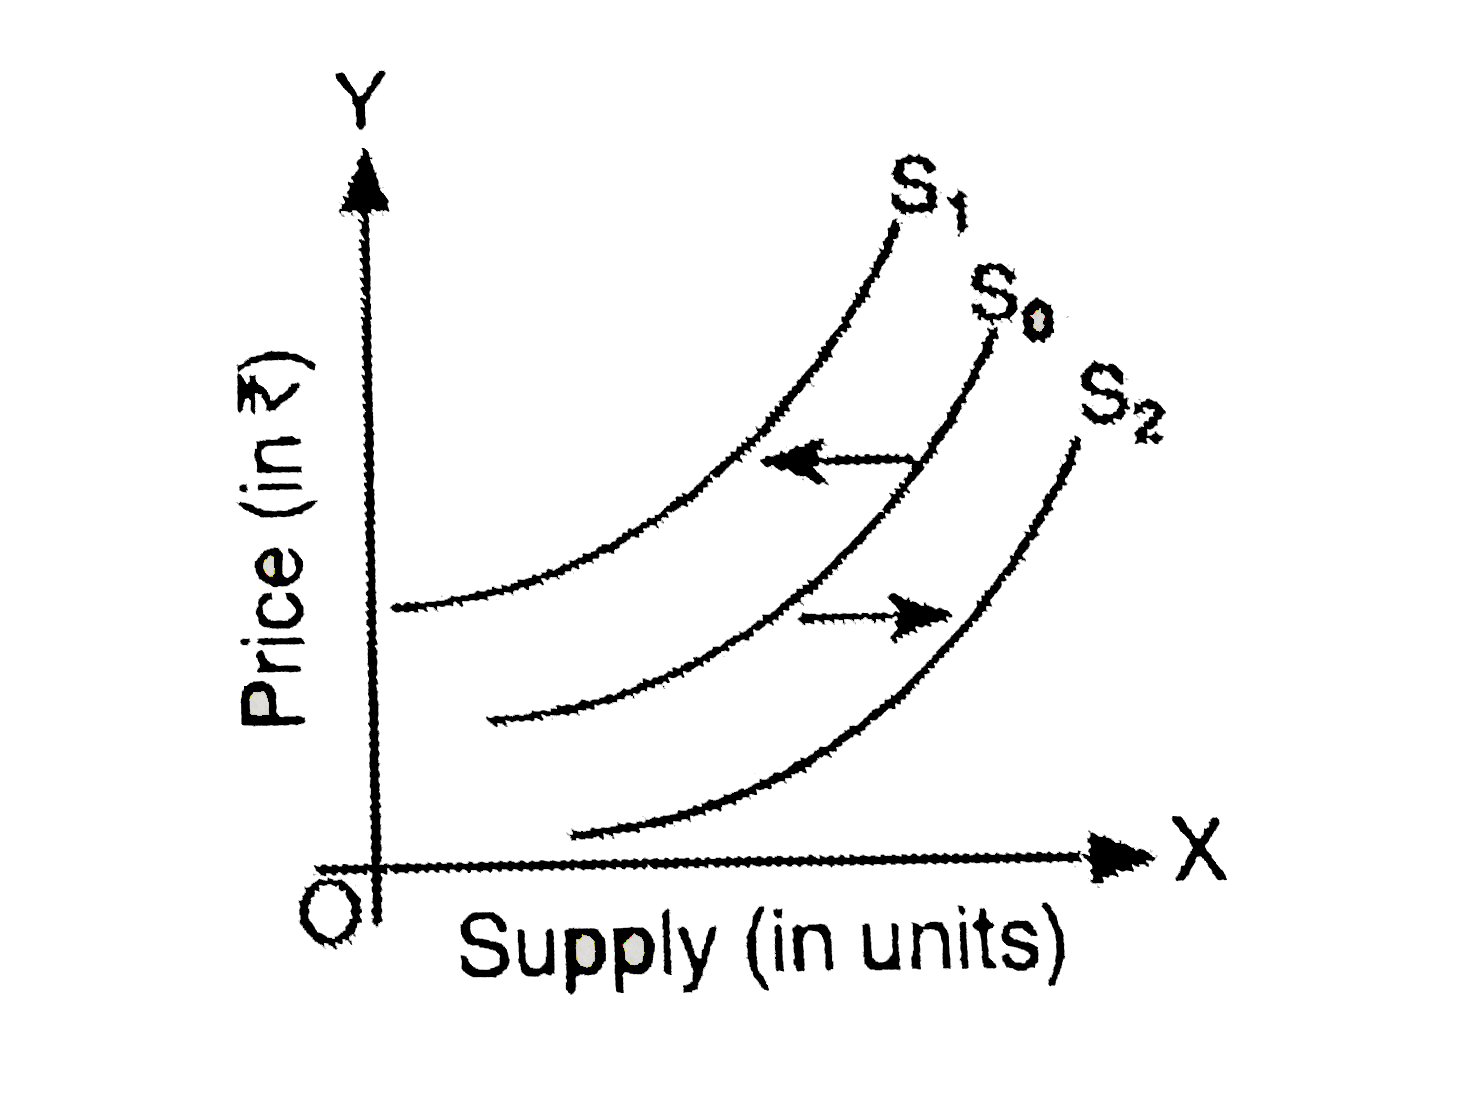
Increases in cost of production of this commodity will lead to :
Movement from S0 to S1
Movement form S0 to S2
Upward movement along the S0
No change at all
The correct Answer is:A
Increase in the cost of production reduces the profit margin of this particular commodity and hence supply falls and there is a movement from So to S1.
Topper's Solved these Questions
- SUPPLY BOOK - SANDEEP GARGCHAPTER - SUPPLY EXERCISE - VERY SHORT ANSWER TYPE QUESTIONS
37 Videos
- SUPPLY BOOK - SANDEEP GARGCHAPTER - SUPPLY EXERCISE - SHORT ANSWER TYPE QUESTIONS
31 Videos
- SUPPLY BOOK - SANDEEP GARGCHAPTER - SUPPLY EXERCISE - GUIDELINES
13 Videos
- REVENUE BOOK - SANDEEP GARGCHAPTER - REVENUE EXERCISE - UNSOLVED PRACTICALS
21 Videos
Similar Questions
Knowledge Check
The supply curve of a given commodity is given to be S0. On the basis of this diagram, answer the following questions:
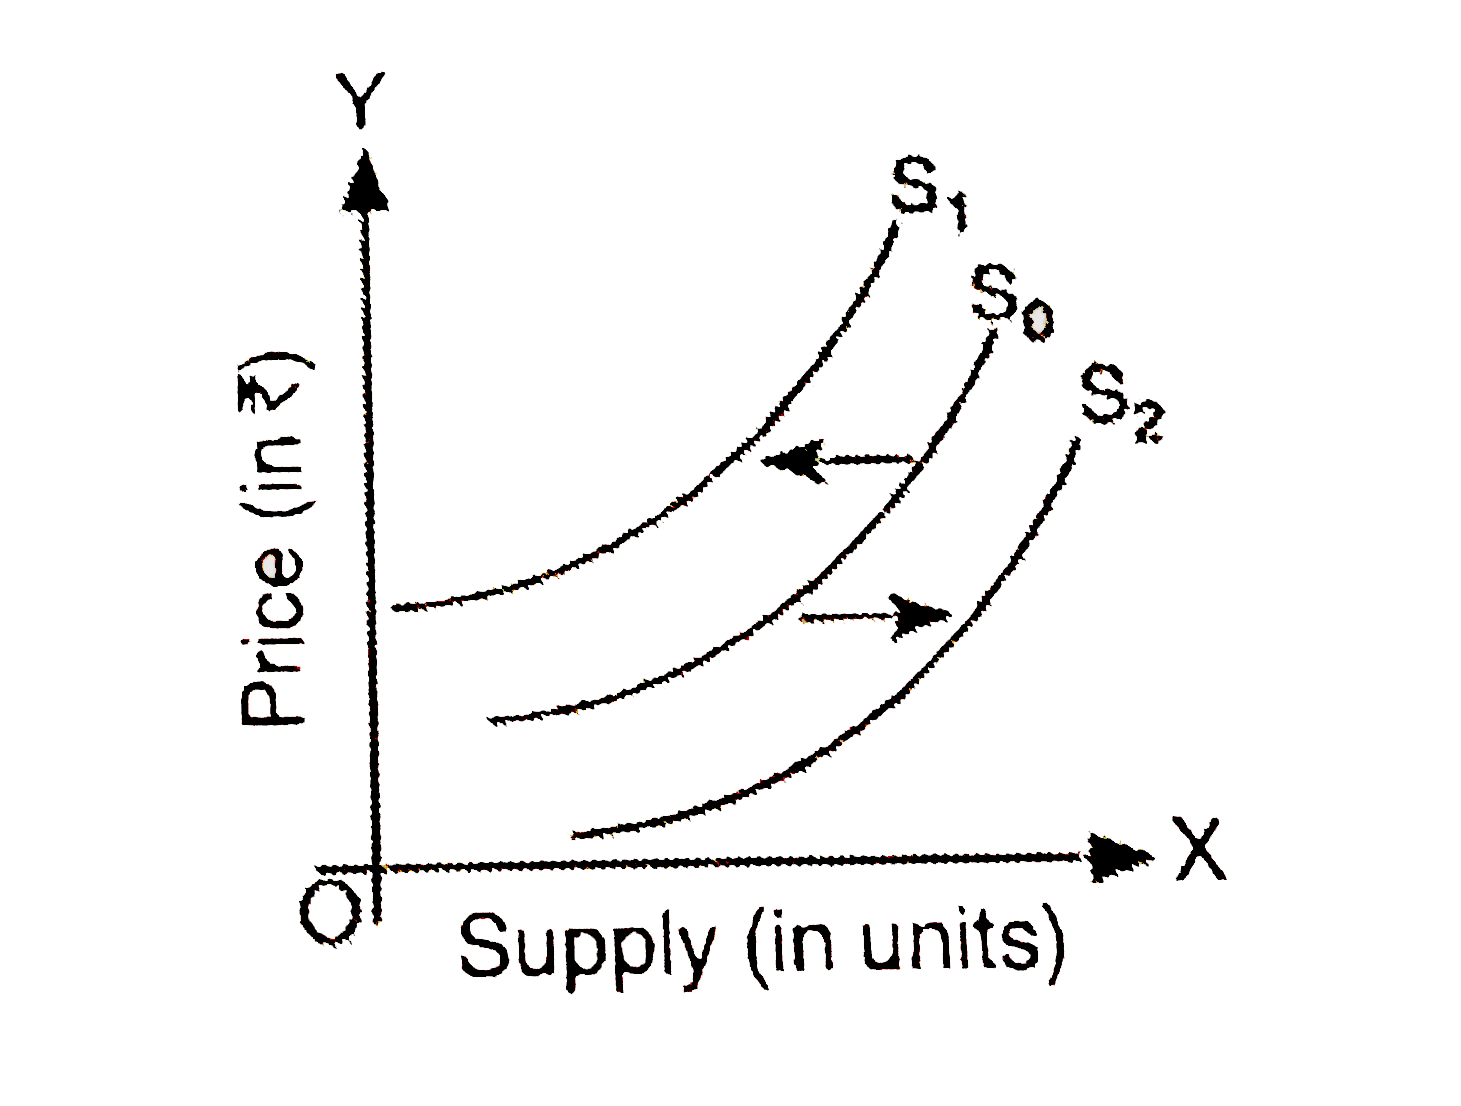
Movement from S0 to S2 is caused by :AIncrease in price of given productBIncrease in the price of the inputsCTechnological UpgradationDDecrease in price of given productThe supply curve of a given commodity is given to be S0. On the basis of this diagram, answer the following questions:
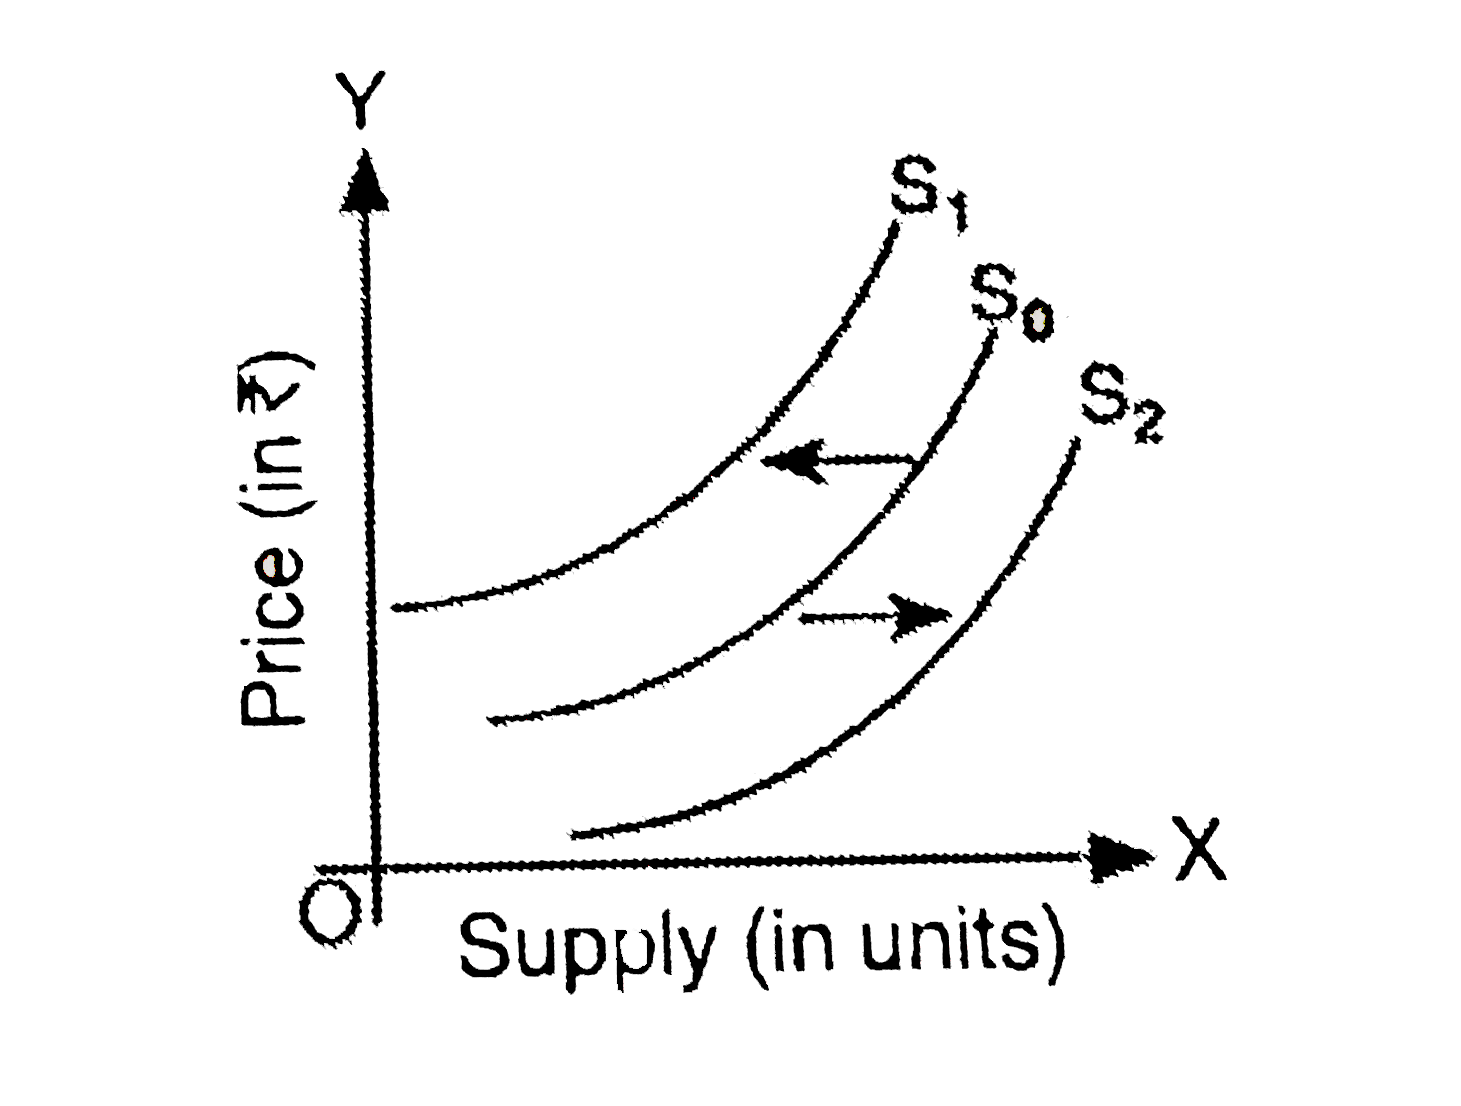
Movement form S0 to S1 is termed as :AConstractin in SupplyBExpansion is SupplyCDecrease is supplyDIncrease in supplyChange in the pirce of the given commodity will lead to :
AExpansion is SupplyBconrtaction in supplyCeither (a) or (b)DNeither (a) and (b)
The table given below depicts the export of a commodity through four ports in the years 1998 and 1999 .
Study the table and answer the questions
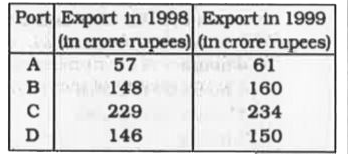
The percentage increase in the export of the commodity from the year 1998 to 1999 was the highest from which port ?
View SolutionThe table given below depicts the export of a commodity through four ports in the years 1998 and 1999 .
Study the table and answer the questions
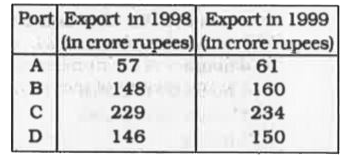
The percentage increase in the export of the commodity from the year 1998 to 1999 was the lowest from which port ?
View SolutionThe table given below depicts the export of a commodity through four ports in the years 1998 and 1999 .
Study the table and answer the questions
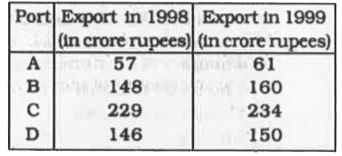
What was the average increase in the export of the commodity from the ports in the year 1999 as compared to the year 1998 ?
View SolutionThe table given below depicts the export of a commodity through four ports in the years 1998 and 1999.
Study the table and answer the questions.

What was the average increase in the export of the commodity from the ports in the year 1999 as compared to the year 1998 ?
View SolutionStudy the following table and answer the questions based on it.The percentage increase in the export of the commodity from the year 1998 to 1999 was the highest from which port?
View Solution

