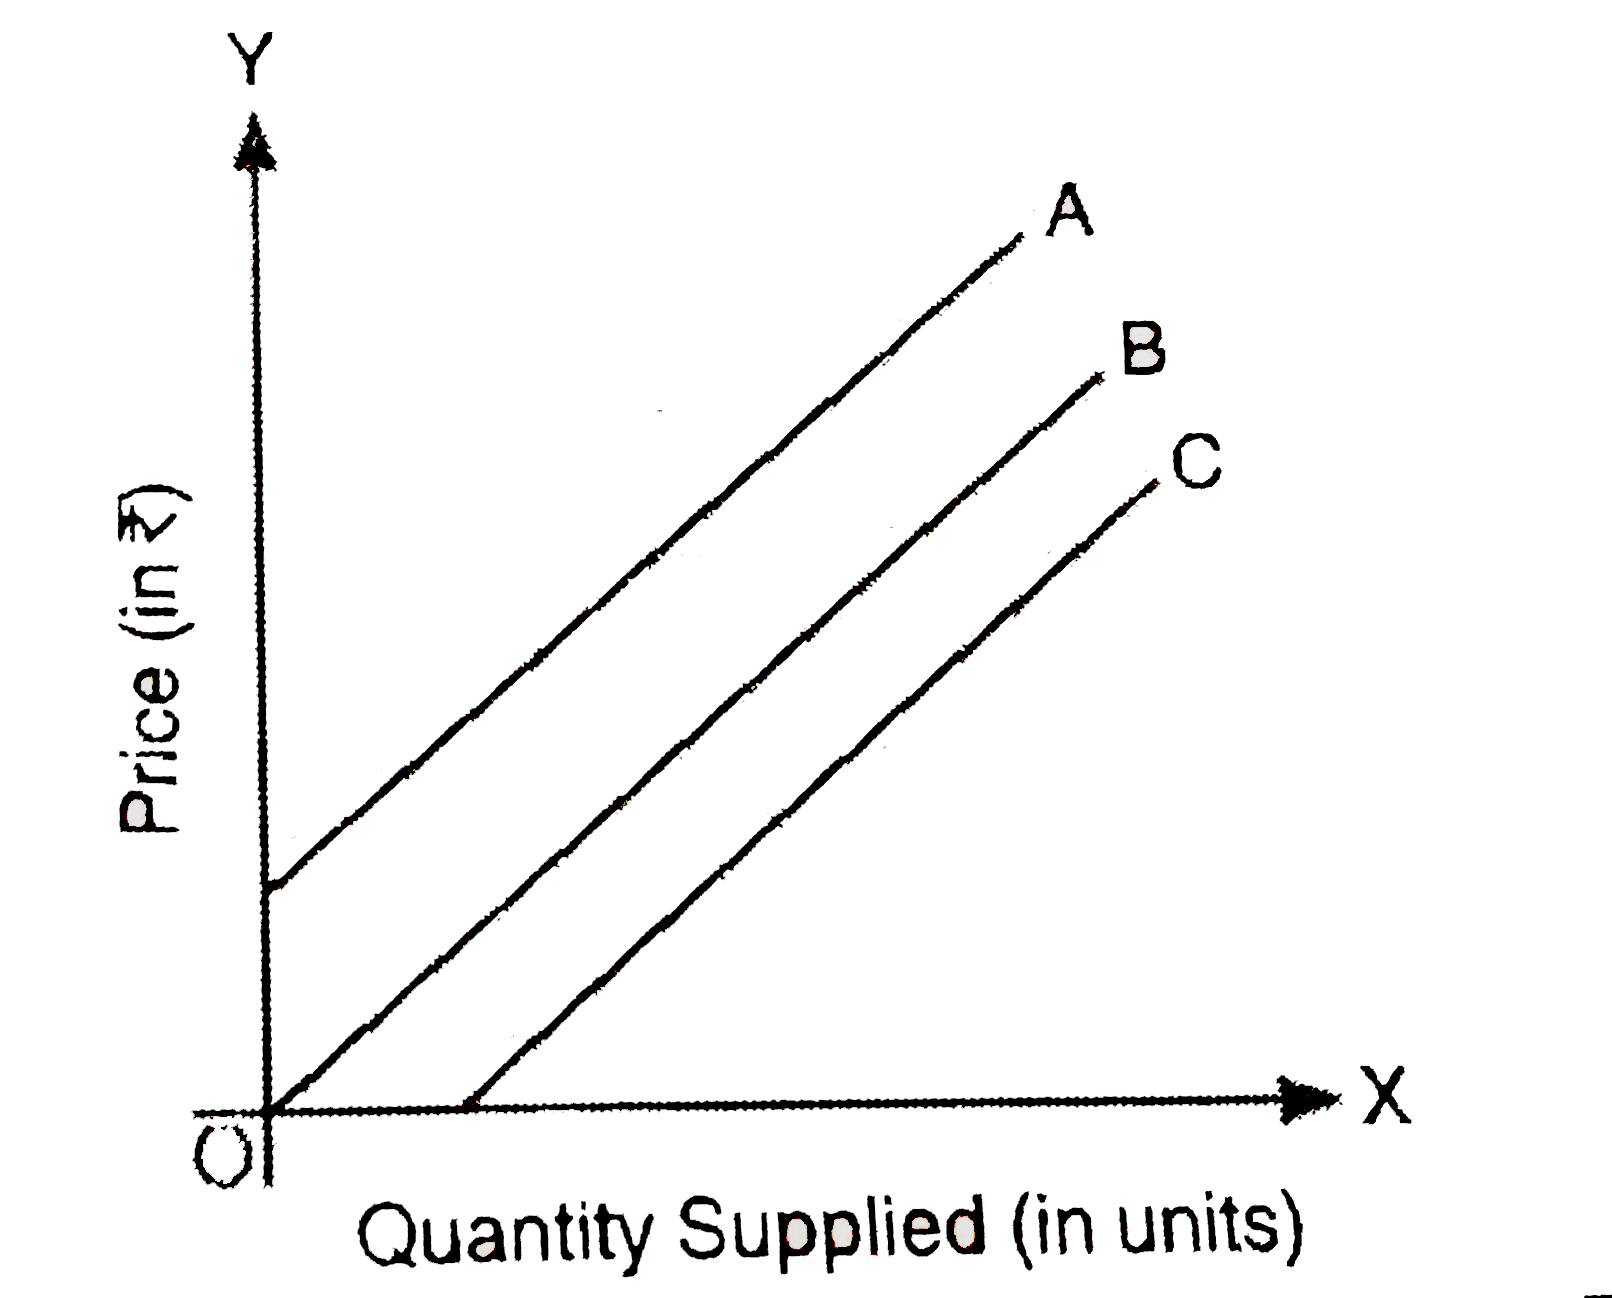
The given diagram is a case of …………….. Supply
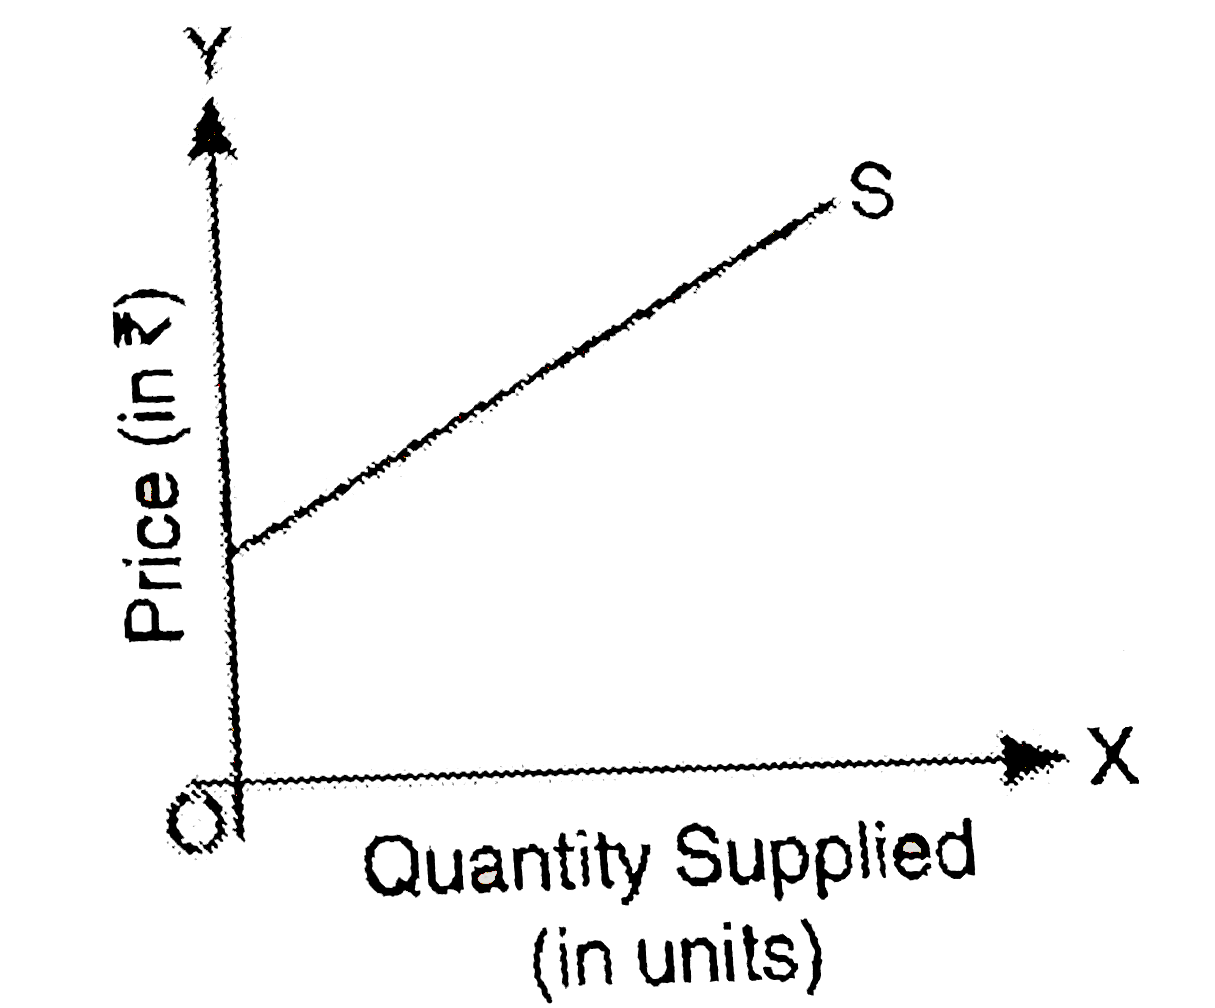
Less Elastic Supply
highly Elastic Supply
Unitary Elastic Supply
Perfectly Elastic Supply
The correct Answer is:B
here, responsiveness of change in quantity demanded due to the change in price is greater than1.
Topper's Solved these Questions
- BOOK - SANDEEP GARGCHAPTER - SUPPLY EXERCISE - VERY SHORT ANSWER TYPE QUESTIONS37videos
SUPPLY
- BOOK - SANDEEP GARGCHAPTER - SUPPLY EXERCISE - SHORT ANSWER TYPE QUESTIONS31videos
SUPPLY
- BOOK - SANDEEP GARGCHAPTER - SUPPLY EXERCISE - GUIDELINES13videos
SUPPLY
- BOOK - SANDEEP GARGCHAPTER - REVENUE EXERCISE - UNSOLVED PRACTICALS21videos
REVENUE
Similar Questions
Knowledge Check
- Question 1 - Select One
Study the given diagram and answer the question given below:
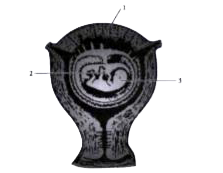
Identify the parts labelled 1, 2 and 3 in the diagram given.A1-Placental villi, 2-Umbilical cord with its vessels, 3-EmbryoB1- Umbilical cord with its vessels, 2 Embryo, 3- Placental villiC1-Embryo, 2- Umbilical cord with its vessels, 3- Placental villiDNone of these - Question 2 - Select One
In the given diagram, which is not related with (A) as indicated in diagram?
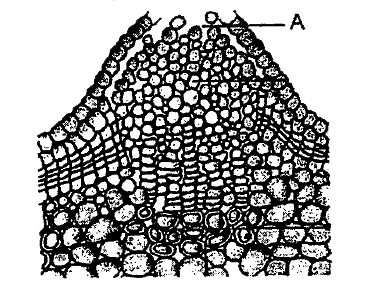 AComplimentary cellsBInvolved in exchange of gasesCLens shaped opening called lenticelsDFound in herbaceous trees
The given diagram represents a nephron and its blood supply. Study the diagram and answer the question :
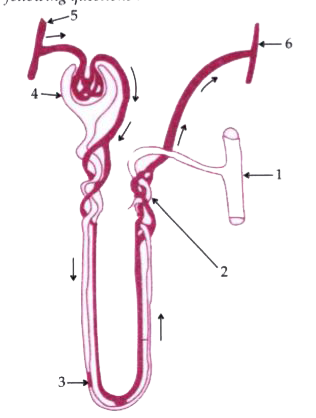
Name the blood vessel which contains the least amount of urea in this diagram.View SolutionThe given diagram represents a nephron and its blood supply. Study the diagram and answer the question :
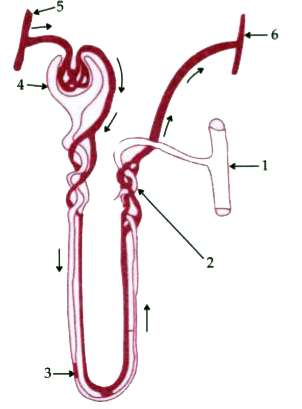
Label parts 1, 2, 3 and 4.View SolutionThe given diagram represents a nephron and its blood supply. Study the diagram and answer the question :
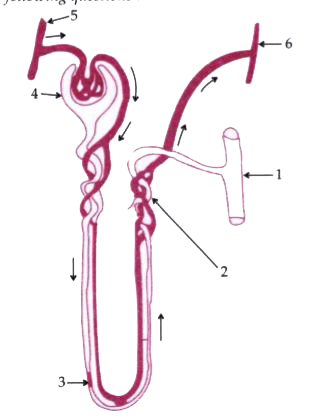
State the reason for the high hydrostatic pressure in the glomerulus.View SolutionThe given diagram represents a nephron and its blood supply. Study the diagram and answer the question :
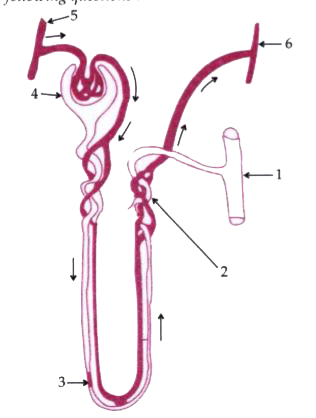
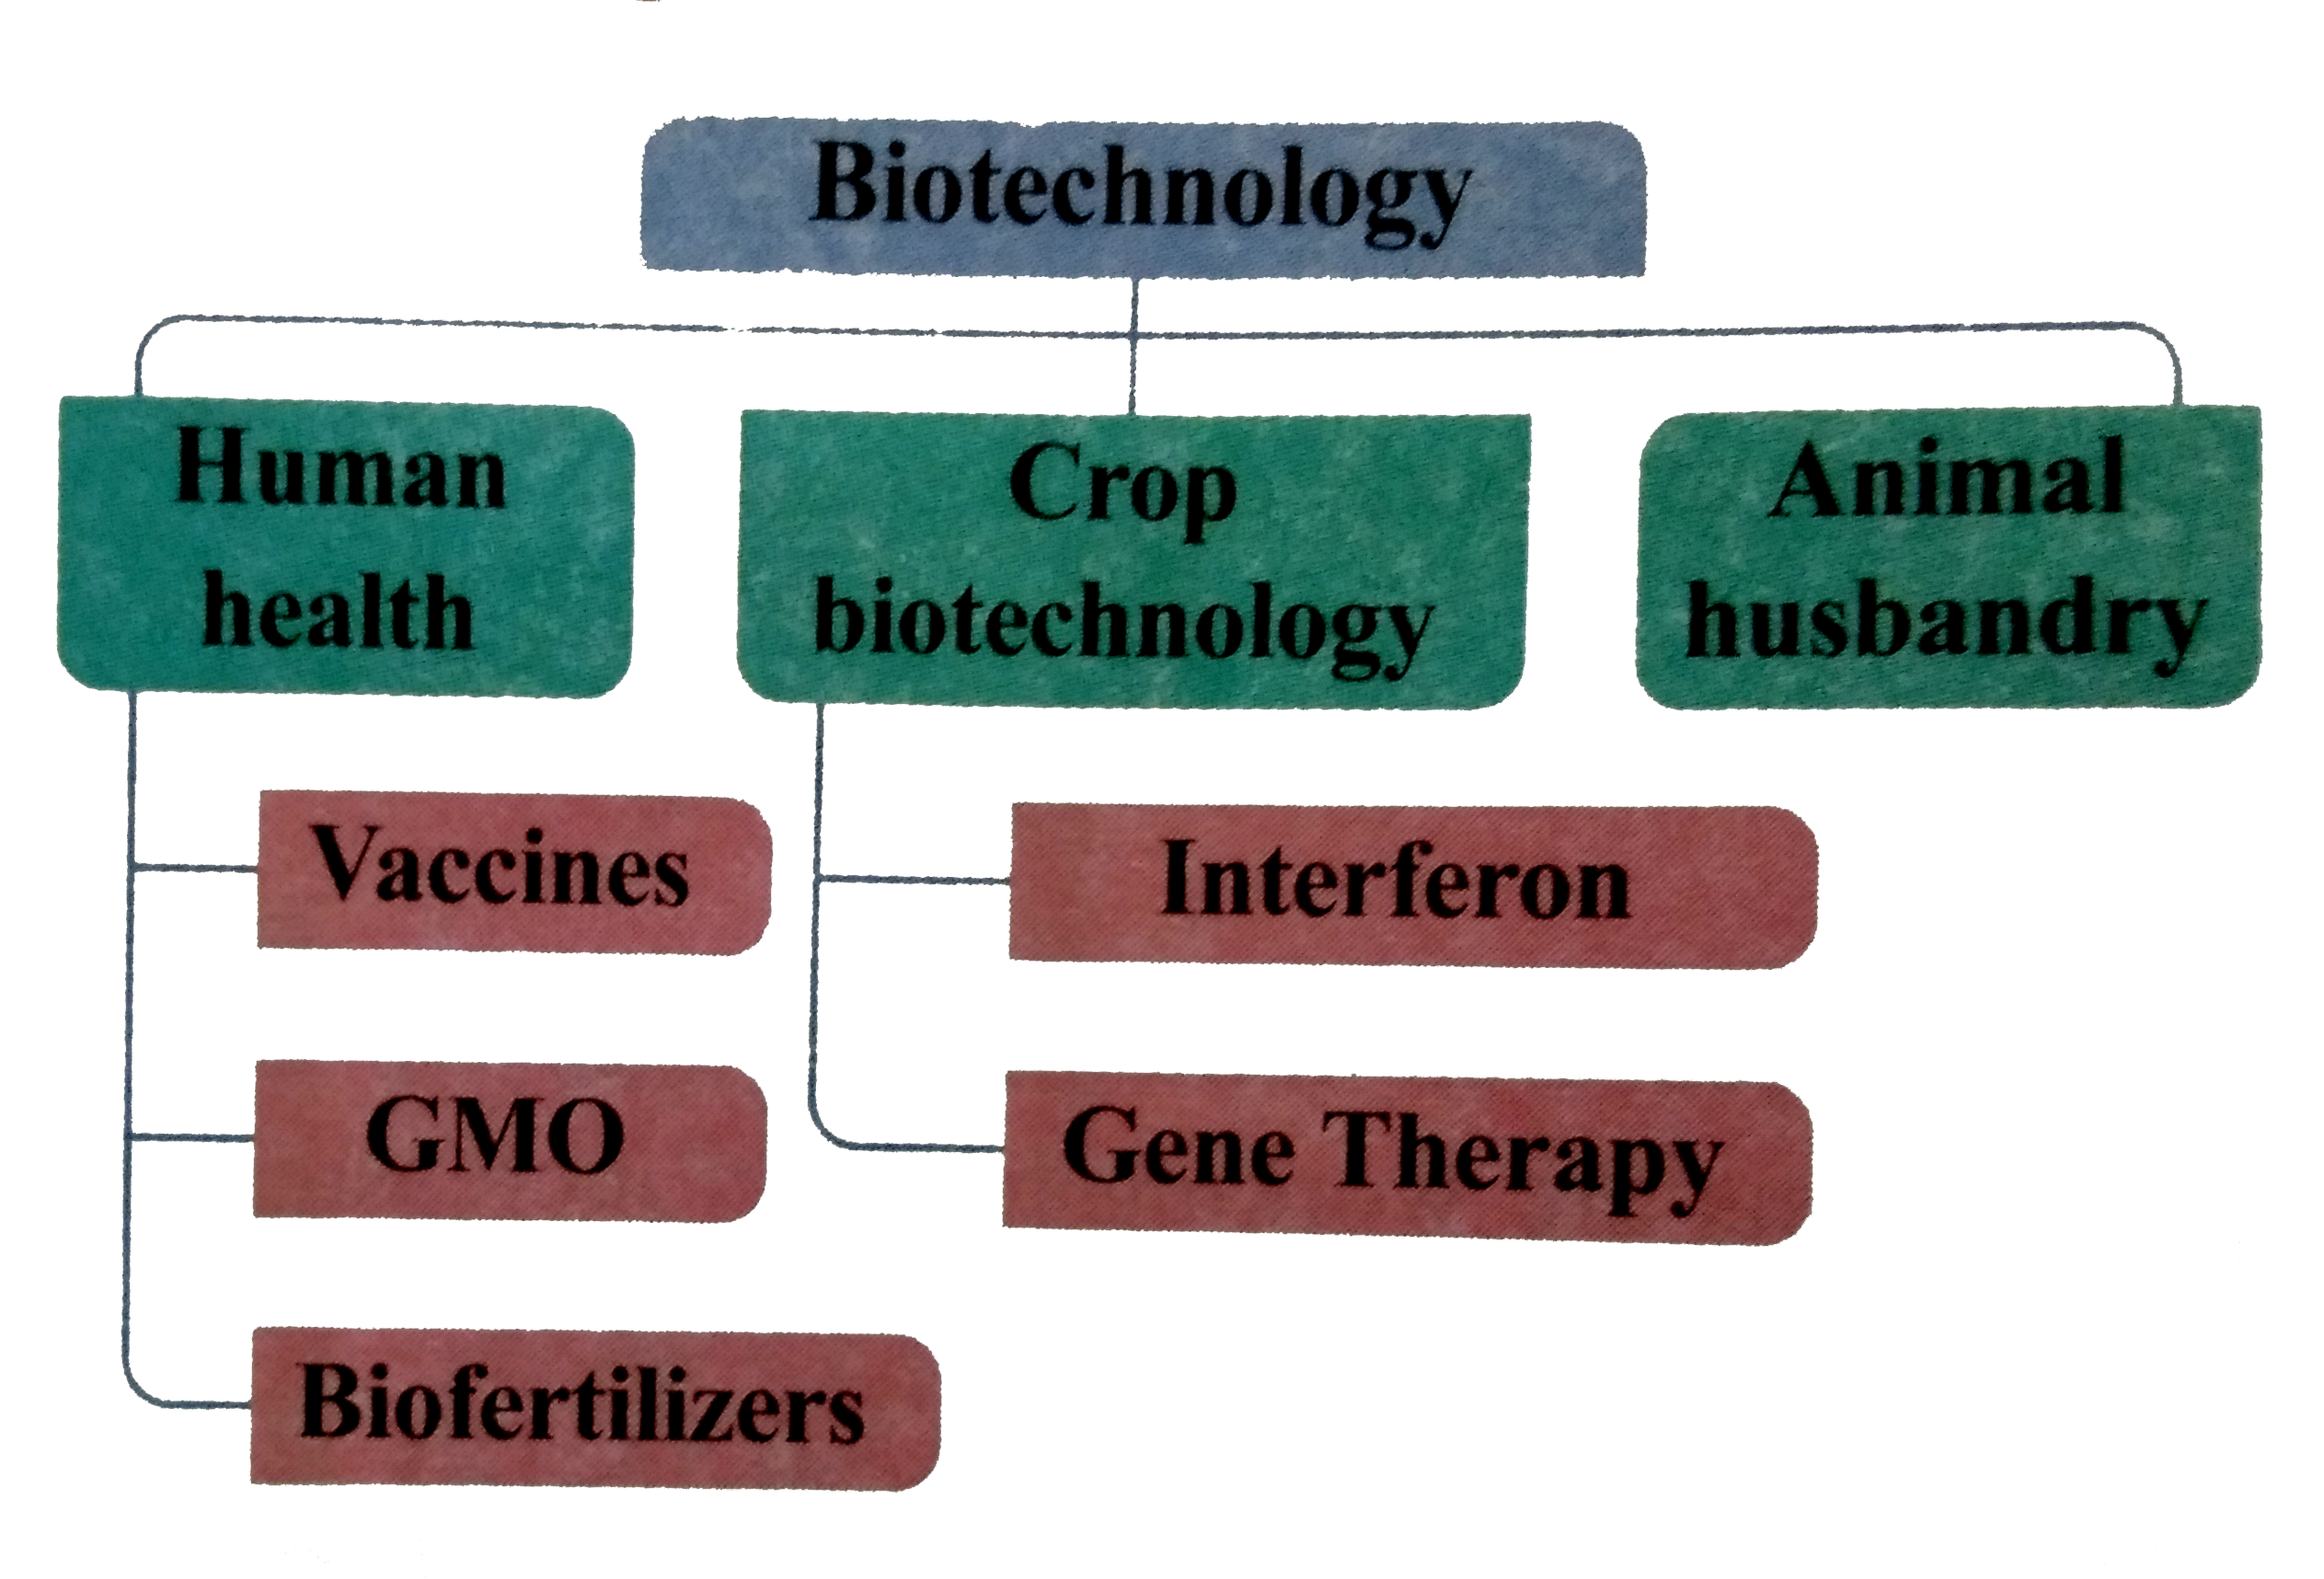
Name the part of the nephron which lies in the renal medulla.View SolutionThe given diagram below is not correct. Correct the diagram with explanations ?
 View Solution
The following diagram shows the suppluy curve of three commodities : A , B and C . Rank their price elasticity of supply
 View Solution


