A toy company manufactures two types of dolls, A and B. Market tests and available resources have indicated that the combined production level should not exceed 1200 dolls per week and the demand for dolls of type B is at most half of that for dolls of type A. Further, the production level of dolls of type A can exceed three times the production of dolls of other type by at most 600 units. If the company makes profit of Rs 12 and Rs 16 per doll respectively on dolls A and B. how many of each should be produced weekly in order to maximise the profit?
To solve the problem of maximizing the profit for the toy company that manufactures two types of dolls, A and B, we can follow these steps:
Step 1: Define the Variables
Let:
- x = number of dolls of type A produced per week
- y = number of dolls of type B produced per week
Step 2: Formulate the Constraints
From the problem statement, we have the following constraints:
1. The combined production level should not exceed 1200 dolls:
x+y≤1200
2. The demand for dolls of type B is at most half of that for dolls of type A:
y≤x2or equivalently2y≤x
3. The production level of dolls of type A can exceed three times the production of dolls of type B by at most 600 units:
x−3y≤600
Step 3: Set the Objective Function
The profit from dolls A and B is given as:
- Profit from A = Rs 12 per doll
- Profit from B = Rs 16 per doll
Thus, the objective function to maximize profit Z is:
Z=12x+16y
Step 4: Identify the Feasible Region
We will graph the constraints to find the feasible region.
1. Graph the constraint x+y=1200:
- If x=0, then y=1200 (point A: (0, 1200))
- If y=0, then x=1200 (point B: (1200, 0))
2. Graph the constraint 2y=x:
- If x=0, then y=0 (point C: (0, 0))
- If y=0, then x=0 (point D: (0, 0))
- If y=600, then x=1200 (point E: (1200, 600))
3. Graph the constraint x−3y=600:
- If y=0, then x=600 (point F: (600, 0))
- If x=0, then y=−200 (not feasible)
Step 5: Find the Intersection Points
To find the vertices of the feasible region, we need to calculate the intersection points of the lines:
1. Intersection of x+y=1200 and x−3y=600:
x+y=1200(1)
x−3y=600(2)
From (1), y=1200−x. Substitute into (2):
x−3(1200−x)=600
x−3600+3x=600
4x=4200⇒x=1050
Substitute x back into (1):
1050+y=1200⇒y=150
So, one vertex is (1050,150).
2. Intersection of x+y=1200 and 2y=x:
Substitute x=2y into x+y=1200:
2y+y=1200⇒3y=1200⇒y=400
Then x=2(400)=800.
So, another vertex is (800,400).
Step 6: Evaluate the Objective Function at Each Vertex
Now we evaluate Z=12x+16y at each vertex:
1. At (0,1200):
Z=12(0)+16(1200)=19200
2. At (600,0):
Z=12(600)+16(0)=7200
3. At (1050,150):
Z=12(1050)+16(150)=12600+2400=15000
4. At (800,400):
Z=12(800)+16(400)=9600+6400=16000
Step 7: Determine the Maximum Profit
The maximum profit occurs at the vertex (800,400) with:
Z=16000
Conclusion
To maximize profit, the company should produce:
- 800 dolls of type A
- 400 dolls of type B
Let:
- x = number of dolls of type A produced per week
- y = number of dolls of type B produced per week
From the problem statement, we have the following constraints:
1. The combined production level should not exceed 1200 dolls:
x+y≤1200
2. The demand for dolls of type B is at most half of that for dolls of type A:
y≤x2or equivalently2y≤x
3. The production level of dolls of type A can exceed three times the production of dolls of type B by at most 600 units:
x−3y≤600
The profit from dolls A and B is given as:
- Profit from A = Rs 12 per doll
- Profit from B = Rs 16 per doll
Z=12x+16y
We will graph the constraints to find the feasible region.
- If x=0, then y=1200 (point A: (0, 1200))
- If y=0, then x=1200 (point B: (1200, 0))
- If x=0, then y=0 (point C: (0, 0))
- If y=0, then x=0 (point D: (0, 0))
- If y=600, then x=1200 (point E: (1200, 600))
- If y=0, then x=600 (point F: (600, 0))
- If x=0, then y=−200 (not feasible)
To find the vertices of the feasible region, we need to calculate the intersection points of the lines:
x+y=1200(1)
x−3y=600(2)
From (1), y=1200−x. Substitute into (2):
x−3(1200−x)=600
x−3600+3x=600
4x=4200⇒x=1050
Substitute x back into (1):
1050+y=1200⇒y=150
So, one vertex is (1050,150).
Substitute x=2y into x+y=1200:
2y+y=1200⇒3y=1200⇒y=400
Then x=2(400)=800.
So, another vertex is (800,400).
Now we evaluate Z=12x+16y at each vertex:
Z=12(0)+16(1200)=19200
2. At (600,0):
Z=12(600)+16(0)=7200
3. At (1050,150):
Z=12(1050)+16(150)=12600+2400=15000
4. At (800,400):
Z=12(800)+16(400)=9600+6400=16000
The maximum profit occurs at the vertex (800,400) with:
Z=16000
To maximize profit, the company should produce:
- 800 dolls of type A
- 400 dolls of type B
Similar Questions
A toy company manufactures two types of dolls A and B. Market research and available resources have indicated that the combined production level should not exceed 1200 dolls per week and the demand for dolls of type B is at most half of that for dolls of type A. Further the production level of dolls of type A can exceed three times the production of dolls of other type by at most 600 units. If the company makes profit of Rs. 12 and Rs. 16 per doll respectively on dolls A and B how many of each should be produced weekly in order to maximise the profit?
View SolutionA toy company manufacutes two types of dolls, A and B. Each doll of type B takes twice as long to produce as one of type. A and the company would have time to make a maxium of 2000 prr day, if it produces only type.A the supply of plastic is sufficient to produce 1500 dolls per day (both A and B combined). Type B requires a fancy dress of which there are only 600 per day available. If the company makes profits of Rs.3 and Rs5 per doll respectively on dolls A and B, how many of each should be produced per day in order to mazimize the profit? Also, find the maximum profit.
View Solution
Knowledge Check
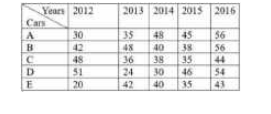
The table shows the production of different types of cars (in thousands).
यह तालिका अलग-अलग प्रकार के कारों का उत्पादन ( हज़ार में) दर्शाती है | The number of years, in which the production of cars of type B is less than the average production of type D cars over the years is:
कितने वर्ष B प्रकार की कारों का उत्पादन इन वर्षों के दौरान D प्रकार की कारों के औसत उत्पादन से कम रहा है ?A4B1C3D2Toothpaste is a product of which type of market form
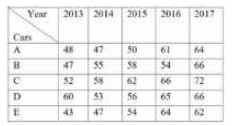
AMonopolist CompetitionBMonopolyCOligopolyDPerfect CompetitionThe table shows the production of different types of cars (in thousands).
यह तालिका एक कंपनी द्वारा अलग-अलग कारों के उत्पादन ( हज़ार में ) को दर्शाती है | The ratio of the total production of type A cars in 2017 and type D cars in 2015 to the total production of type B and type E cars in 2013 is:
2017 में A प्रकार तथा 2015 में प्रकार की कारों के कुल उत्पादन का 2013 में B और E प्रकार की कारों के कुल उत्पादन के साथ अनुपात ज्ञात करें |A8:7B4:3C3:4D7:8
A toy company manufactures two types of doll; a basic version doll; a basic version doll A and a deluxe version doll B. Each doll of type B takes twice as long to produce as one of type. A and the company would have time to ,make a maximum of 2, 000 per day if it produces only the basic version. The supply of plastic is sufficient to produce 1500 dolls per day (both A and B combined). The deluxe version requires a fancy dress of which there are only 600 per day available. If the company makes profit Rs. 3 and Rs. 5 per doll respectively o doll A and doll B; how many of each should be produced per day in order to maximize profit?
View SolutionIf 17 dolls cosr Rs306 , what do 29 dolls cost?
View SolutionA company manufactures two types of sweaters :type A sweaters type B.It costs Rs 360 to make a type A sweater and Rs 120 to make a type B sweater.The company can make at most 300 sweaters and spend at most Rs72,000 a day.The number of sweaters of type A cannot exceed the number of sweaters of type B by more than 100.The company makes a profit of Rs 200 for each sweater of type A and Rs 20 for every sweater of type B.What is the maximum profit (in Rs.)?
View SolutionA company manufacutres two types of sweaters type A and type B. It costs 360 to make type A sweater and 120 to make a type B sweater. The company can make atmost 300 sweater and spent atmost 72000 a day. The number of sweaters of type B cannot exceed the number of sweaters of type A by more than 100. The company makes a profit of 200 for each sweater of type A and 120 for every sweater of type B. Formulate this problem as a LPP to maximise the profit to the company.
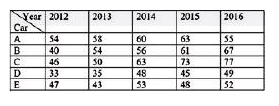
View SolutionThe table shows the production of different types of cars (in thousands)

The total production of all types of cars , except type B, in 2012 is what percent less than the total production of all types of cars in 2016?
View Solution
