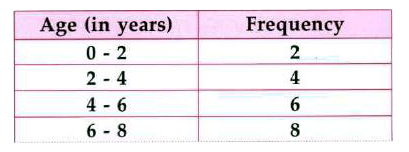
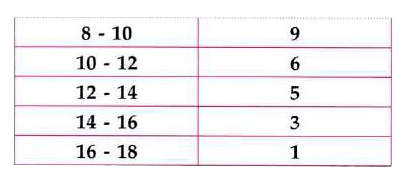
Draw a frequency polygon to represent the following data.

Step by step video & image solution for Draw a frequency polygon to represent the following data. by Maths experts to help you in doubts & scoring excellent marks in Class 10 exams.
Topper's Solved these Questions
- BOOK - TARGET PUBLICATIONCHAPTER - STATISTICSEXERCISE - Try this2videos
STATISTICS
- BOOK - TARGET PUBLICATIONCHAPTER - STATISTICSEXERCISE - Multiple Choice Questions14videos
STATISTICS
- BOOK - TARGET PUBLICATIONCHAPTER - SIMILARITY EXERCISE - Chapter Assessment19videos
SIMILARITY
- BOOK - TARGET PUBLICATIONCHAPTER - TRIGONOMETRY EXERCISE - Chapter Assessment18videos
TRIGONOMETRY
Similar Questions
Draw the frequency polygon to represent the following data.
 View Solution
Draw the frequency polygon representing the following frequency distribution
 View Solution
Construct a frequency polygon for the following data.

 View Solution
Draw a histogram and frequency polygen to represent the following frequency distribution :
View SolutionDraw a frequency polygon from the following data by using (i) histogram , and (ii) without using histogram :
 View Solution
Draw a frequency polygon from the following data, giving the age of doctors working in C.G.H.S. in a city.
 View Solution
Draw the frequency polygon for the following data by drawing a histogram:
Class Intervalf 0−510 5−1020 10−1515 15−2030 20−2532 25−3044View SolutionPrepare histogram and frequency polygon from the following data :
 View Solution
Represent the following data by histogram:
 View Solution
The daily pocket expenses of 206 students in a school are given below.

Construct a frequency polygon representing the above data.View Solution

