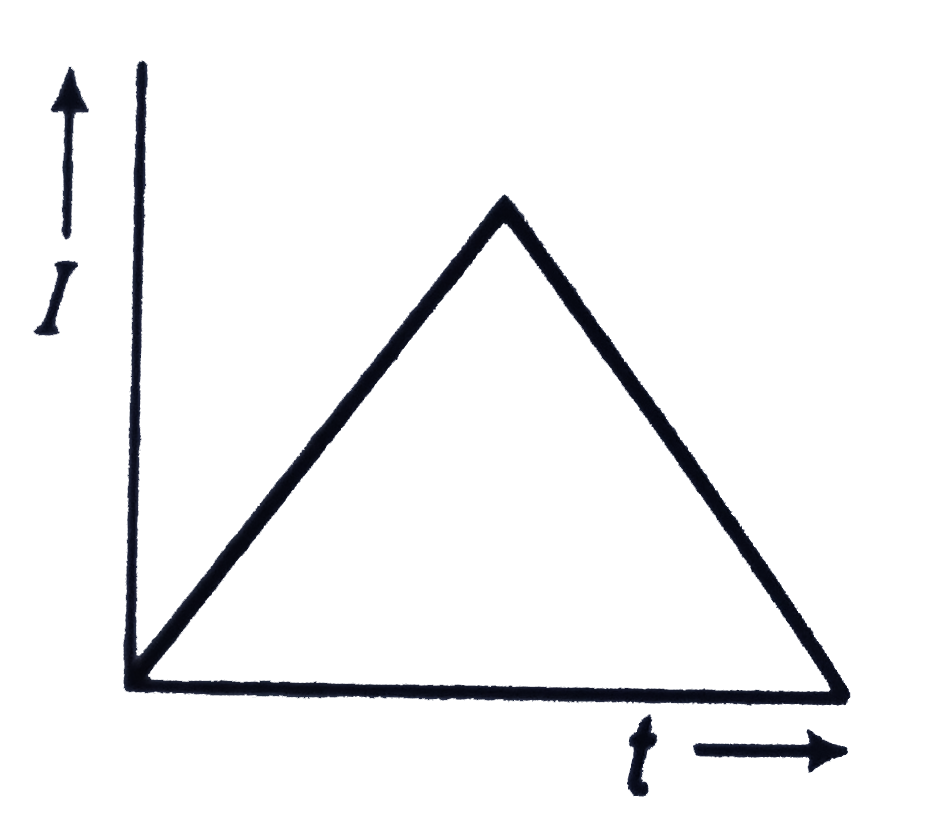
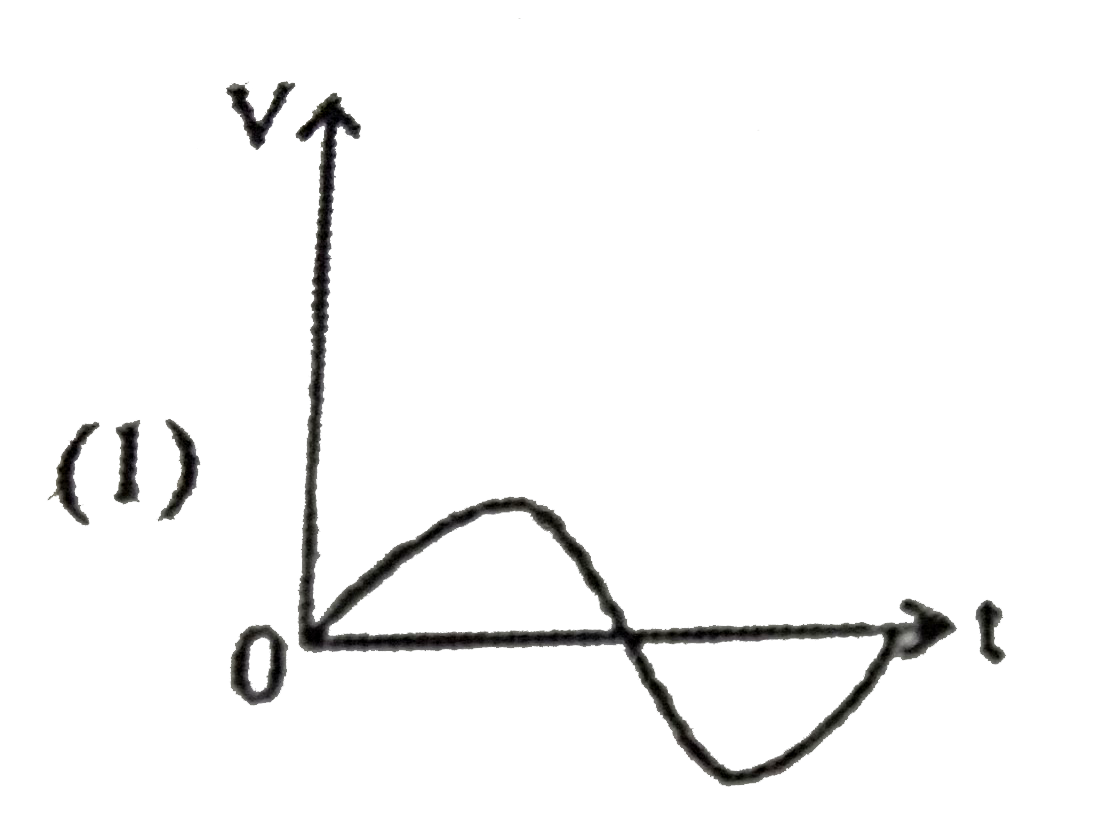
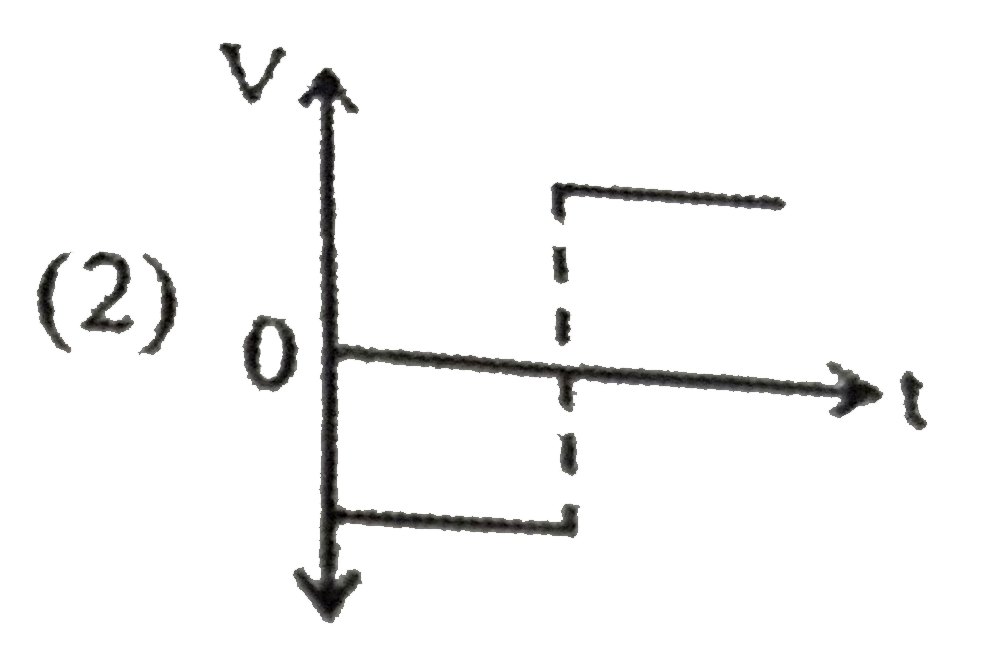
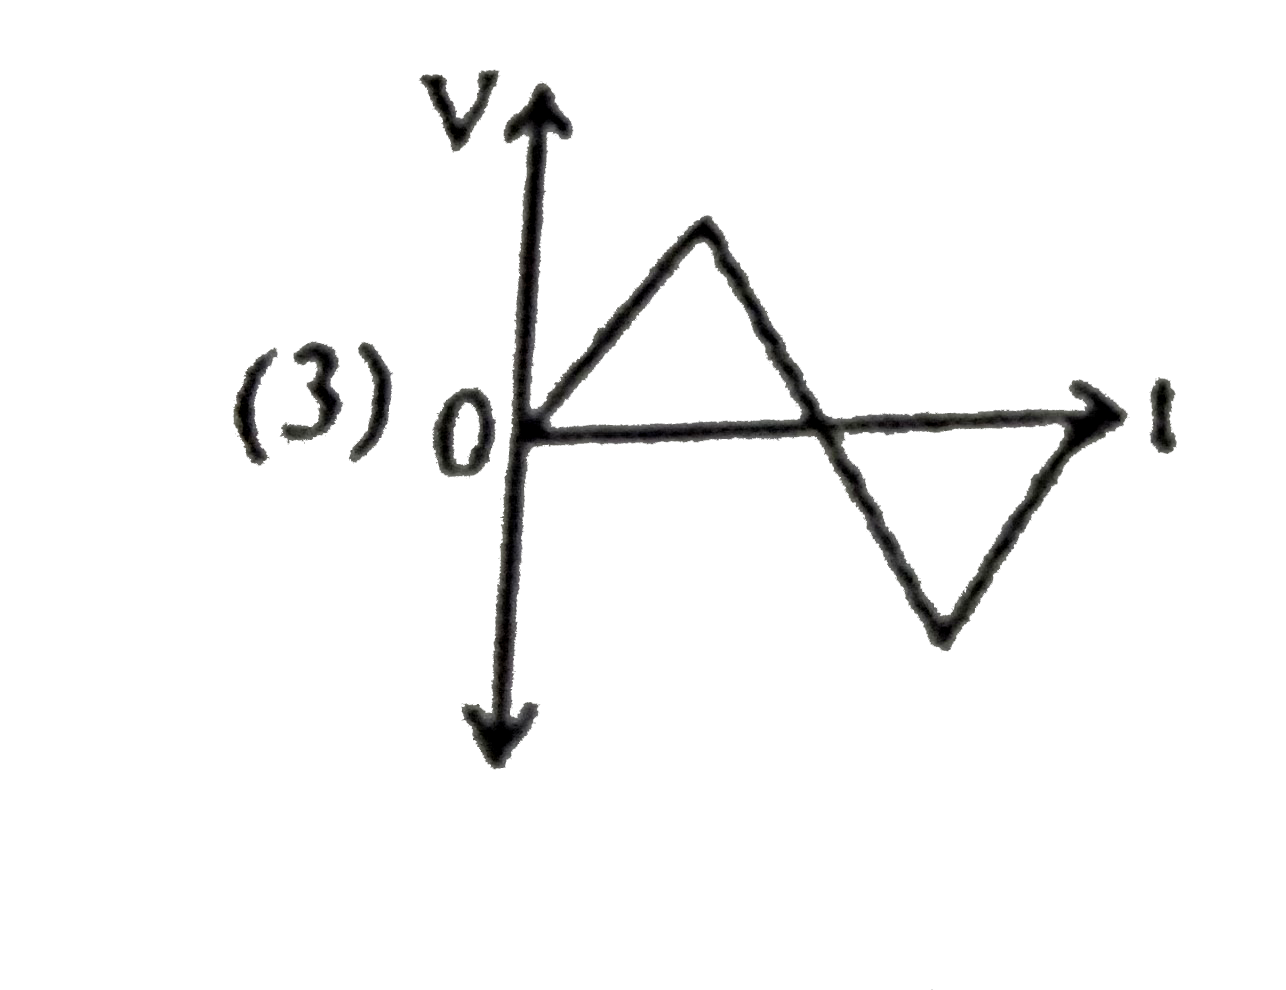
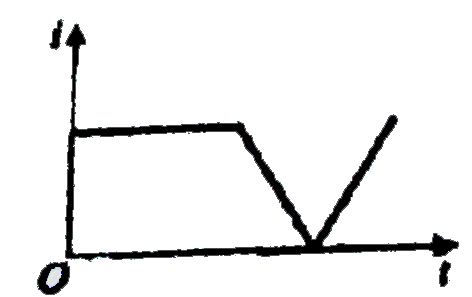
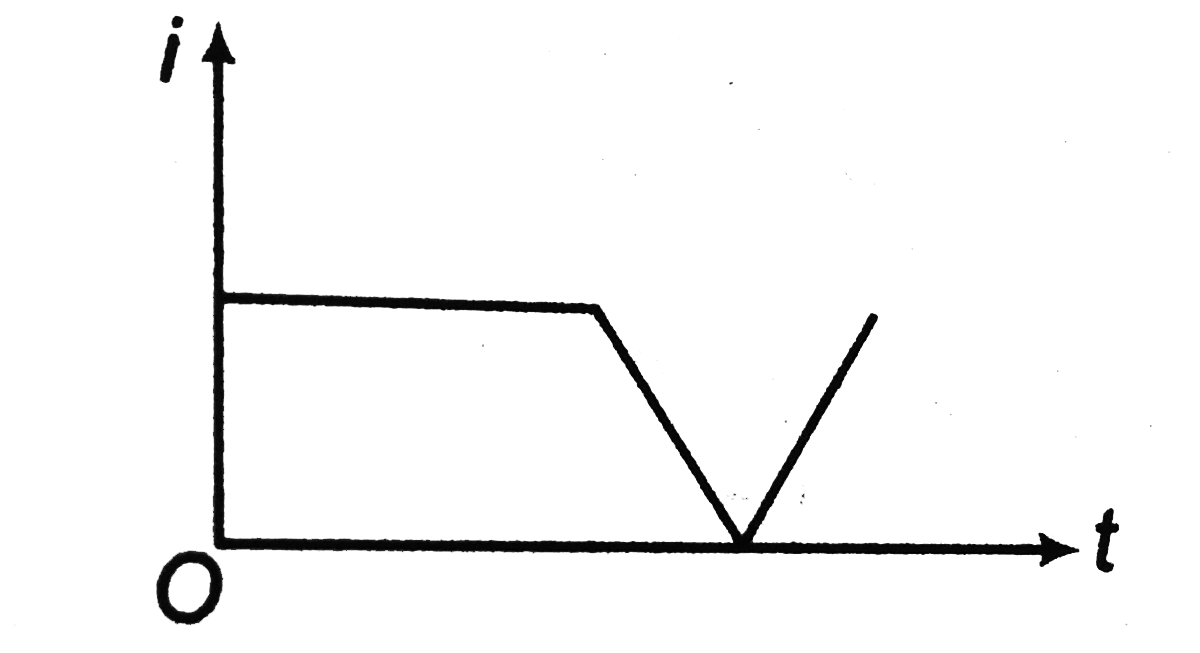
An alternating current I in an inductance coil varies with time t according to the graph as shown: Which one of the following graph gives the variation of voltage with time?
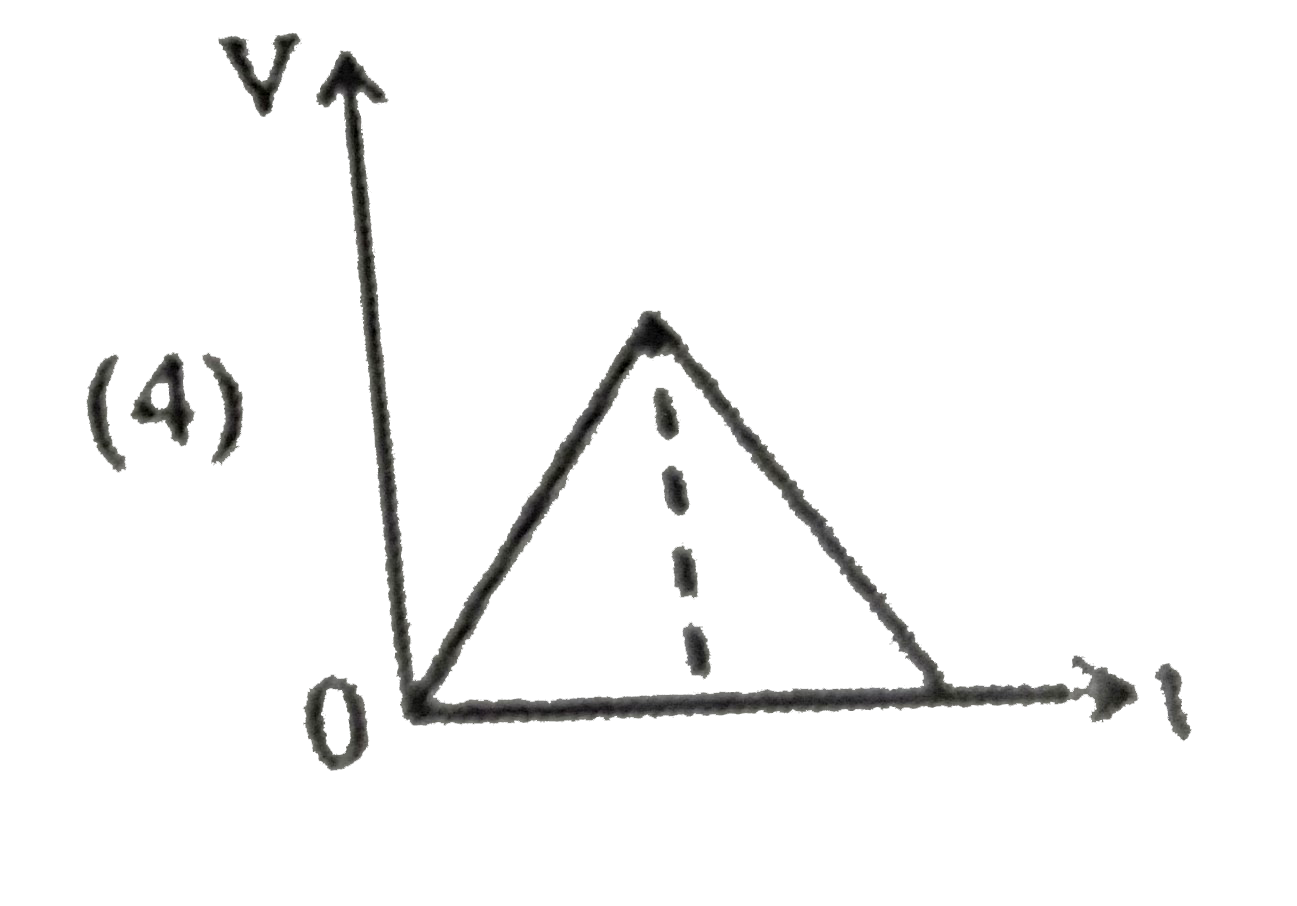
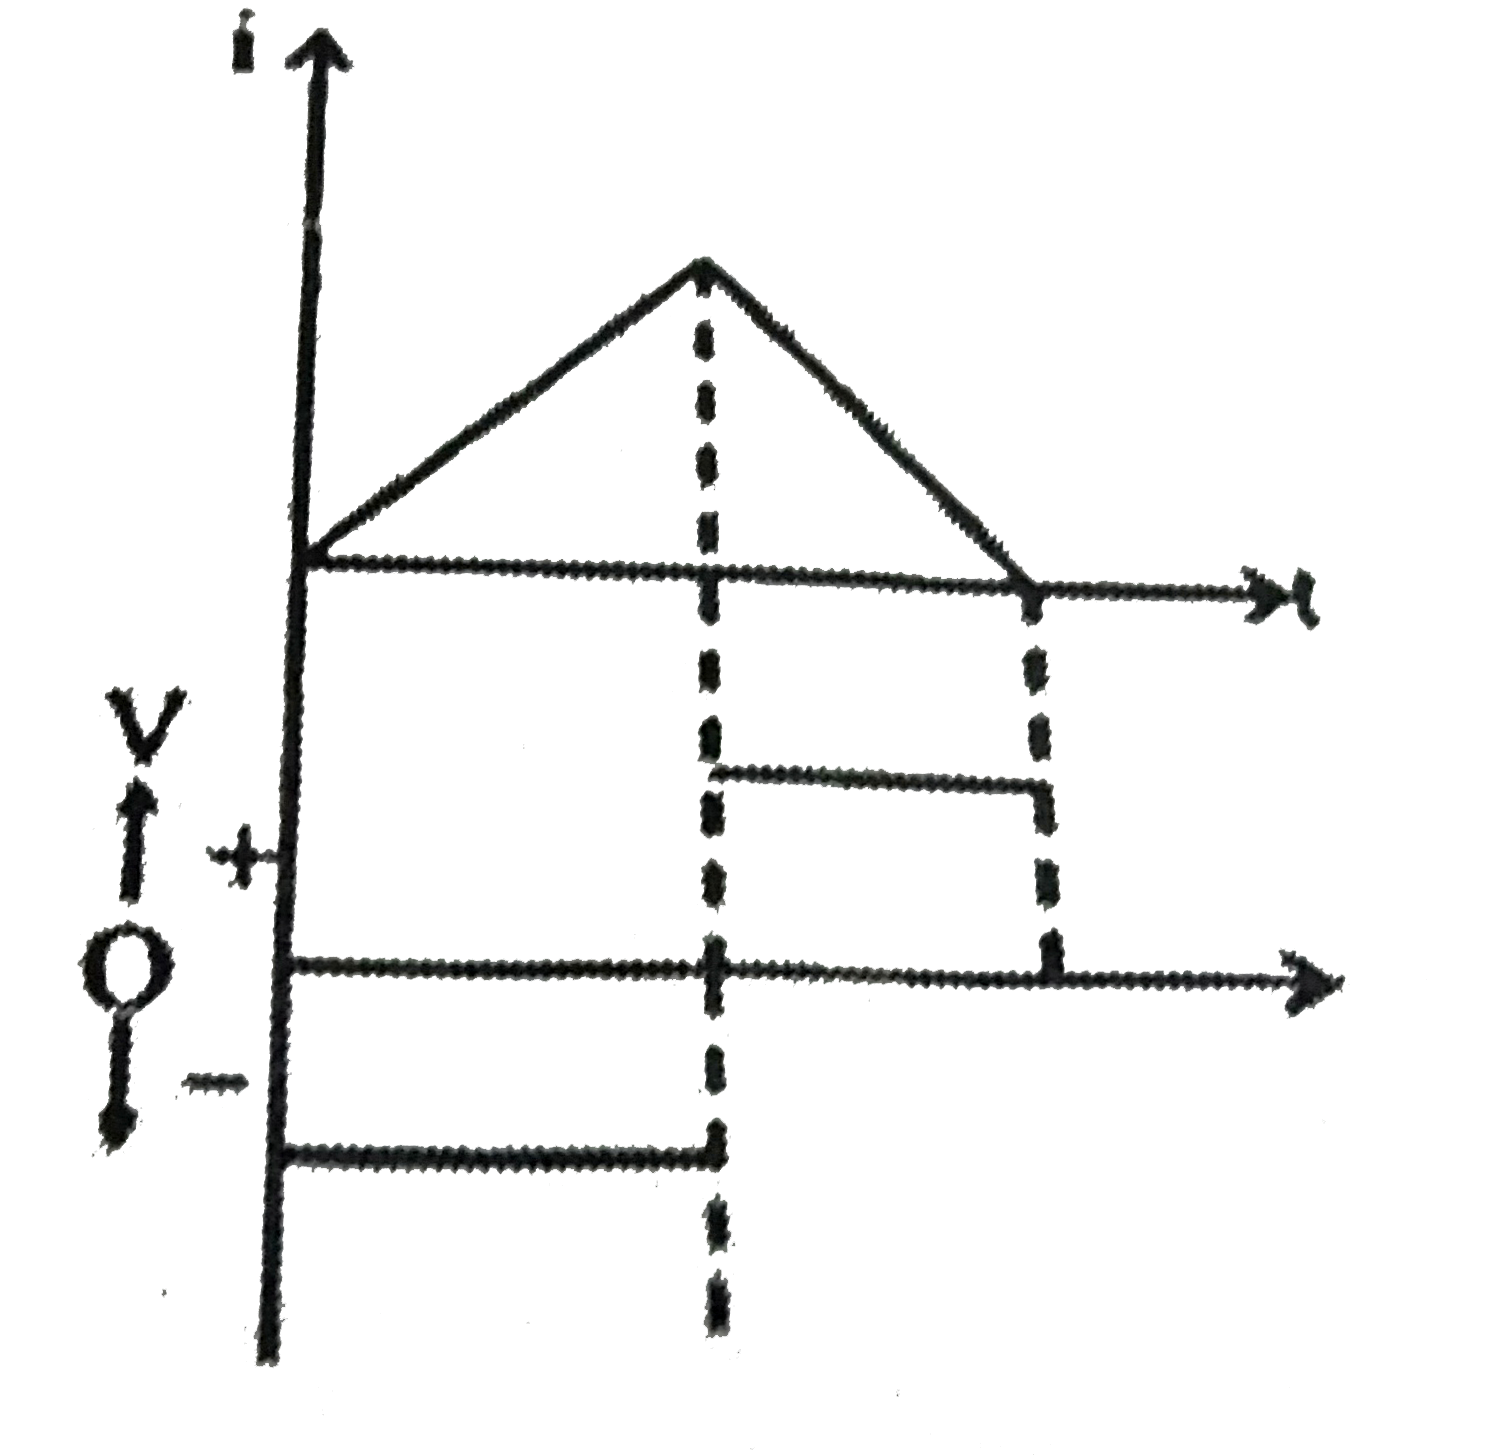
The correct Answer is:B
v=−Ldidt
from graph we can see that didt= constant but its value is initally negative & then it become positive
∴ in graph V forst remain negative and them become positive.
Topper's Solved these Questions
Similar Questions
The current (I) in the inductance is varying with time according to the plot shown in figure.
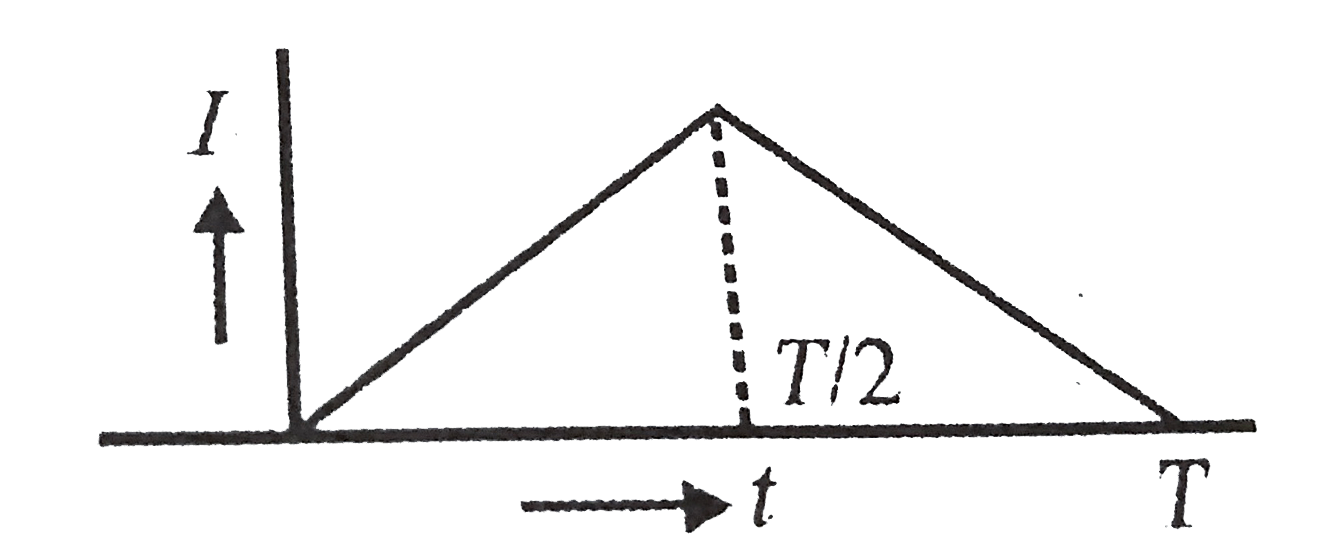
Which one of the following is the correct variation of voltage with time in the coil?
View SolutionThe current i in an induction coil varies with time t according to the graph
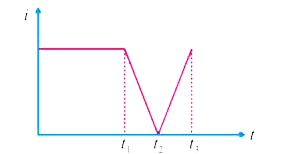
Draw the graph of induced e.m.f. with time.
View Solution
Knowledge Check
The current I in an inductance coil varies with time according to the graph given in the figure.
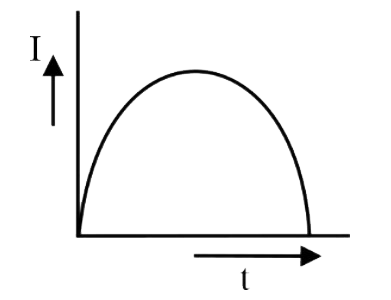
Which one of the following graphs gives the variation of voltage with time across the inductor?A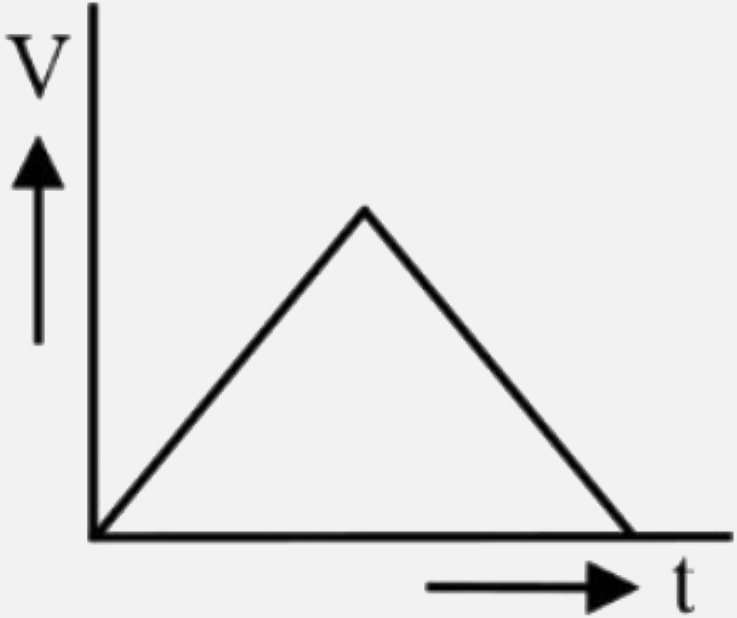 B
B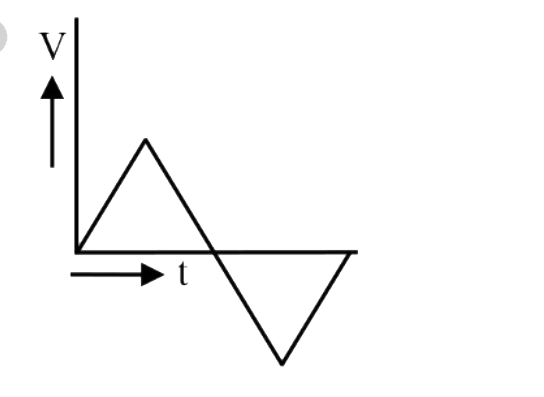 C
C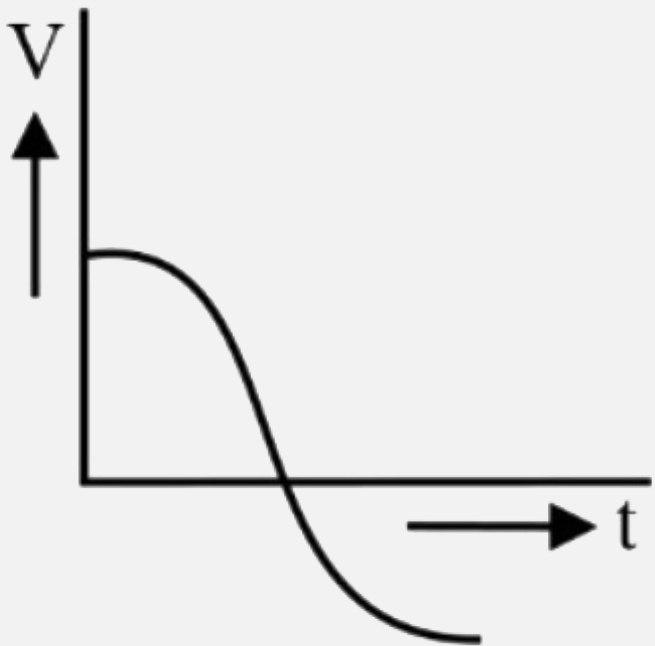 D
D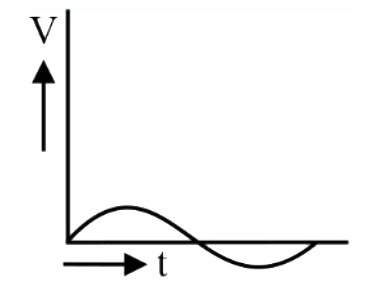
The current I in a n inductance coil varies with time, t according to the graph shown in the figgure. Which one of the following plots shows the variation of voltage in the coil with time ?
 A
A B
B C
C D
D
The current i in an induction coil varies with time according to the graph shown in figure. Which of the following graph shows induced emf in the coil with time:
A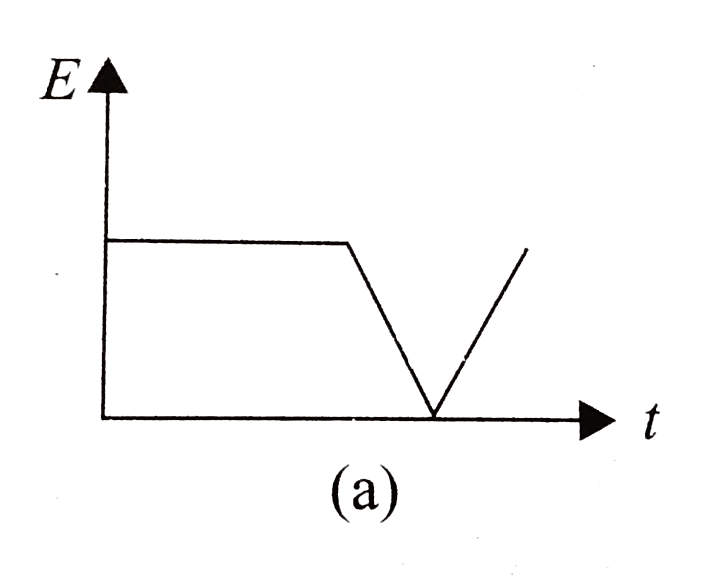 B
B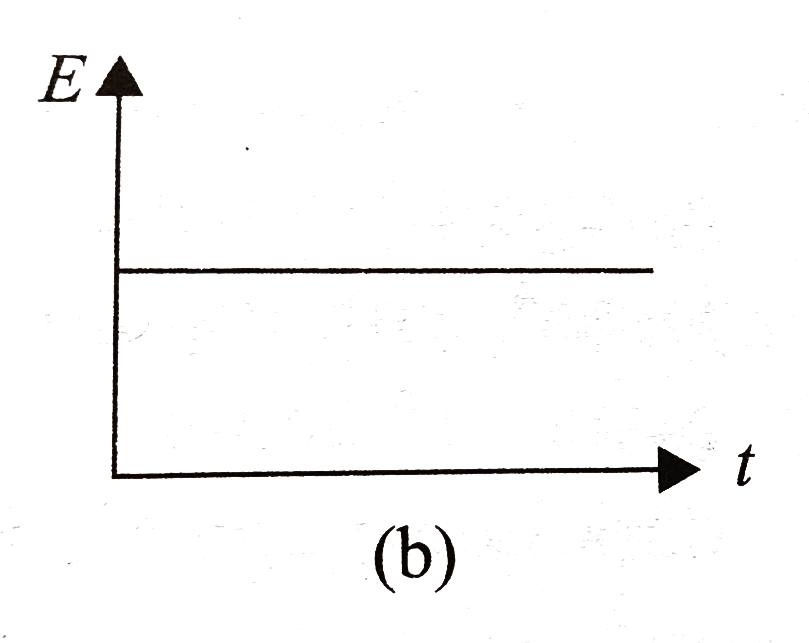 C
C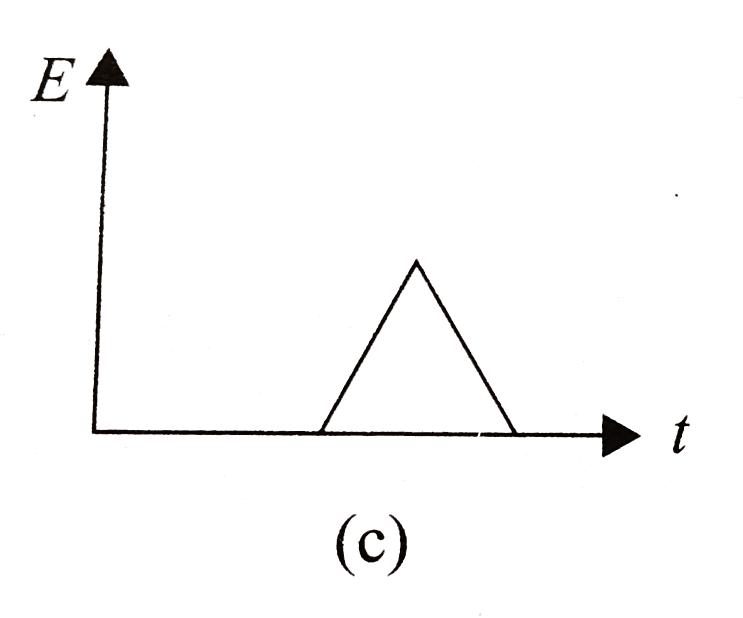 D
D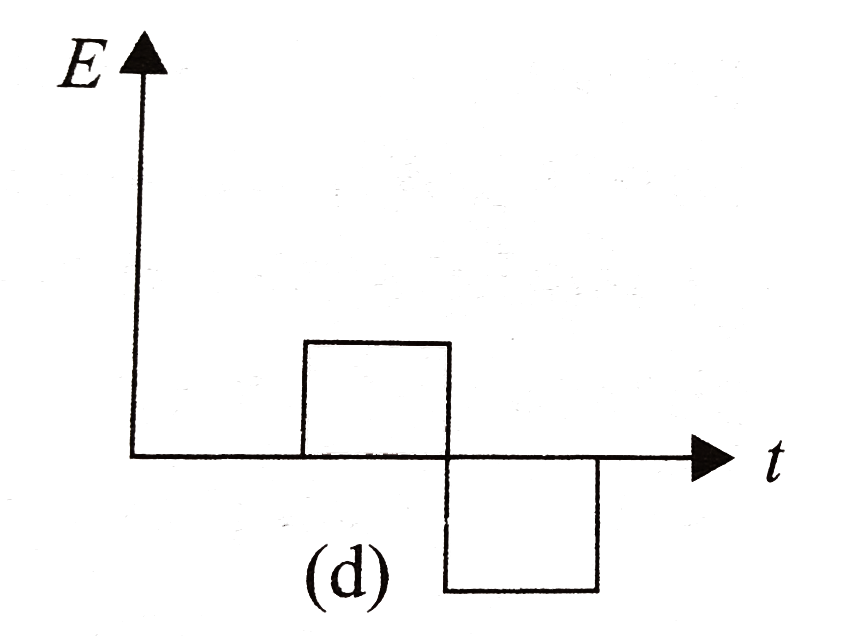
The current is an induction coil varies with time t, according to the graph shown in figure. Which of the following graphs shows the induced emf (e) in the coil with time.
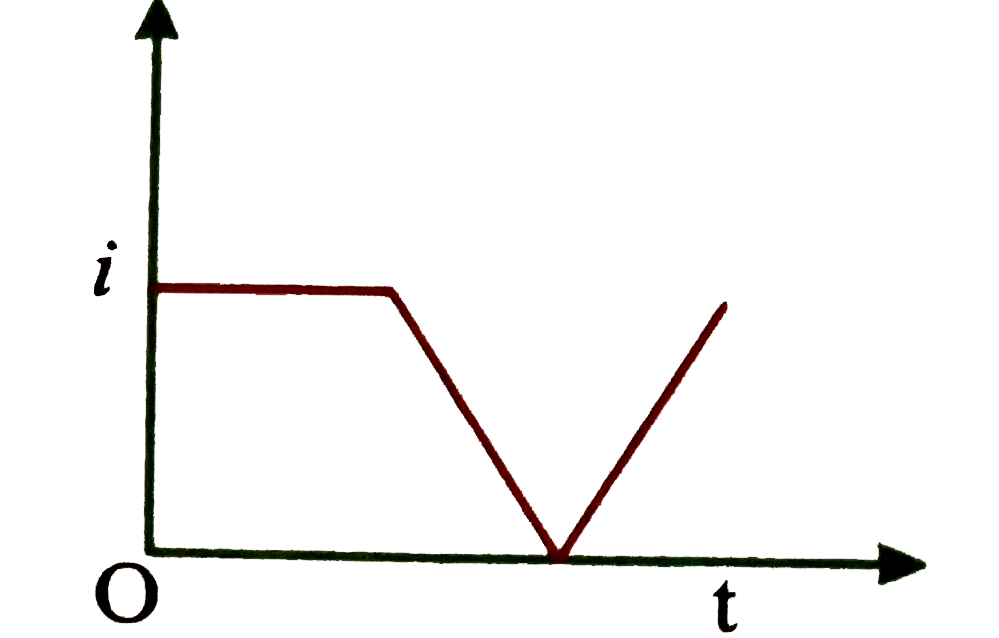
View SolutionThe current (I) in the inductance is varying with time according to the plot shown in figure
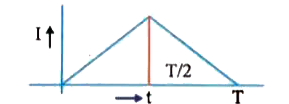
Which one of the following is the correct variation of voltage with time in the coil ?
View SolutionThe current (I) in the inductance is varying with time acroding to the plot shown in figure.
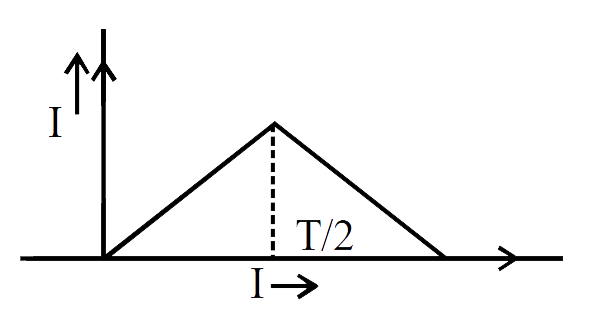
Which one of thhe following is the correct variation of voltage with time in the coil ?
View SolutionThe current i in an induction coil varies with time t according to the graph shown in the figure-5.250. Which of the following graphs shows the induced EMF in the coil with time ?
View SolutionThe current i in an inductionn coil varies with time t according to the graph shown in the figure. Which of the following grahs shows athe induced emf (ε) in the coil with time?
View Solution
