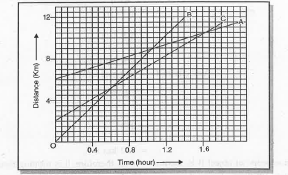
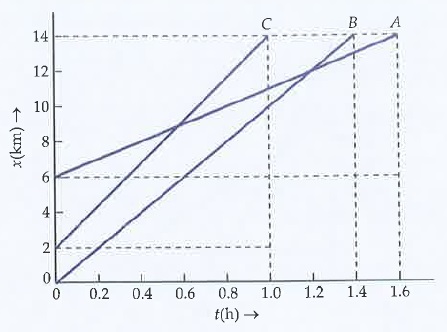
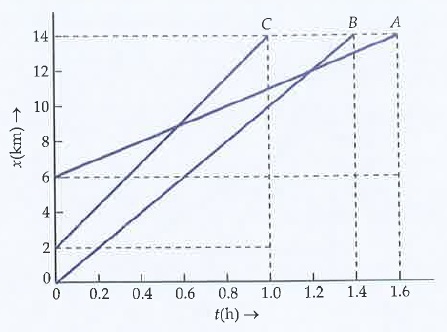
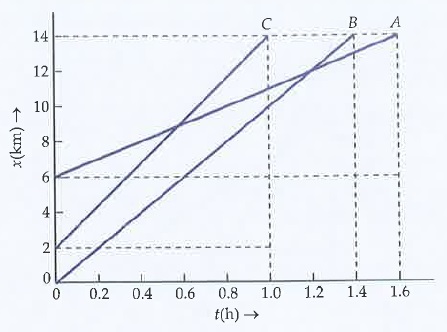
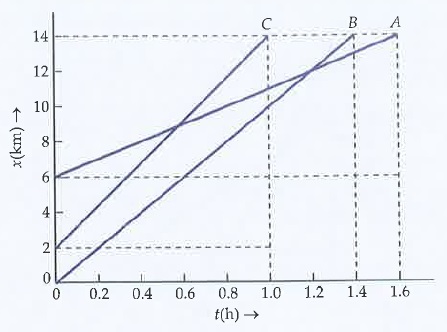
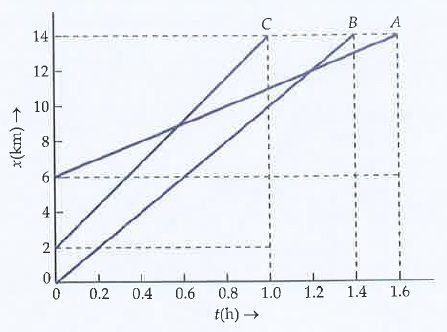
Figure shows the distance-time graph of three object and . Study the graph and answer the following questions :
(a) Which of the three is travelling the fastest ?
(b) Are all three ever at the same point on the road ?
( c) How far has travelld by when passes ?
(d) How far has travelled by the time it passes ?
(a) Object B
(b) No
(c ) 5.714 km
(d) 5.143 km
(a) Speed =
Slope of graph =
Therefore, Speed = slope of the graph
Since slope of object B is greater than objects A and C, it is travelling the fastest.
(b) All three objects A, B and C never meet at a single point. Thus, they were never at the same point on road.
(c ) 
7 square box = 4 km ltBrgt 1 square box = 4/7 km
C is 4 blocks away from origin therefore initial distance of C from origin = 16/7 km
Distance of C from origin when B passess A = 8 km
Thus, Distance travelled by C when B passes A = 8- 16/7=(56-16)/7=40/7=5.714 km
(d) 
Distance travelled by B by the time it passes C = 9 square boxes 94/7 = 36/7 = 5.143 km
Topper's Solved these Questions
Similar Questions
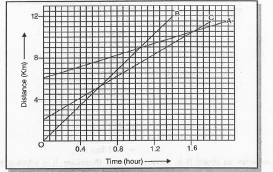
Fig 1.11 show the distance - time graphs of three A,B and C. Study the graph and answer the following question : Which of the three is travelling the fastest ?
 View Solution
Fig 1.11 show the distance - time graphs of three A,B and C. Study the graph and answer the following question : How far has C travelled when B passes A ?
 View Solution
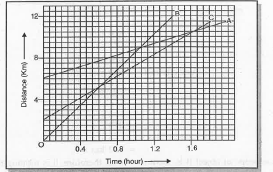
Fig 1.11 show the distance - time graphs of three A,B and C. Study the graph and answer the following question : Are all three ever at the same point on the road ?
 View Solution
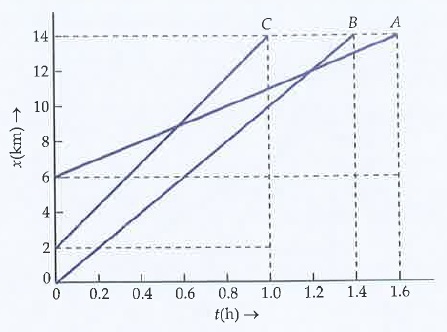
Figure 3.64 shows the position-time graphs of three car A, B and C. On the basis of the graphs, answer the following questions : When A passes C, where is B ?
 View Solution
Figure 3.64 shows the position-time graphs of three car A, B and C. On the basis of the graphs, answer the following questions : Are the three cars ever at the same point on the road ?
 View Solution
Figure 3.64 shows the position-time graphs of three car A, B and C. On the basis of the graphs, answer the following questions : Which car has the highest speed and which the lowest ?
 View Solution
Figure shows the position-time graphs of three car A, B and C. On the basis of the graphs, answer the following questions : What is the relative velocity of car B with respect to car C ?
 View Solution
Figure shows the position-time graphs of three car A, B and C. On the basis of the graphs, answer the following questions : What is the relative velocity of car C with respect to car A ?
 View Solution
Figure 3.64 shows the position-time graphs of three car A, B and C. On the basis of the graphs, answer the following questions : How far did car A travel between the time it passed cars B and C ?
 View Solution
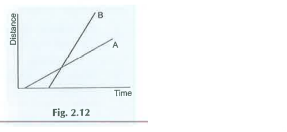
Figure 2.12 shows distance-time graphs of two objects A and B. Which object is moving with a greater speed when both are moving ?
 View Solution

