The velocity time graph of a ball of mass 20g moving along a straight line on a long table is given in (figure) How much force does the table exert on the ball to bring it to rest? 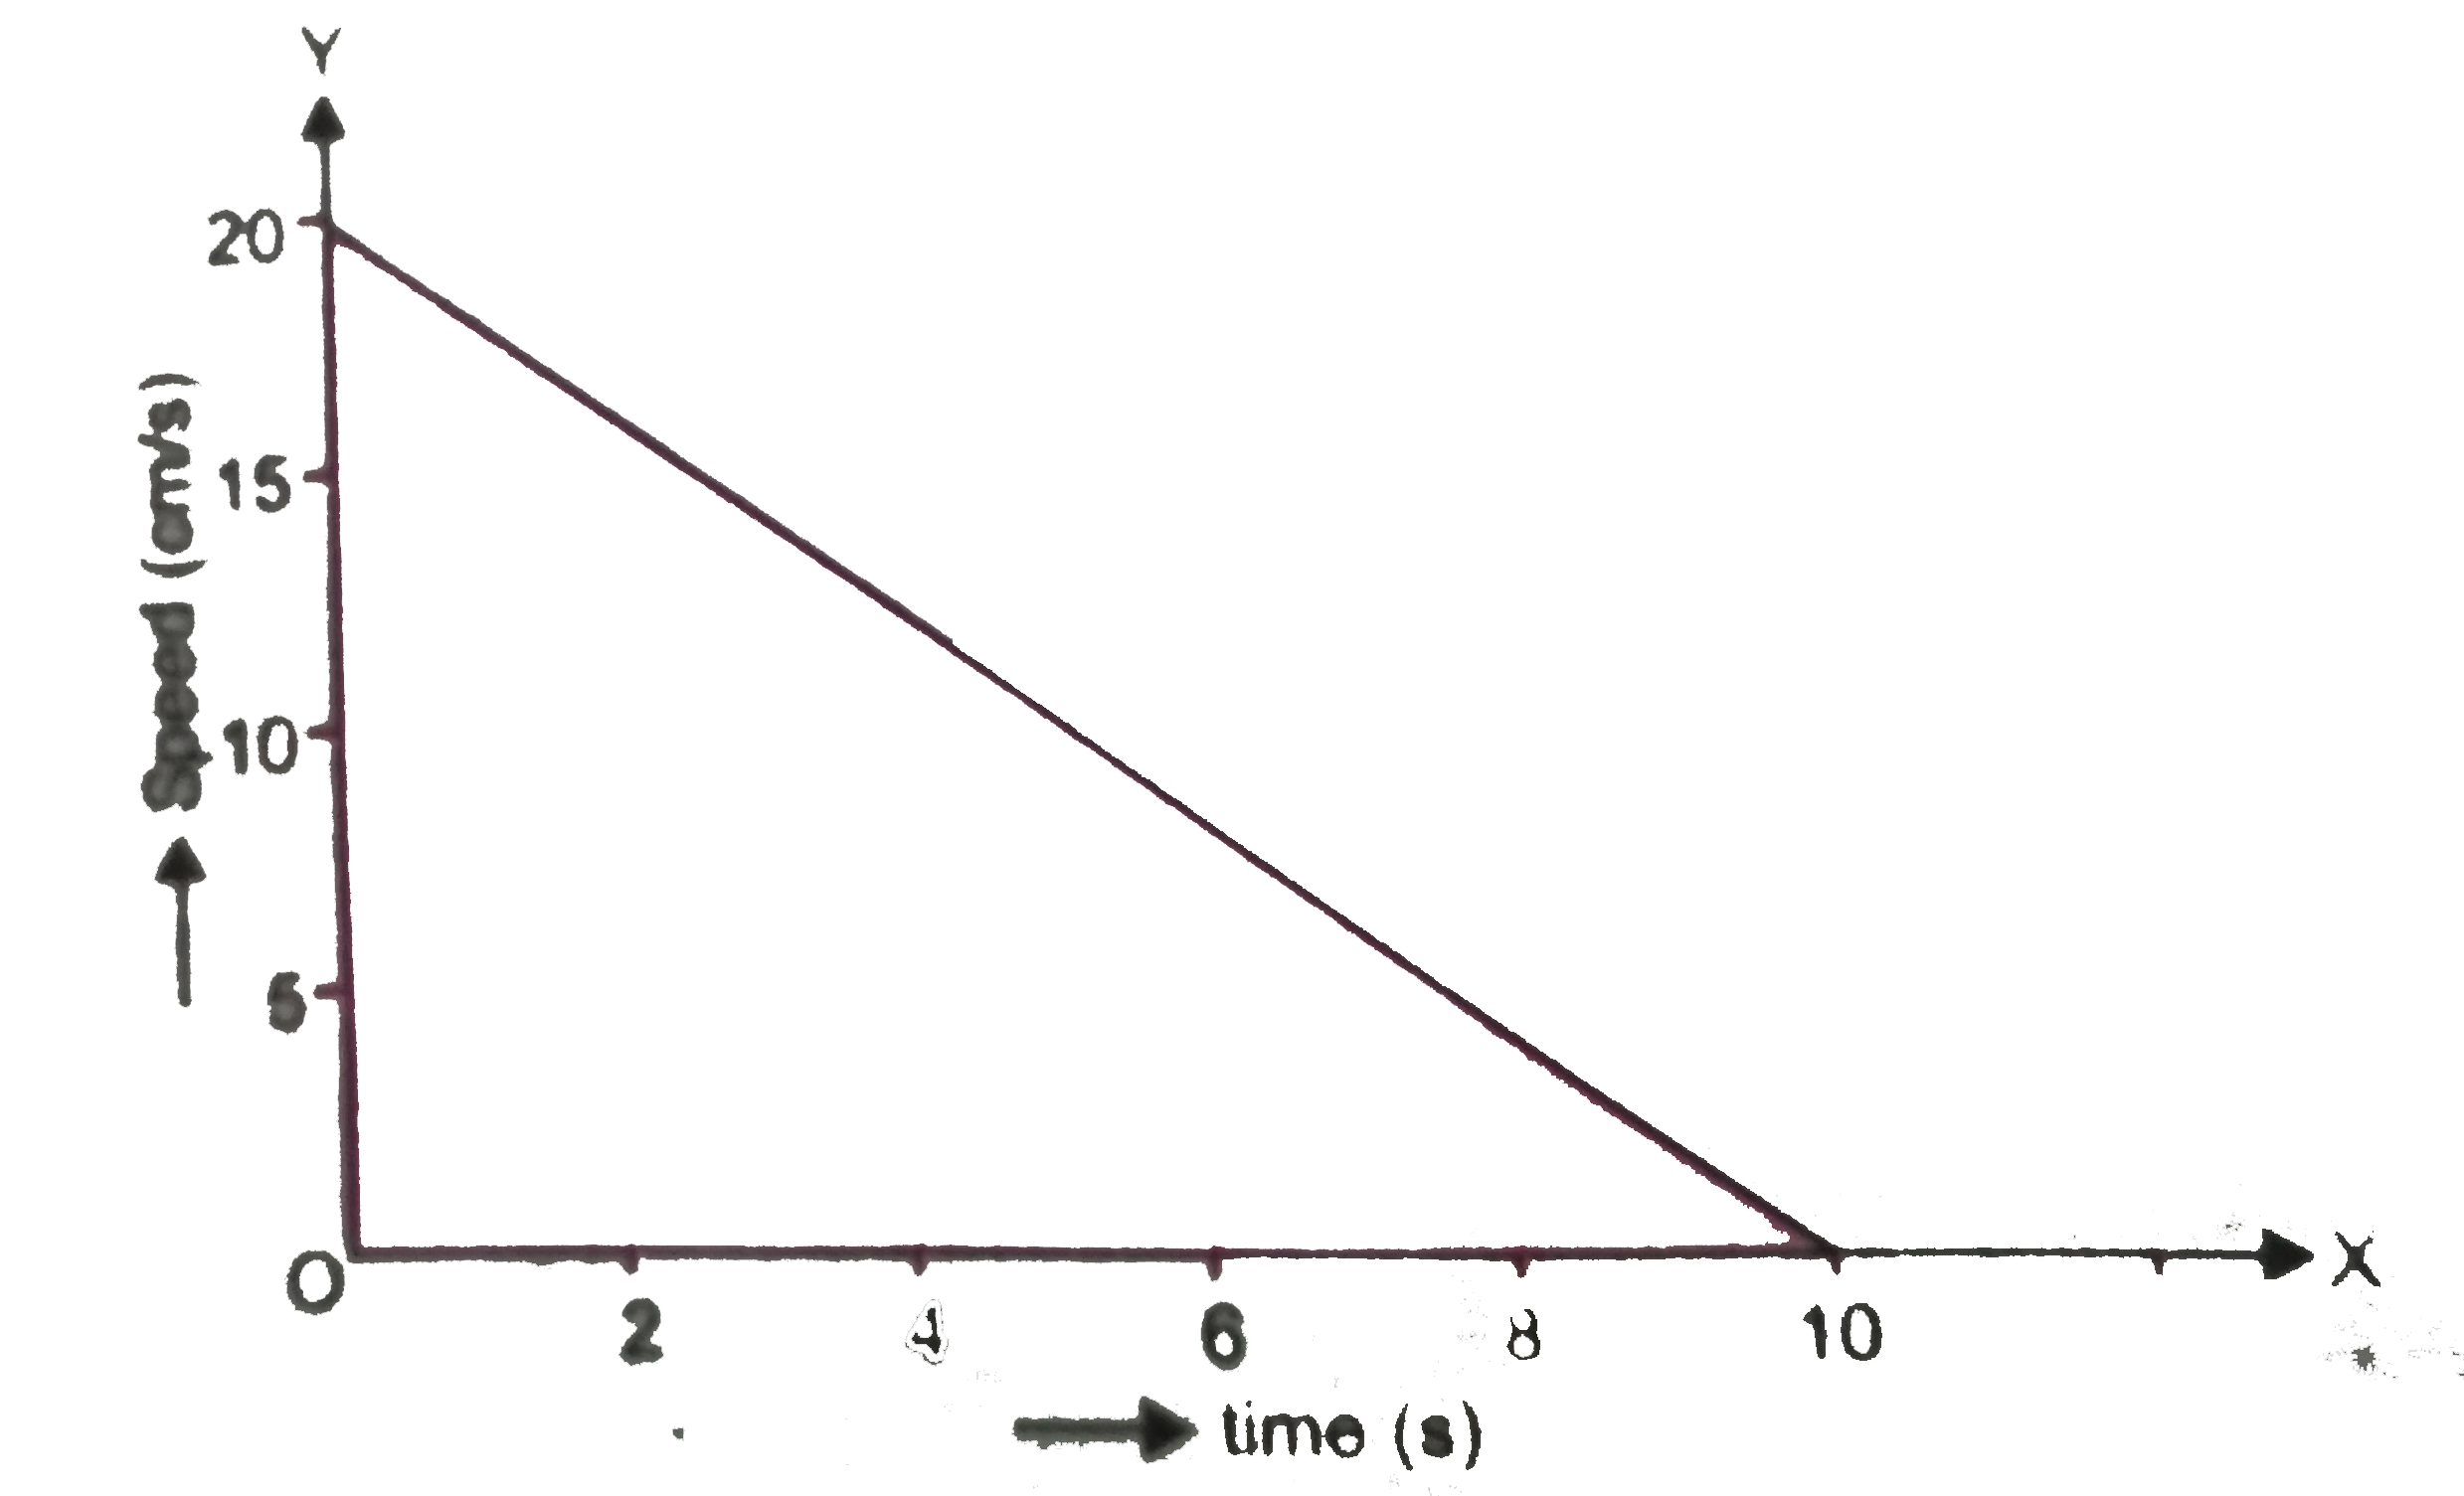
Video Solution
Text Solution
The initial velocity of the ball is 20 cm s−1. Due to the frictional force exerted by the table, the velocity of the ball decreases down to zero in 10 s. Thus, u = 20 cm s–1, v = 0 cm s−1 and t = 10 s. Since the velocity-time graph is a straight line, it is clear that the ball moves with a constant acceleration. The acceleration a is
a=v−ut
=0 cm s−1 -20 cm s−1/10s
=-2 cm s−2=-0.02 ms−2
The force exerted on the ball F is , F=ma=(20/1000)kg×(−0.02ms−2)
=−0.0004N. The negative sign implies that the fricitonal force exerted by the table is opposite to the direction of motion of the ball.
|
Updated on:21/07/2023
Related Playlists
Similar Practice Problems
- Question 1 - Select One or More
The velocity-time graph of a body moving in a straight line is shown in the figure.
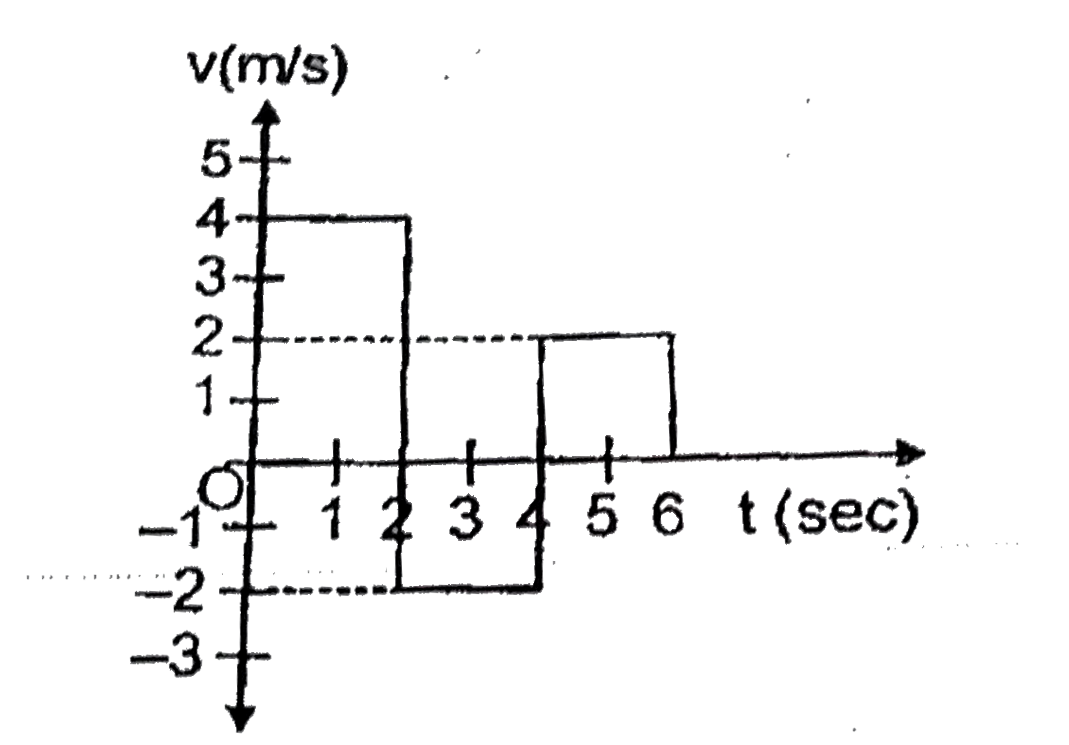 AThe magnitude of displacement of the body in 1st 2 sec is 8 mBThe magnitude of displacement of the body in 1st 4 sec is 4 mCThe distance travelled in 1st 2 sec is 8 mDThe distance travelled in 1st 4 sec is 12 m
 - Question 1 - Select One
The velocity - time graph of a particle moving along a straight line is shown in the figure given below
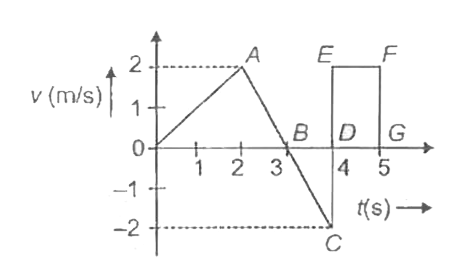
The displacement of the particle in 5 second isA0.5 mB1 mC2 mD4 m - Question 1 - Select One
The velocity-time graph of a particle moving along a straight line is given as below. The displacement time curve for the particle is given by :
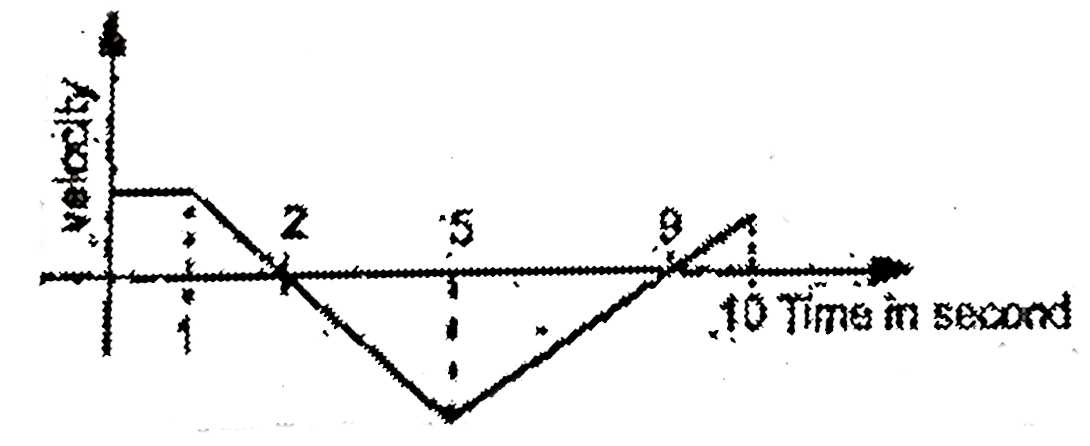 A
A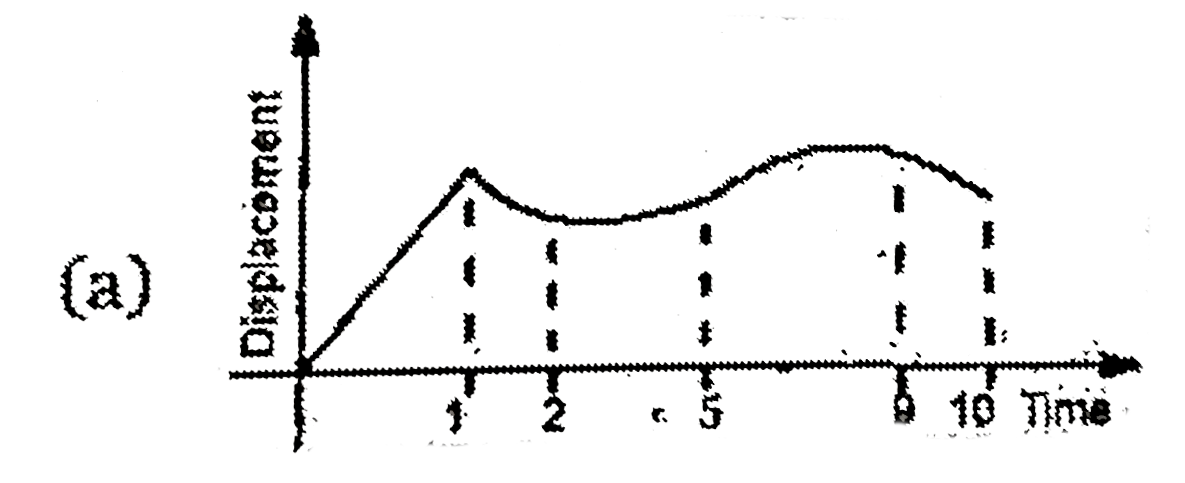 B
B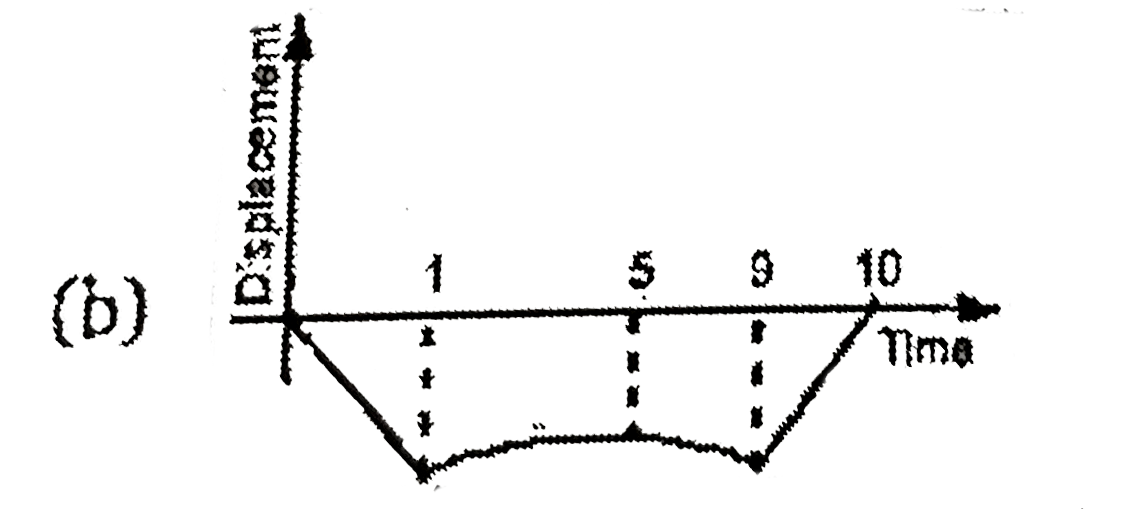 C
C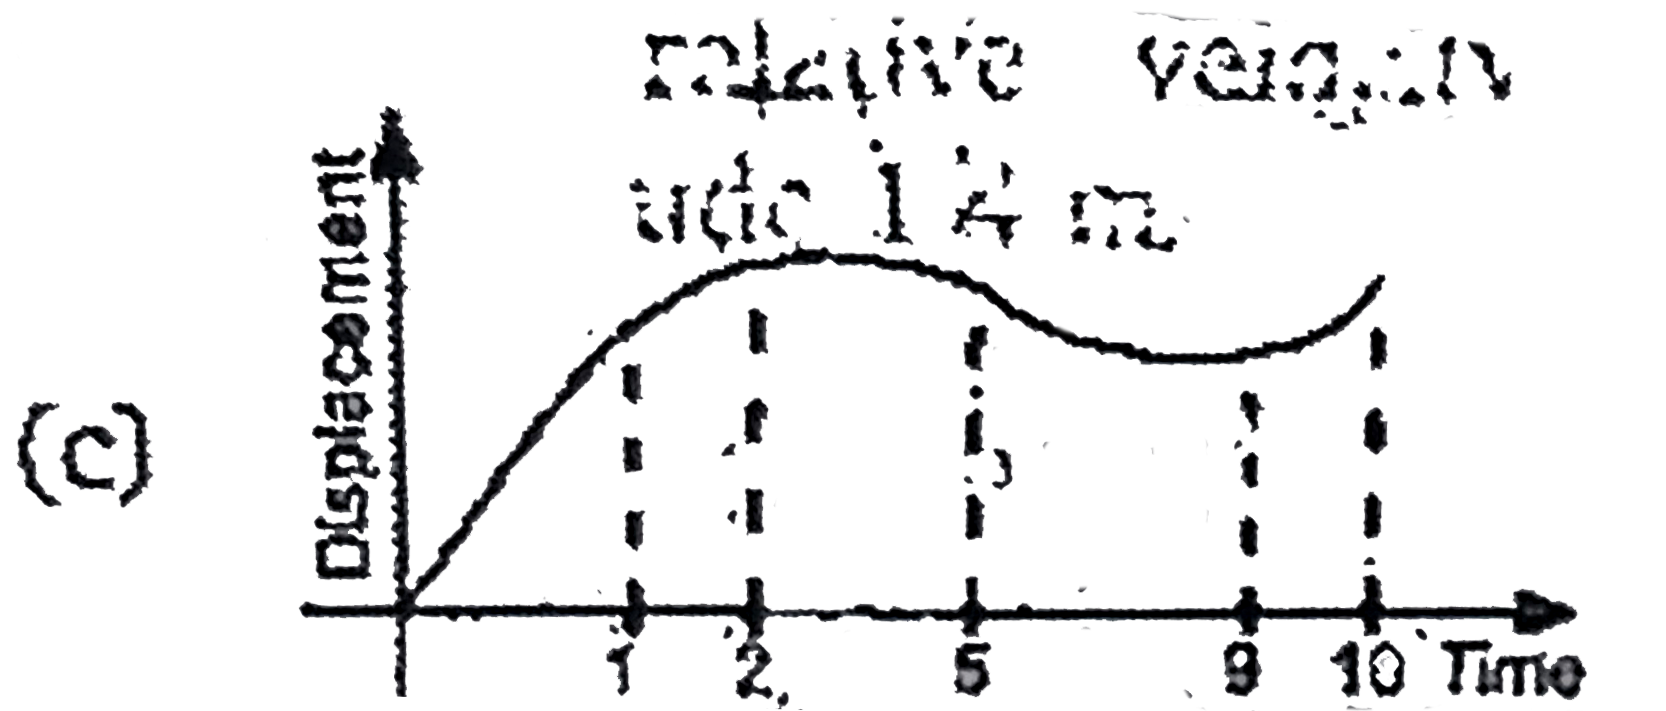 D
D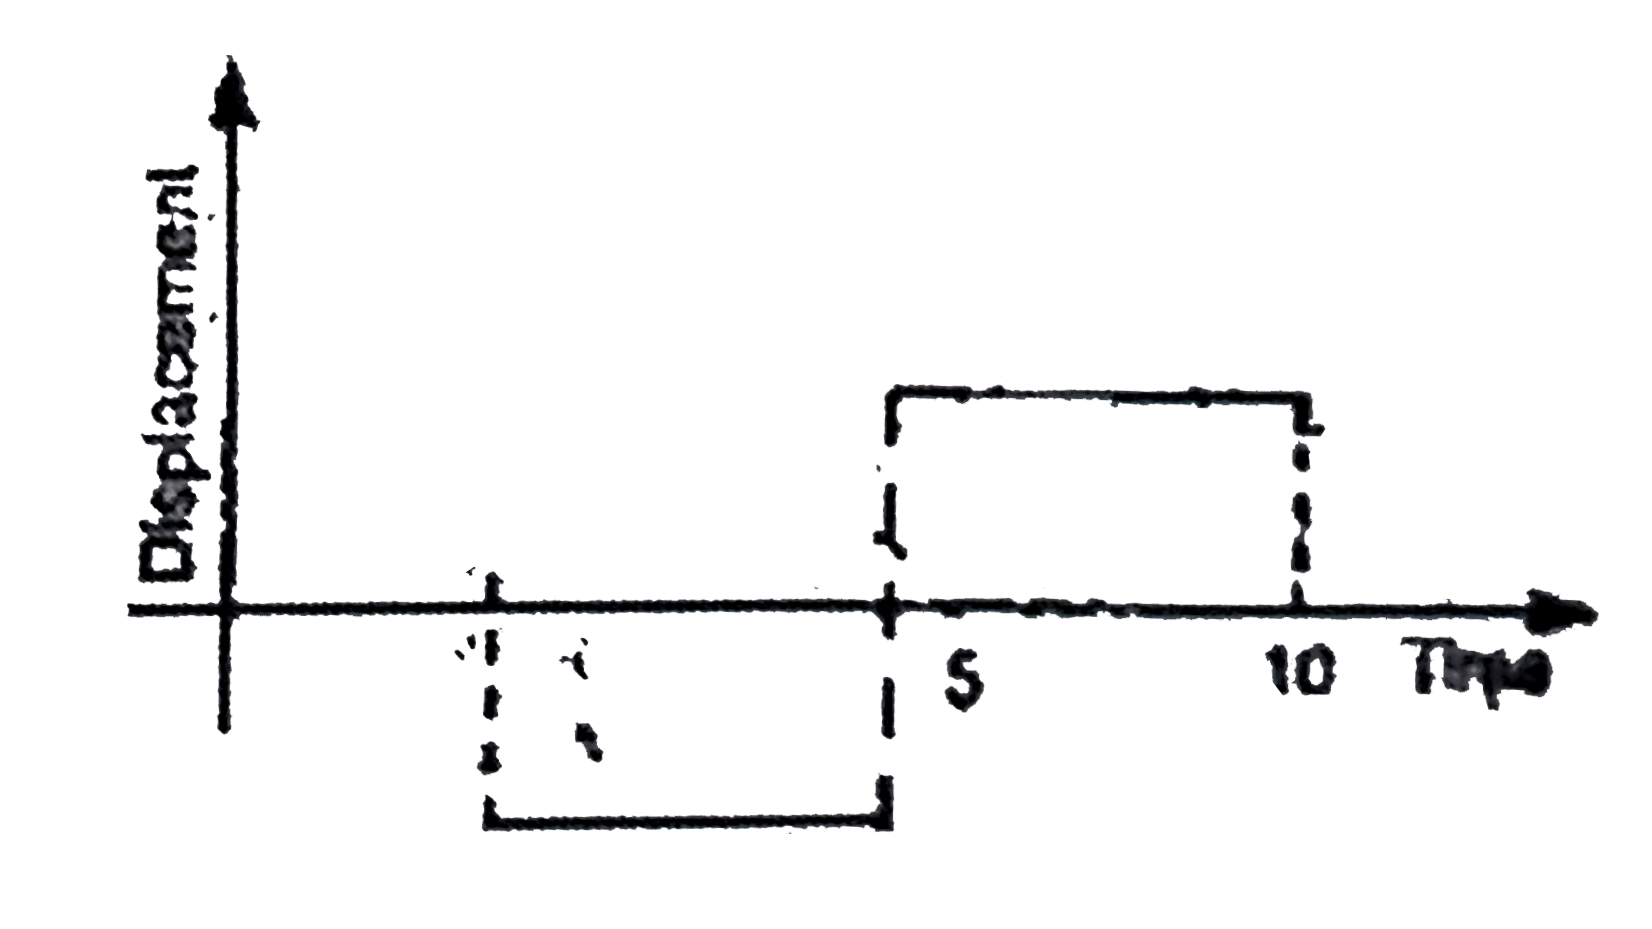
- Question 1 - Select One
The velocity time graph of a body moving along a straight line is shown in figure. The ratio of the average velocities during the time t1 and t2 is.
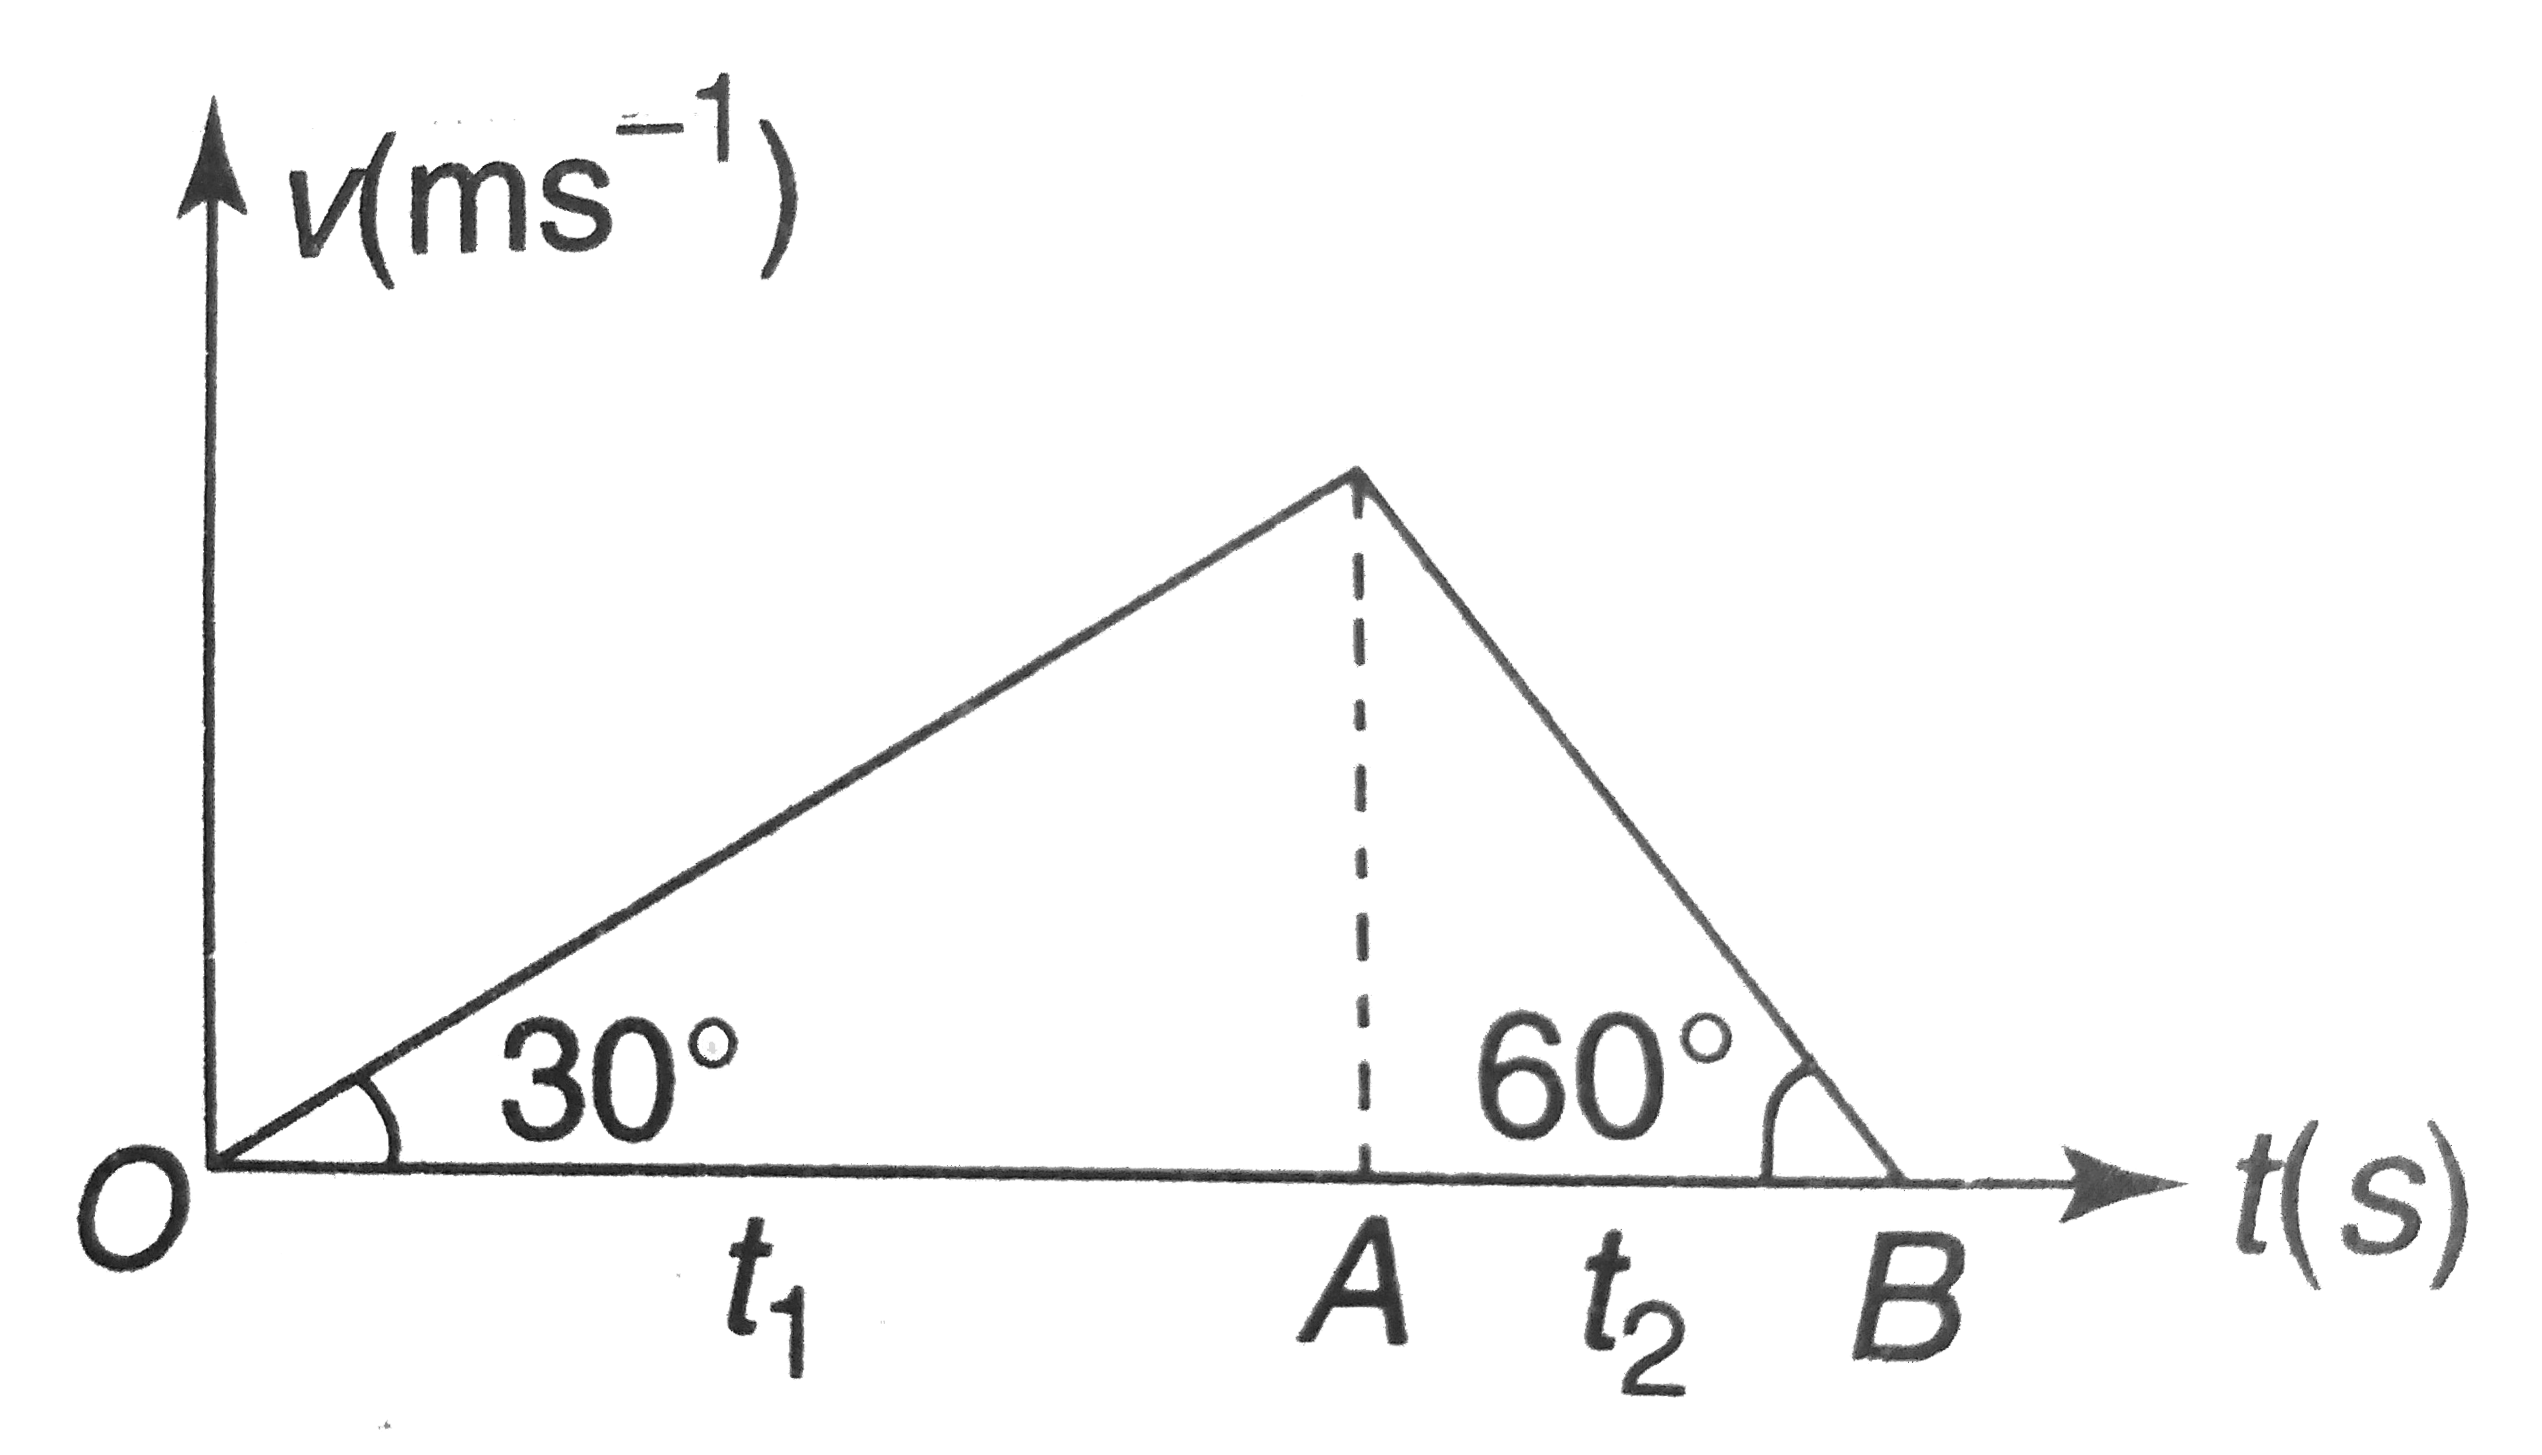 A1:1B2:1C3:1D1:3
 - Question 1 - Select One
The velocity-time graph of a ball moving on the surface of a floor as shown in figure. Calculate the force acting on the force acting on the ball, if mass of the ball is 200g.
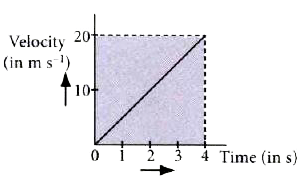 A2 NB5 NC1 ND3 N
Similar Questions
The speed time graph of a ball of mass 30g moving along a straight line is shown in (figure). Calculate the opposing force that brings the ball to rest.
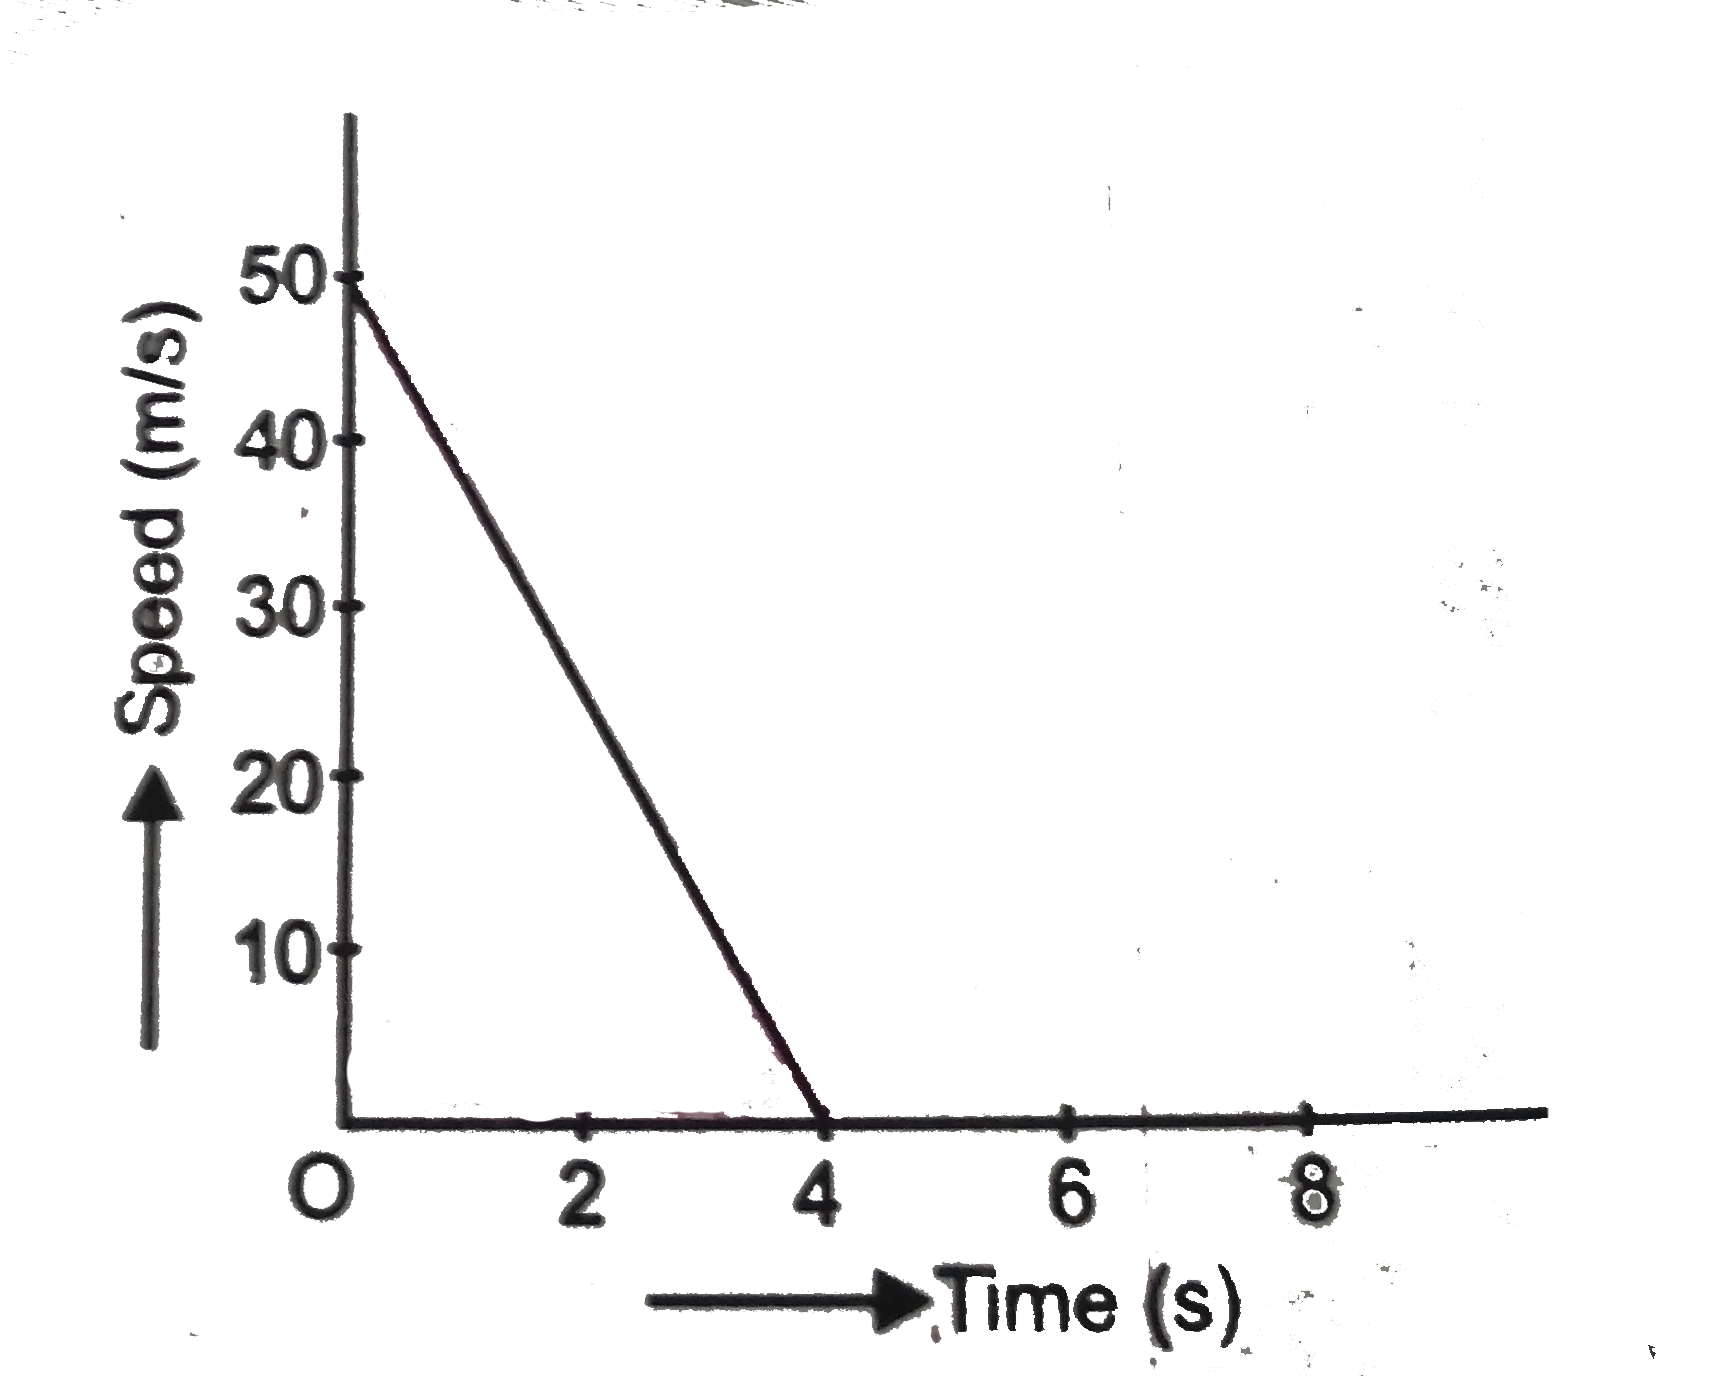 View Solution
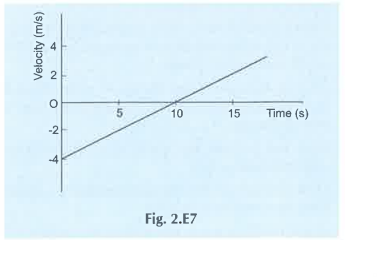
The velocity-time graph of a particle moving along a straight line is given in Figure 2E7.Does the particle turn around ?If so , when ?
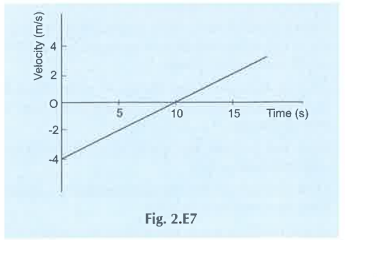 View Solution
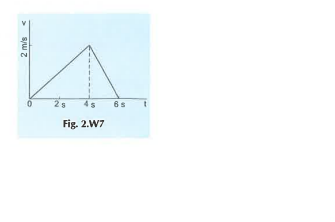
The velocity-time graph of a particle moving along a straight line is shown in Figure 2.W7.Is the motion uniform?
 View Solution
The velocity-time graph of a particle moving along a straight line is given in Figure 2E7.Does the particle ever come to rest ? If so , when ?
 View Solution
The velocity-time graph of a particle moving along a straight line is shown in the figure-given below
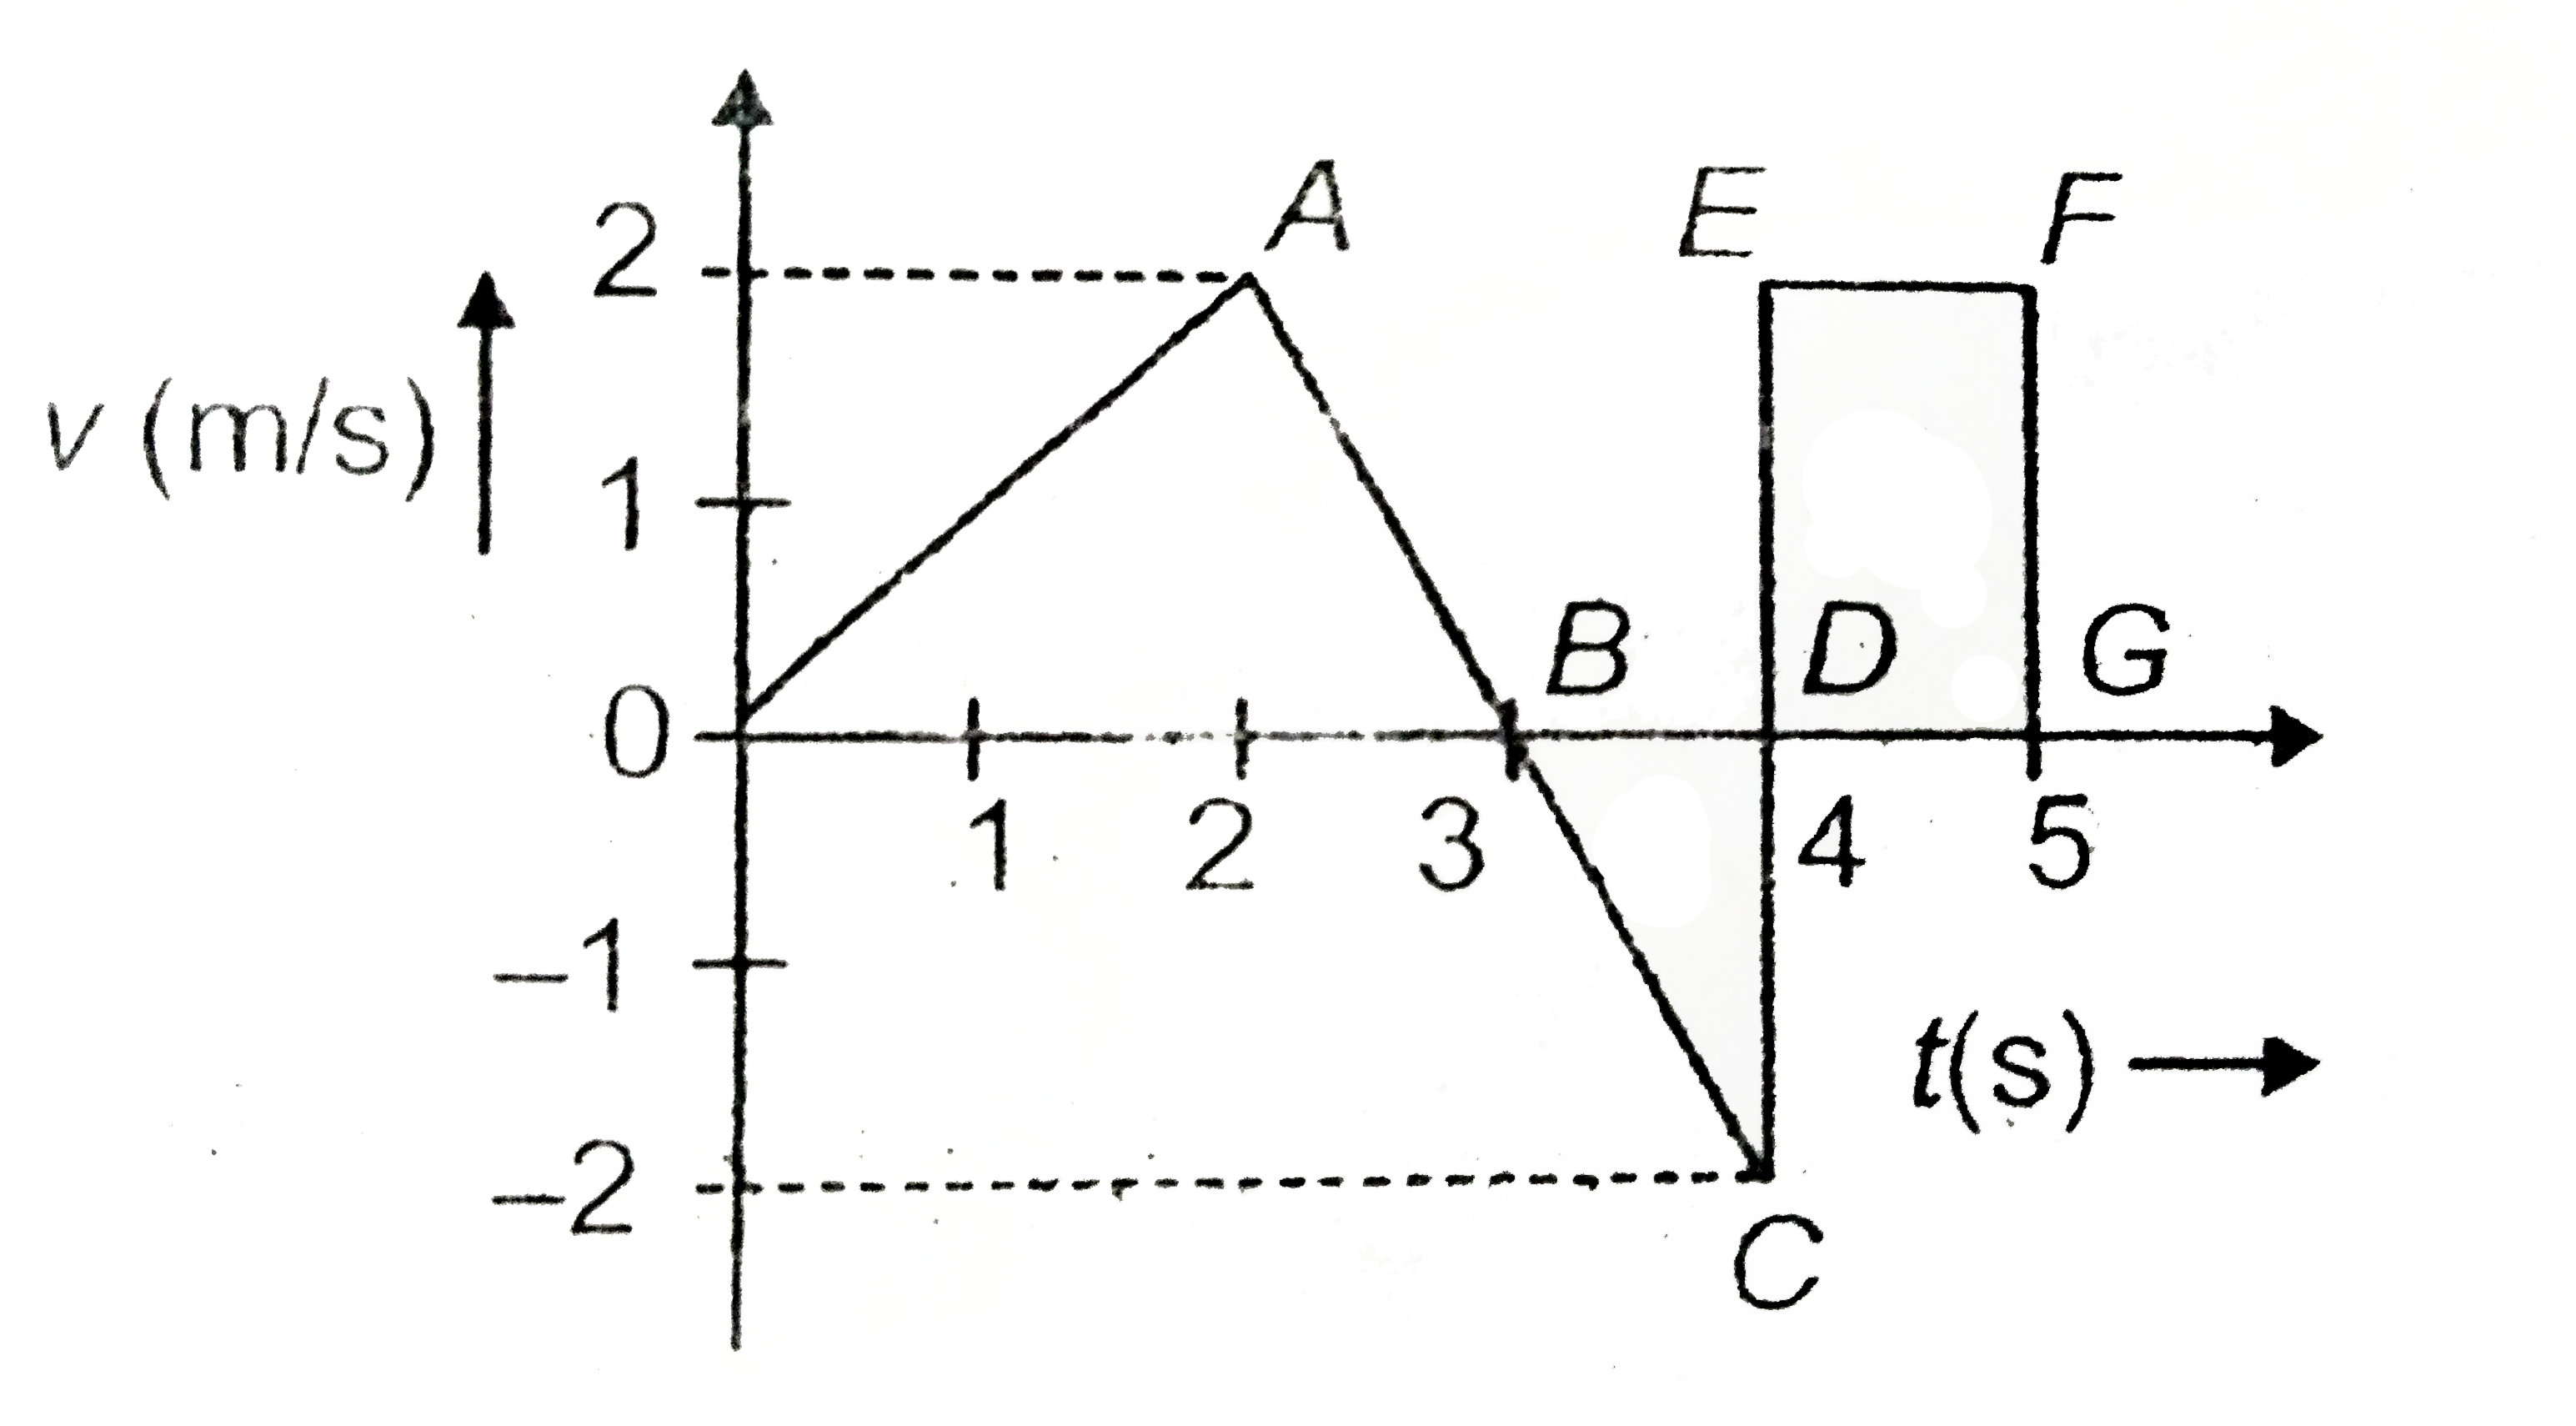
The displacement of the particle in 5 second isView Solution

