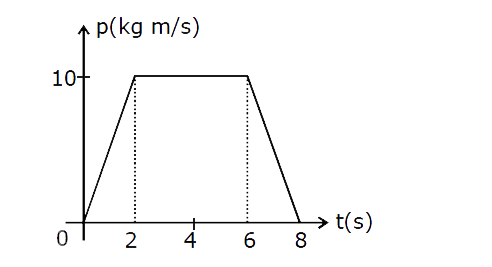
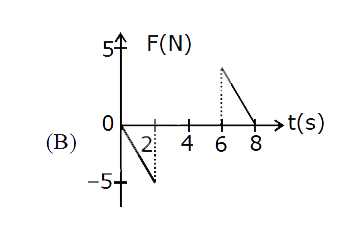
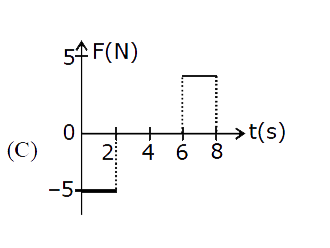
The momentum p of an object varies with time (t) as shown in figure. The corresponding force (F)- time (t) graph is -
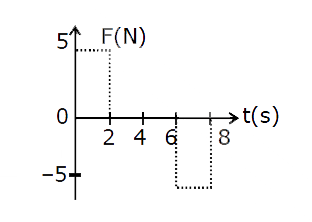
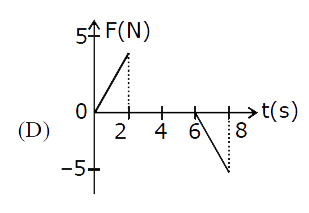
The correct Answer is:A
Step by step video, text & image solution for The momentum p of an object varies with time (t) as shown in figure. The corresponding force (F)- time (t) graph is - by Physics experts to help you in doubts & scoring excellent marks in Class 12 exams.
Updated on:21/07/2023Topper's Solved these Questions
- NEWTON'S LAWS OF MOTION & FRICTION BOOK - MOTIONCHAPTER - NEWTON'S LAWS OF MOTION & FRICTION EXERCISE - Exercise - 2 SECTION-B :- Pulley Block System
7 Videos
- NEWTON'S LAWS OF MOTION & FRICTION BOOK - MOTIONCHAPTER - NEWTON'S LAWS OF MOTION & FRICTION EXERCISE - Exercise - 2 SECTION-C :- Pseudo force, Weighing Machine
2 Videos
- NEWTON'S LAWS OF MOTION & FRICTION BOOK - MOTIONCHAPTER - NEWTON'S LAWS OF MOTION & FRICTION EXERCISE - Exercise - 1 SECTION-F :- Direction of friction, Pulley Block system on horizontal plane, Pulley Block system on inclined plane, Two Block system, Two Block on Inclined plane
12 Videos
- MODERN PHYSICS -1BOOK - MOTIONCHAPTER - MODERN PHYSICS -1EXERCISE - EXERCISE-4 ( LEVEL- II)
39 Videos
- NLM & FRICTIONBOOK - MOTIONCHAPTER - NLM & FRICTIONEXERCISE - EXERCISE-4 ( LEVEL-II)
15 Videos
Similar Questions
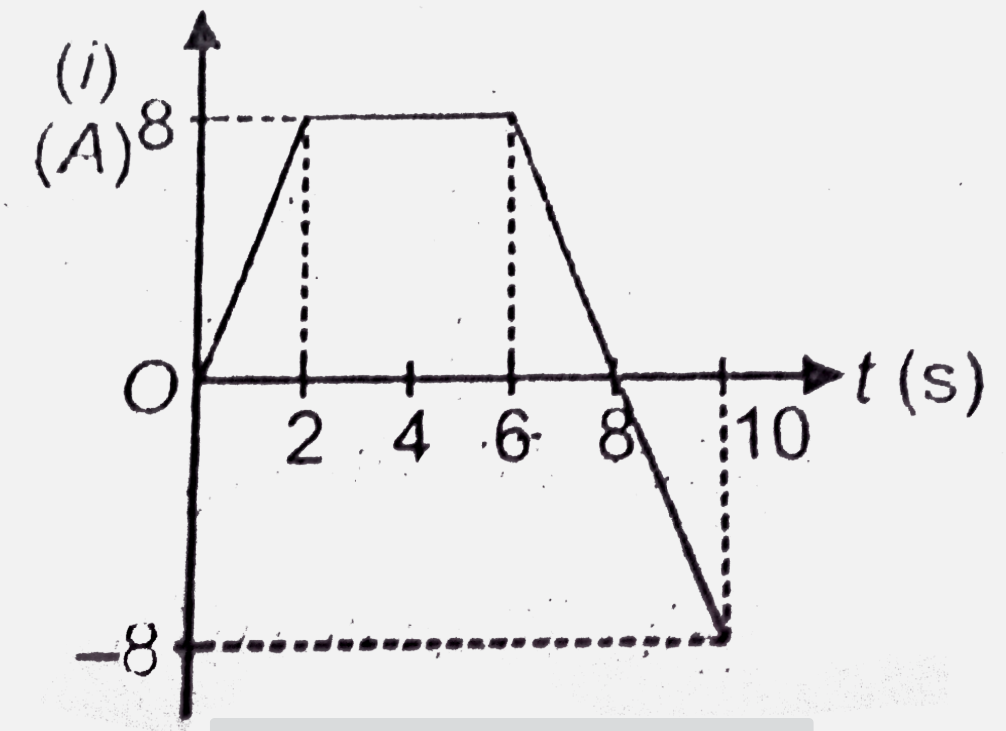
The current I through a conductor varies with time t as shown in figure. The average electric current during t=0 to t=10 s will be
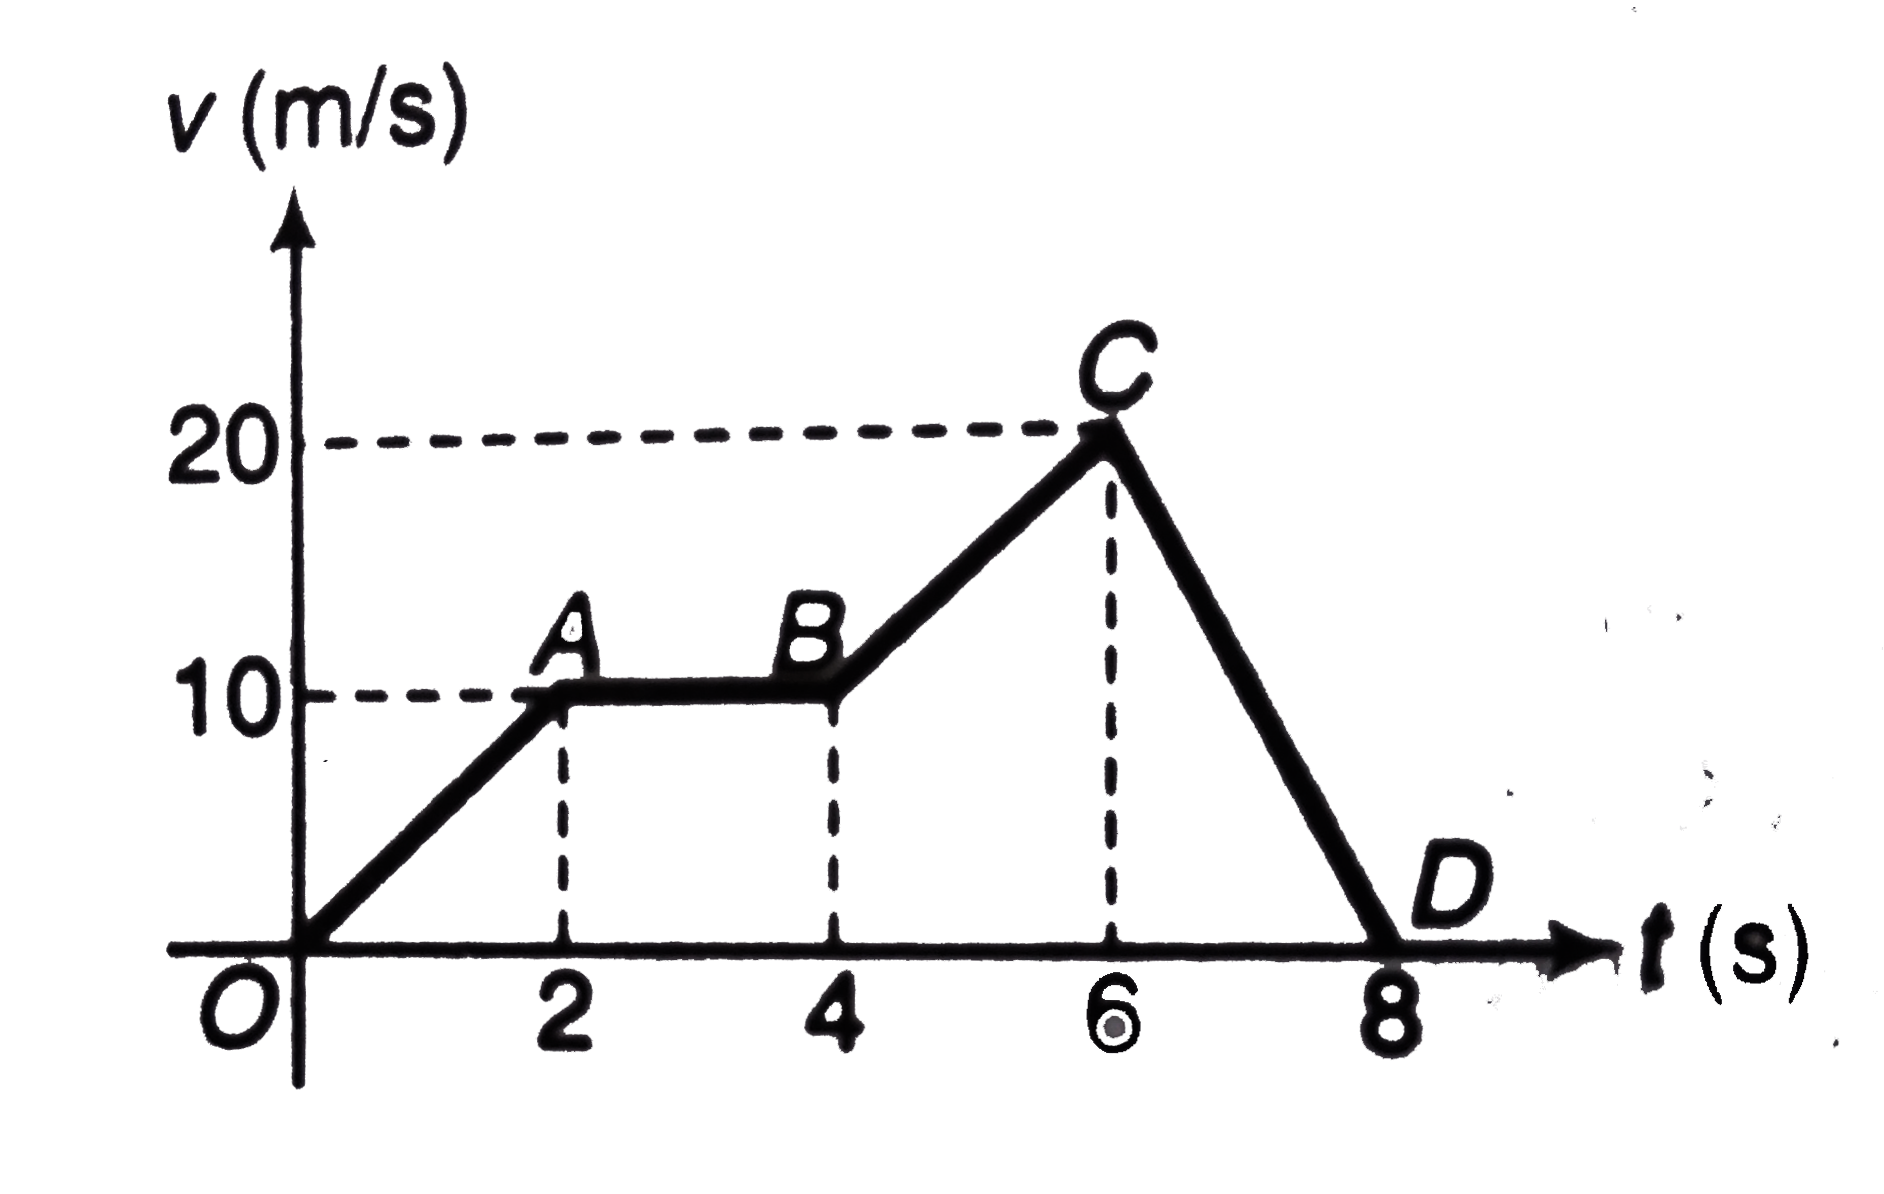
View SolutionVelocity-time graph of a particle moving in a straight line is shown in figure. Plot the corresponding displacement-time graph of the particle if at time t=0, displacement s=0.
View Solution
Knowledge Check
The displacement time graph of a particle executing SHM is as shown in the figure
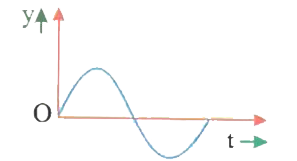
The corresponding force-time graph of the particle isA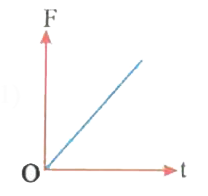 B
B C
C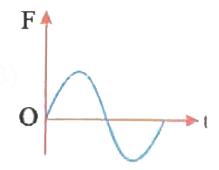 D
D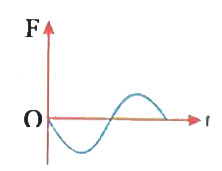
The displacement time graph of a particle executing S.H.M. is as shown in the figure
The corresponding force-time graph of the particle is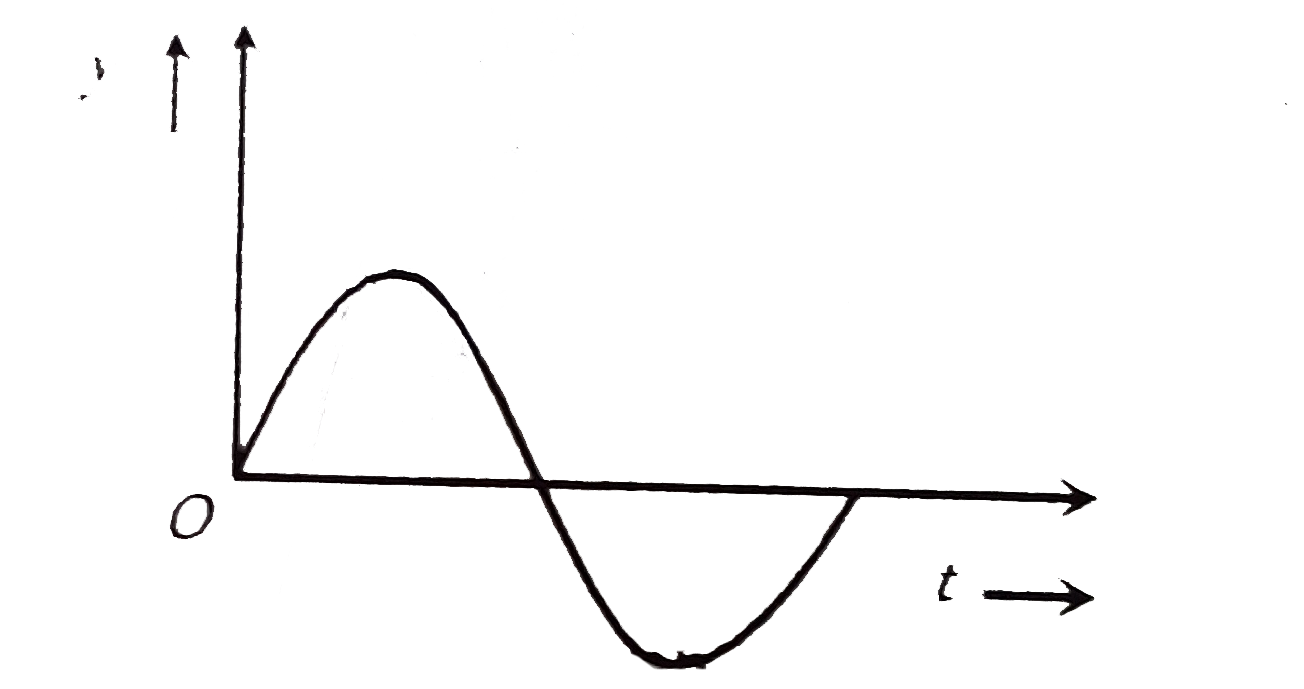 A
A B
B C
C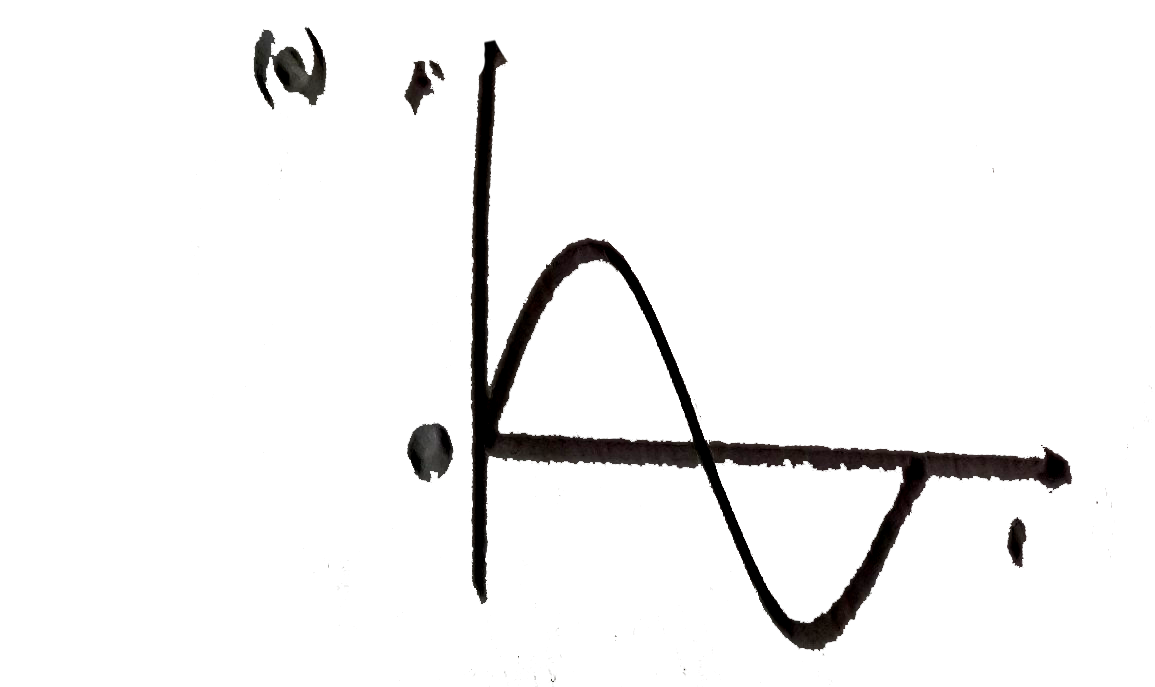 D
D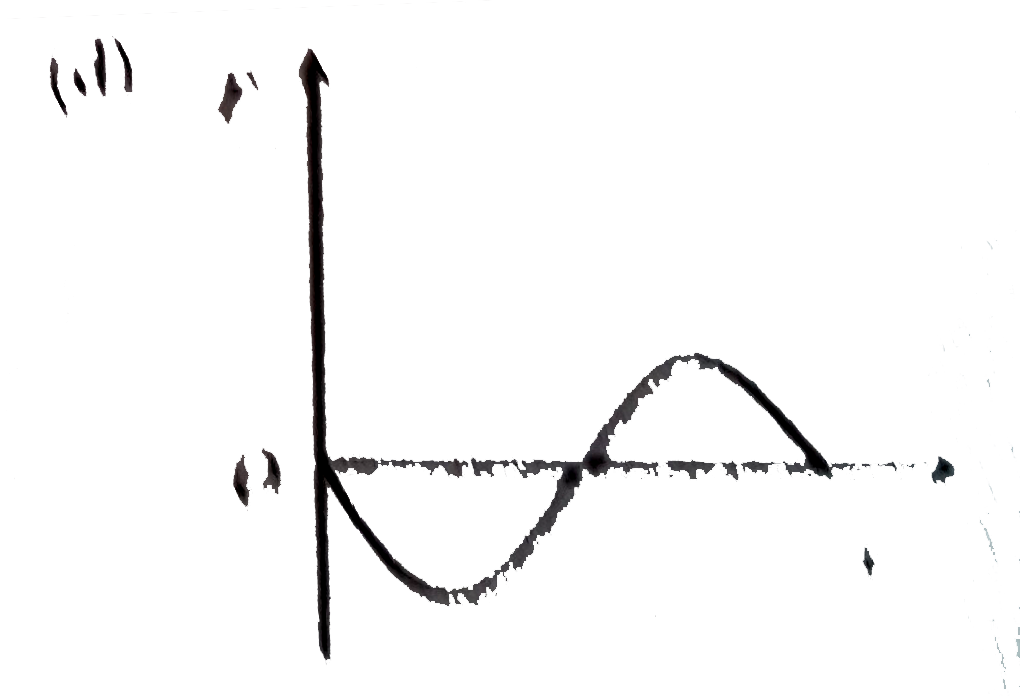
The velocity (v) - time (t) graph for a particle moving along x - axis is shown in the figure. The corresponding position (x) - time (t) is best represented by
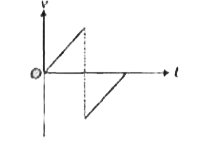 A
A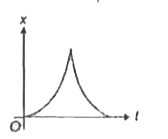 B
B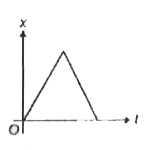 C
C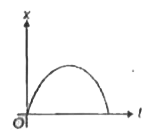 D
D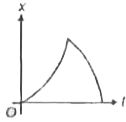
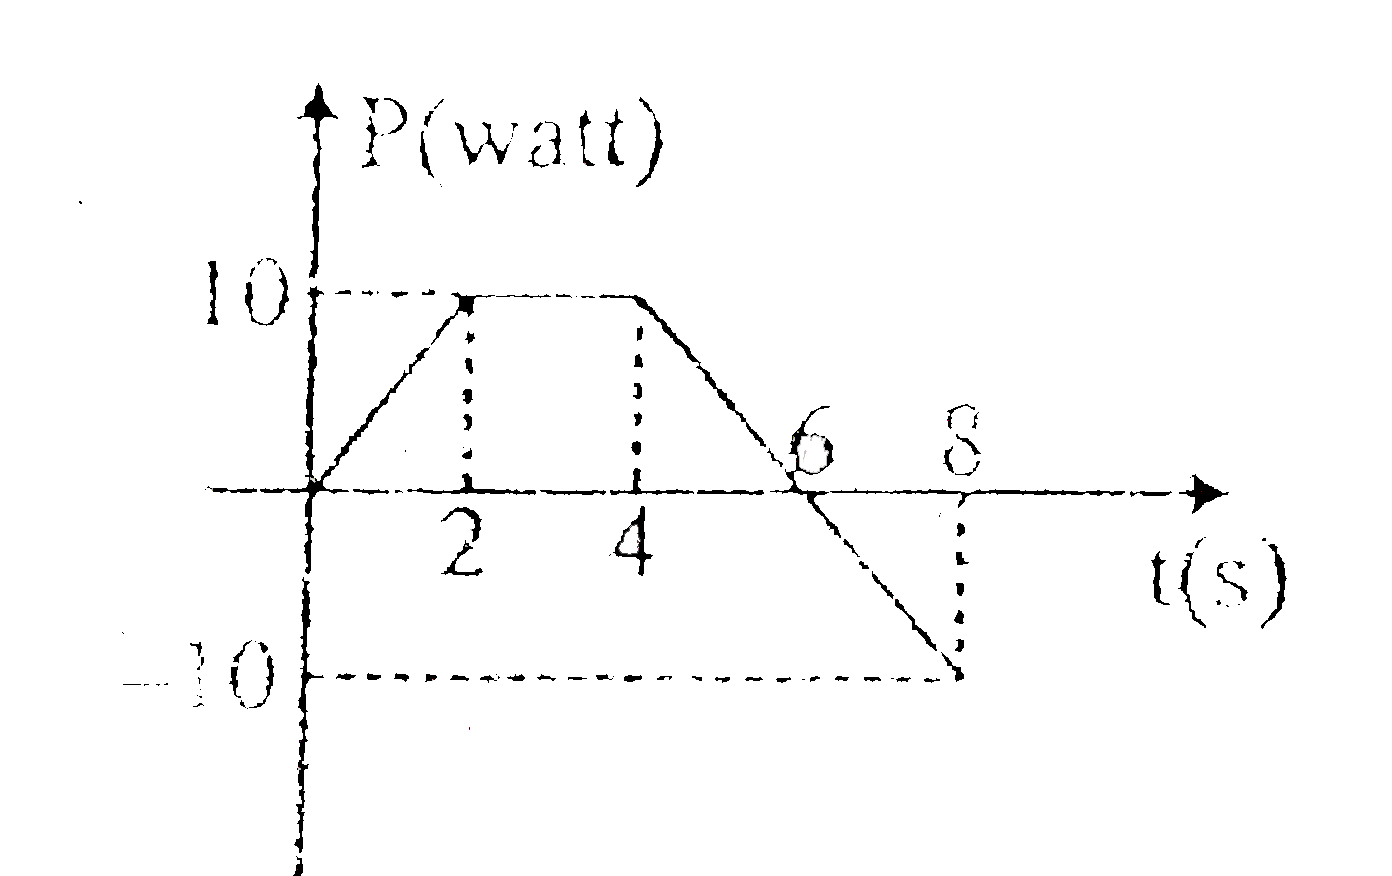
Power of a force acting on a block varies with time t as shown in figure. Then, angle between force acting on the block and its velocity is
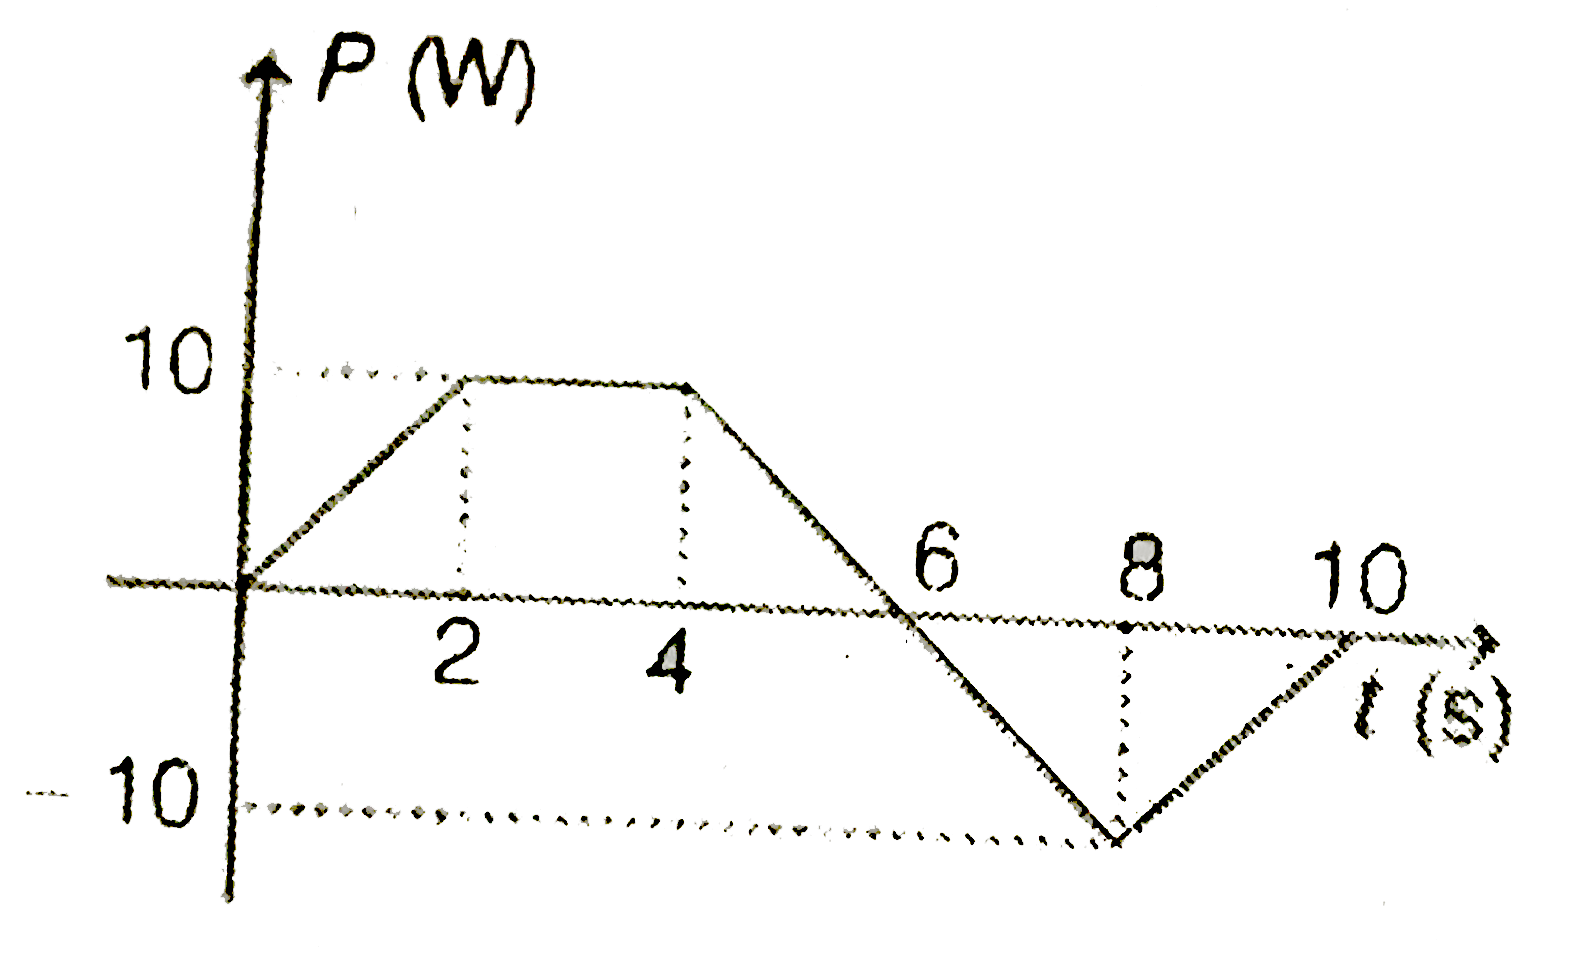
View SolutionPower due to a force actoing on a block varies with time t as shown in figure. Then angle between force acting on the block and its velocity is :−
View SolutionThe current in a 4.0 mH inductor vaires in time as shown in the figure. The corresponding graph of the self induced emf across the inductor over the time interval t=0 to t=12.0 ms is

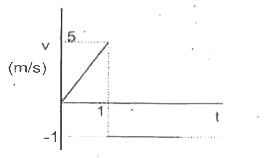
View SolutionThe velocity time graph for a particle moving along x-axis is shown in the figure. The corresponding displacement time graph is correctly shown by
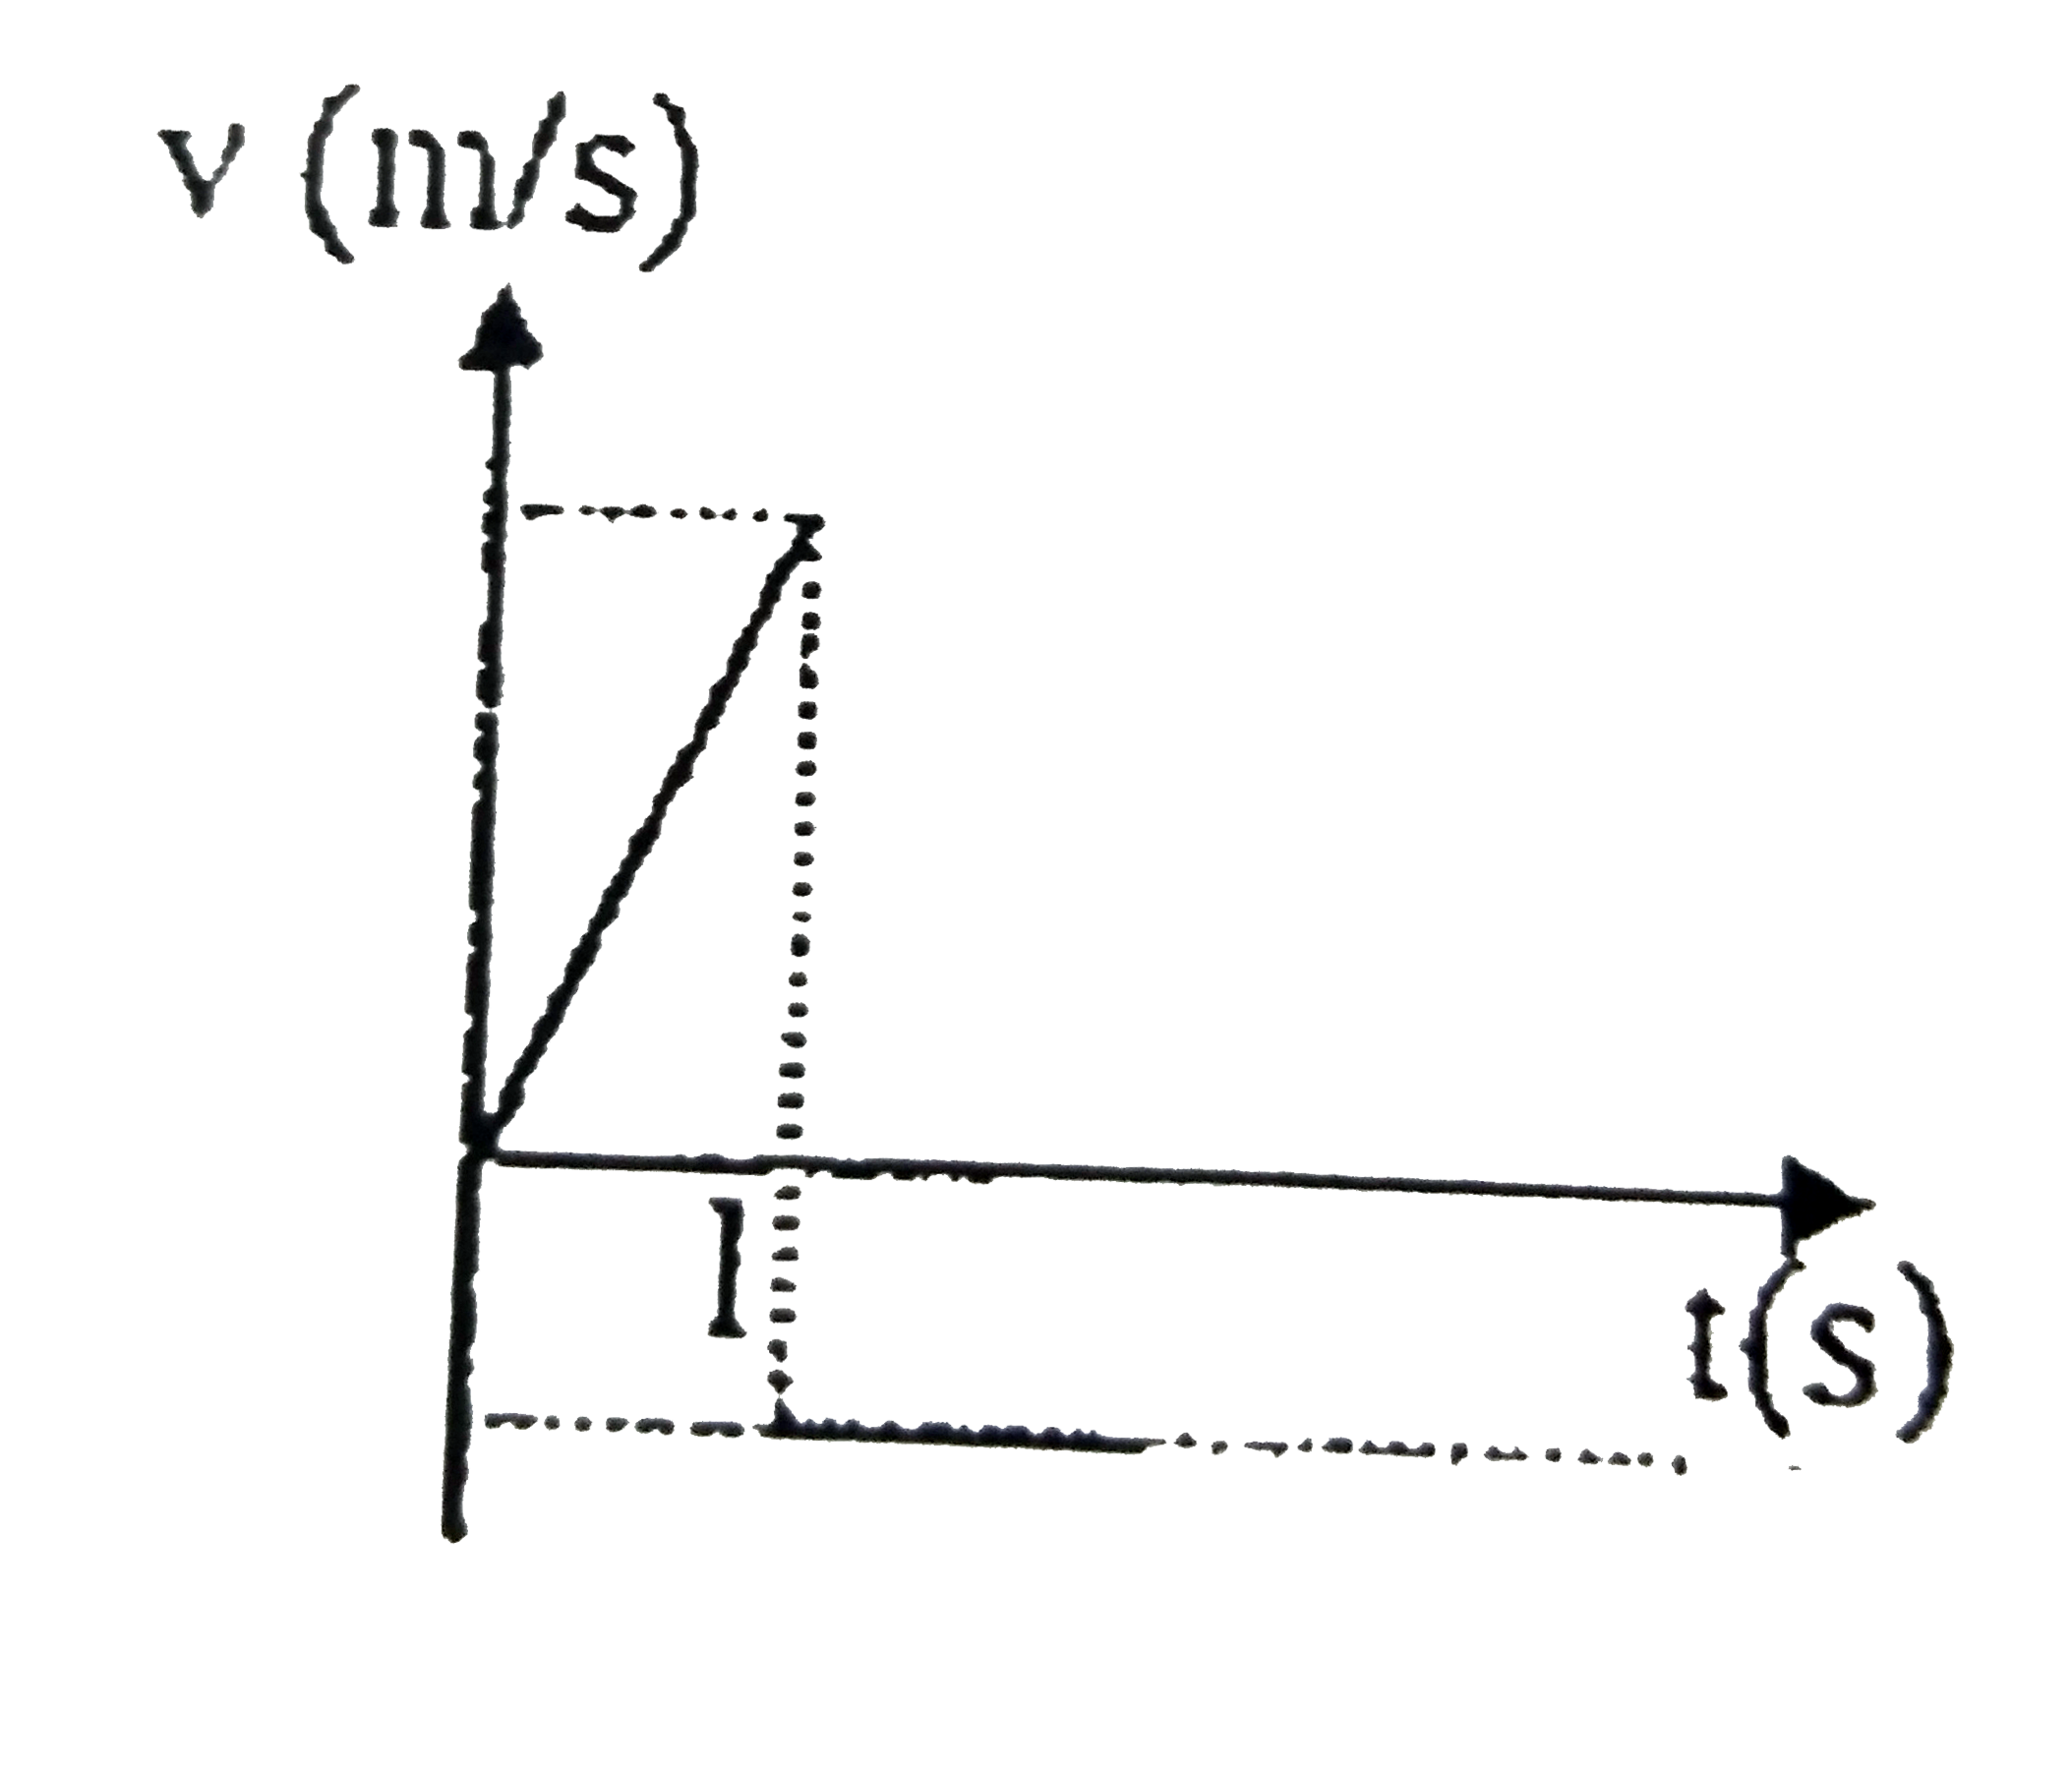
View SolutionThe velocity time graph for a particle moving along X-axis is shown in the figure. The corresponding displacement time graph is correctly shown by
View Solution
