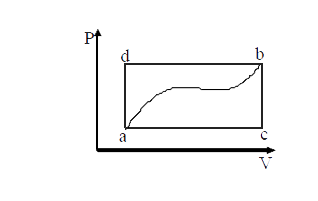
In the adjoined figure the indicator diagram of an ideal thermodynamic gas system is represented. If the change in internal energy along the path acb is 10 calorie then change in internal energy along the path bda will be

20 cal
10 cal
30 cal
−10 cal
The correct Answer is:C
Step by step video, text & image solution for In the adjoined figure the indicator diagram of an ideal thermodynamic gas system is represented. If the change in internal energy along the path acb is 10 calorie then change in internal energy along the path bda will be by Physics experts to help you in doubts & scoring excellent marks in Class 12 exams.
Updated on:21/07/2023Topper's Solved these Questions
- ThermodynamicsBOOK - MOTIONCHAPTER - ThermodynamicsEXERCISE - EXERCISE - 2
40 Videos
- ThermodynamicsBOOK - MOTIONCHAPTER - ThermodynamicsEXERCISE - EXERCISE - 3 SECTION - A
49 Videos
- ThermodynamicsBOOK - MOTIONCHAPTER - ThermodynamicsEXERCISE - Solved Example
10 Videos
- SURFACE TENSION & VISCOSITY BOOK - MOTIONCHAPTER - SURFACE TENSION & VISCOSITY EXERCISE - Exercise - 4 | Level-II Previous Year | JEE Advanced
12 Videos
- UNIT & DIMENSIONSBOOK - MOTIONCHAPTER - UNIT & DIMENSIONSEXERCISE - Exercise - 4 (Level - II) (PREVIOUS YEAR JEE ADVANCED)
10 Videos
Similar Questions
Knowledge Check
The change in the internal energy of a substance
AIncrease with increase in temperatureBDecrease with increase in temperatureCCan be calculated the relation E=mc2DRemains unaffected with change in temperatureIn the above question, change in internal energy of gas is
A−2660.23JB−2777.23JC−2767.23JD−2600JIn the above question, change in internal energy of gas is
A−2660.23JB−2777.23JC−2767.23JD−2600J
In a thermodynamic system working substance is ideal gas, its internal energy is in the form of
View SolutionInternal energy of ideal gas depends on
View SolutionChange in internal energy in an isothermal process for ideal gas is
View SolutionInternal energy of an ideal gas changes with change in its
View SolutionFor a thermodynamic process δQ=–50 calorie and W = – 20 calorie. If the initial internal energy is – 30 calorie then final internal energy will be -
View Solution

