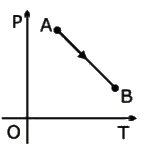
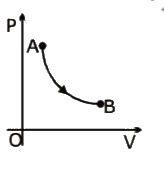
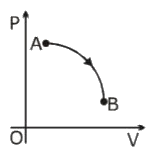
During which of the following thermodynamic process represented by PV diagram the heat energy absorbed by system may be equal to area under PV graph?


All of these
The correct Answer is:D
To solve the problem, we need to analyze the relationship between heat energy absorbed by the system and the area under the PV graph during different thermodynamic processes. We will follow these steps:
1. Understand the First Law of Thermodynamics:
The first law of thermodynamics states that the change in internal energy (ΔU) of a system is equal to the heat added to the system (ΔQ) minus the work done by the system (W). Mathematically, it can be expressed as:
ΔQ=ΔU+W
2. Identify Work Done in a PV Diagram:
The work done by the system during a thermodynamic process is represented by the area under the PV graph. Therefore, if we denote the area under the curve as W, we can rewrite the first law as:
ΔQ=ΔU+Area under PV graph
3. Condition for Heat Absorbed to Equal Work Done:
For the heat energy absorbed (ΔQ) to be equal to the area under the PV graph (W), the change in internal energy (ΔU) must be zero:
ΔQ=WwhenΔU=0
4. Determine When ΔU is Zero:
The change in internal energy (ΔU) for an ideal gas is given by:
ΔU=nCvΔT
where n is the number of moles, Cv is the specific heat at constant volume, and ΔT is the change in temperature. For ΔU to be zero, ΔT must also be zero, which implies that the temperature remains constant.
5. Identify the Thermodynamic Process:
The only thermodynamic process where the temperature remains constant is the isothermal process. In this process, the internal energy of an ideal gas does not change because it is a function of temperature.
6. Analyze the PV Graph:
In an isothermal process, the relationship between pressure (P) and volume (V) can be described by Boyle's Law, which states that PV=constant. This means that pressure is inversely proportional to volume:
P∝1V
This relationship is represented graphically as a hyperbolic curve on the PV diagram.
7. Conclusion:
Based on the analysis, the heat energy absorbed by the system is equal to the area under the PV graph during the isothermal process.
Final Answer:
The correct answer is the isothermal process.
---
The first law of thermodynamics states that the change in internal energy (ΔU) of a system is equal to the heat added to the system (ΔQ) minus the work done by the system (W). Mathematically, it can be expressed as:
ΔQ=ΔU+W
The work done by the system during a thermodynamic process is represented by the area under the PV graph. Therefore, if we denote the area under the curve as W, we can rewrite the first law as:
ΔQ=ΔU+Area under PV graph
For the heat energy absorbed (ΔQ) to be equal to the area under the PV graph (W), the change in internal energy (ΔU) must be zero:
ΔQ=WwhenΔU=0
The change in internal energy (ΔU) for an ideal gas is given by:
ΔU=nCvΔT
where n is the number of moles, Cv is the specific heat at constant volume, and ΔT is the change in temperature. For ΔU to be zero, ΔT must also be zero, which implies that the temperature remains constant.
The only thermodynamic process where the temperature remains constant is the isothermal process. In this process, the internal energy of an ideal gas does not change because it is a function of temperature.
In an isothermal process, the relationship between pressure (P) and volume (V) can be described by Boyle's Law, which states that PV=constant. This means that pressure is inversely proportional to volume:
P∝1V
This relationship is represented graphically as a hyperbolic curve on the PV diagram.
Based on the analysis, the heat energy absorbed by the system is equal to the area under the PV graph during the isothermal process.
The correct answer is the isothermal process.
Topper's Solved these Questions
- ThermodynamicsBOOK - MOTIONCHAPTER - ThermodynamicsEXERCISE - EXERCISE - 3 SECTION - A
49 Videos
- ThermodynamicsBOOK - MOTIONCHAPTER - ThermodynamicsEXERCISE - EXERCISE - 3 SECTION
1 Videos
- ThermodynamicsBOOK - MOTIONCHAPTER - ThermodynamicsEXERCISE - EXERCISE - 1
55 Videos
- SURFACE TENSION & VISCOSITY BOOK - MOTIONCHAPTER - SURFACE TENSION & VISCOSITY EXERCISE - Exercise - 4 | Level-II Previous Year | JEE Advanced
12 Videos
- UNIT & DIMENSIONSBOOK - MOTIONCHAPTER - UNIT & DIMENSIONSEXERCISE - Exercise - 4 (Level - II) (PREVIOUS YEAR JEE ADVANCED)
10 Videos
Similar Questions
Knowledge Check
In which of the following processes energy is absorbed?
ACl+e−→Cl−BO−+e−→O2−CO2−−e−→O−DNa++e−→NaIn which of the following processes energy is absorbed ?
ACl(g)+e−→Cl−(g)BF−(g)+e−→F−2(g)CNa+(g)+e−→Na(g)DMg+2(g)+e−→Mg+(g)In which of the following processes energy is absorbed ?
ACl(g)+e−→Cl−(g)BF−(g)+e−→F2−(g)CNa+(g)+e−→Na(g)DMg2+(g)+e−→Mg+(g)
For which of the following processes will energy be absorbed?
View SolutionIn which of the following processes, heat is neither absorbed nor released by a system?
View SolutionWhich of the following P-V diagram represent the graph of isometric process?
View Solution
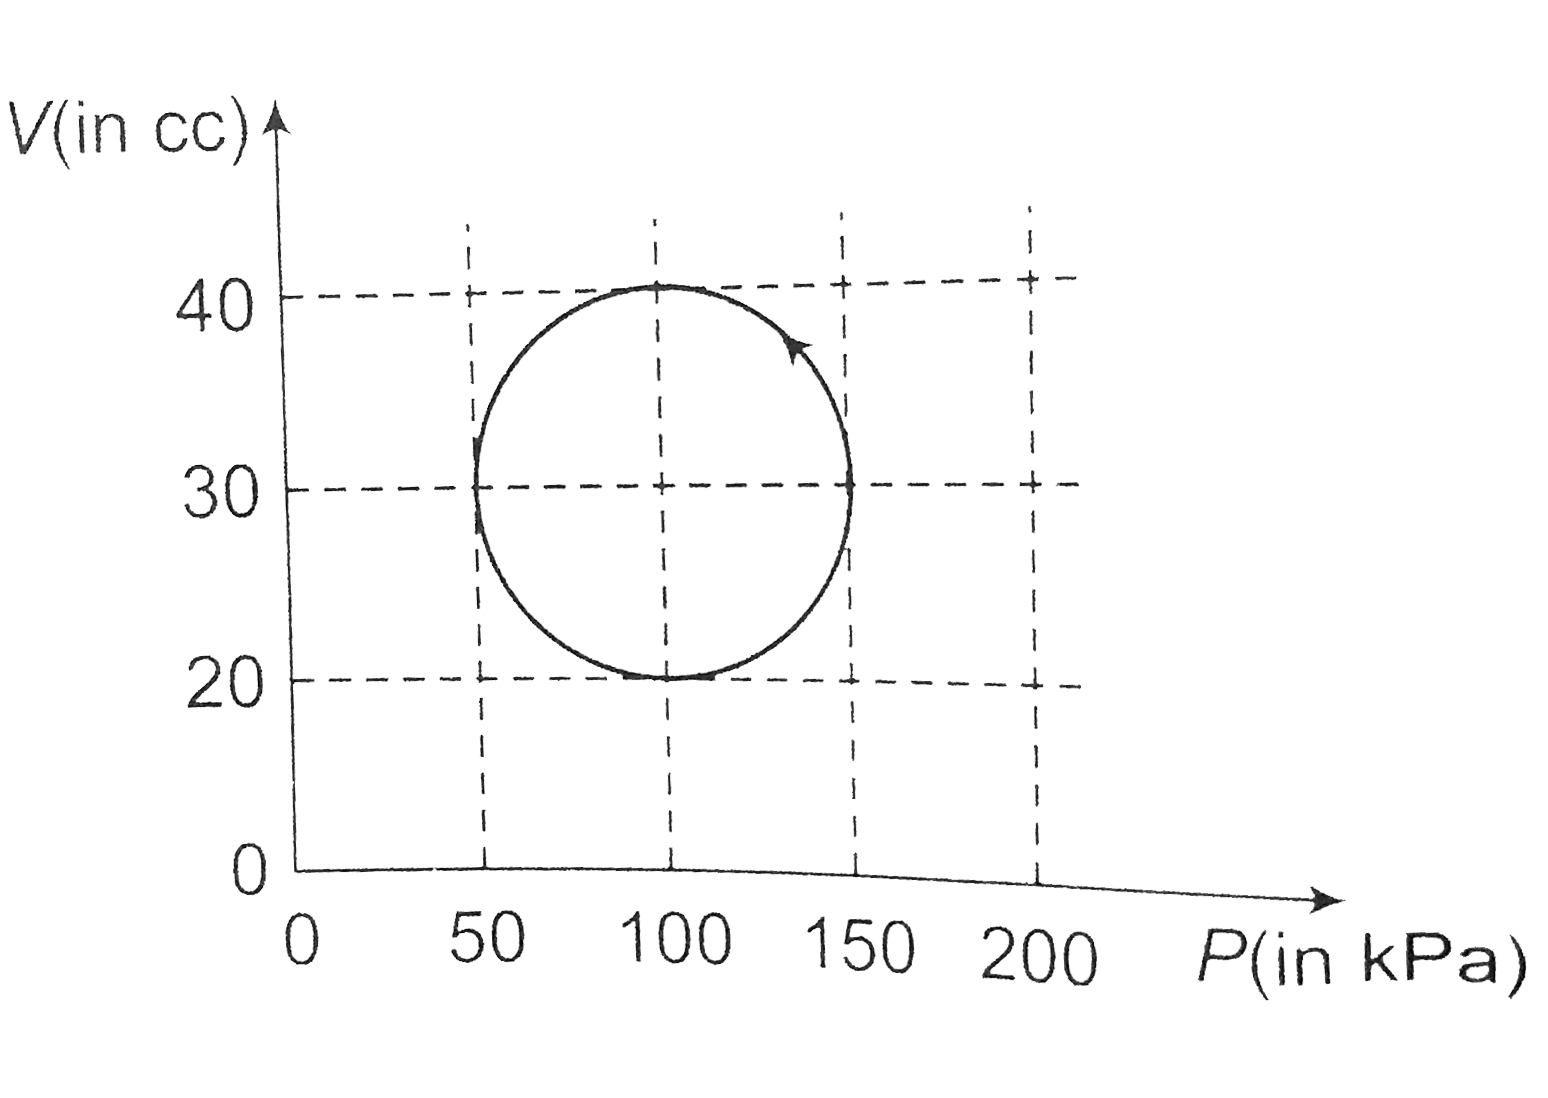
A system is taken through a cyclic process represented by a circle as shown in the figure. The heat absorbed by the system is
View SolutionThe work done in which of the following processes is equal to the internal energy of the system ?
View Solution
