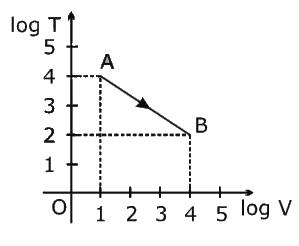
Figure shows, the adiabatic curve on a log T and log V scale performed on ideal gas. The gas is -

A
Monatomic
B
Diatomic
C
Polyatomic
D
Mixture of monatomic and diatomic
Video Solution
Text Solution
The correct Answer is:A
|
Answer
Step by step video, text & image solution for Figure shows, the adiabatic curve on a log T and log V scale performed on ideal gas. The gas is - by Physics experts to help you in doubts & scoring excellent marks in Class 12 exams.
Updated on:21/07/2023Topper's Solved these Questions
- ThermodynamicsBOOK - MOTIONCHAPTER - ThermodynamicsEXERCISE - EXERCISE - 3 SECTION - A
49 Videos
- ThermodynamicsBOOK - MOTIONCHAPTER - ThermodynamicsEXERCISE - EXERCISE - 3 SECTION
1 Videos
- ThermodynamicsBOOK - MOTIONCHAPTER - ThermodynamicsEXERCISE - EXERCISE - 1
55 Videos
- SURFACE TENSION & VISCOSITY BOOK - MOTIONCHAPTER - SURFACE TENSION & VISCOSITY EXERCISE - Exercise - 4 | Level-II Previous Year | JEE Advanced
12 Videos
- UNIT & DIMENSIONSBOOK - MOTIONCHAPTER - UNIT & DIMENSIONSEXERCISE - Exercise - 4 (Level - II) (PREVIOUS YEAR JEE ADVANCED)
10 Videos
Similar Questions
Knowledge Check
Figure shows the adiabatic curve on log-log scale performed on a ideal gas. The gas must be:-
_S01_085_Q01.png) AMonoatomicBDiatomicCA mixture of monoatomic and diatomicDA mixture of diatomic and polyatomic
AMonoatomicBDiatomicCA mixture of monoatomic and diatomicDA mixture of diatomic and polyatomicFigure shows the adiabatic curve for n moles of an ideal gas, the bulk modulus for the gas corresponding to the point P will be
 A5nRT03V0BnR(2+T0V0)CnR(1+T0V0)D2nRT0V0
For the adiabatic expansion of an ideal gas:
APVγ= constantBTVγ−1= constantCTγP1−γ= constantDNone of these

