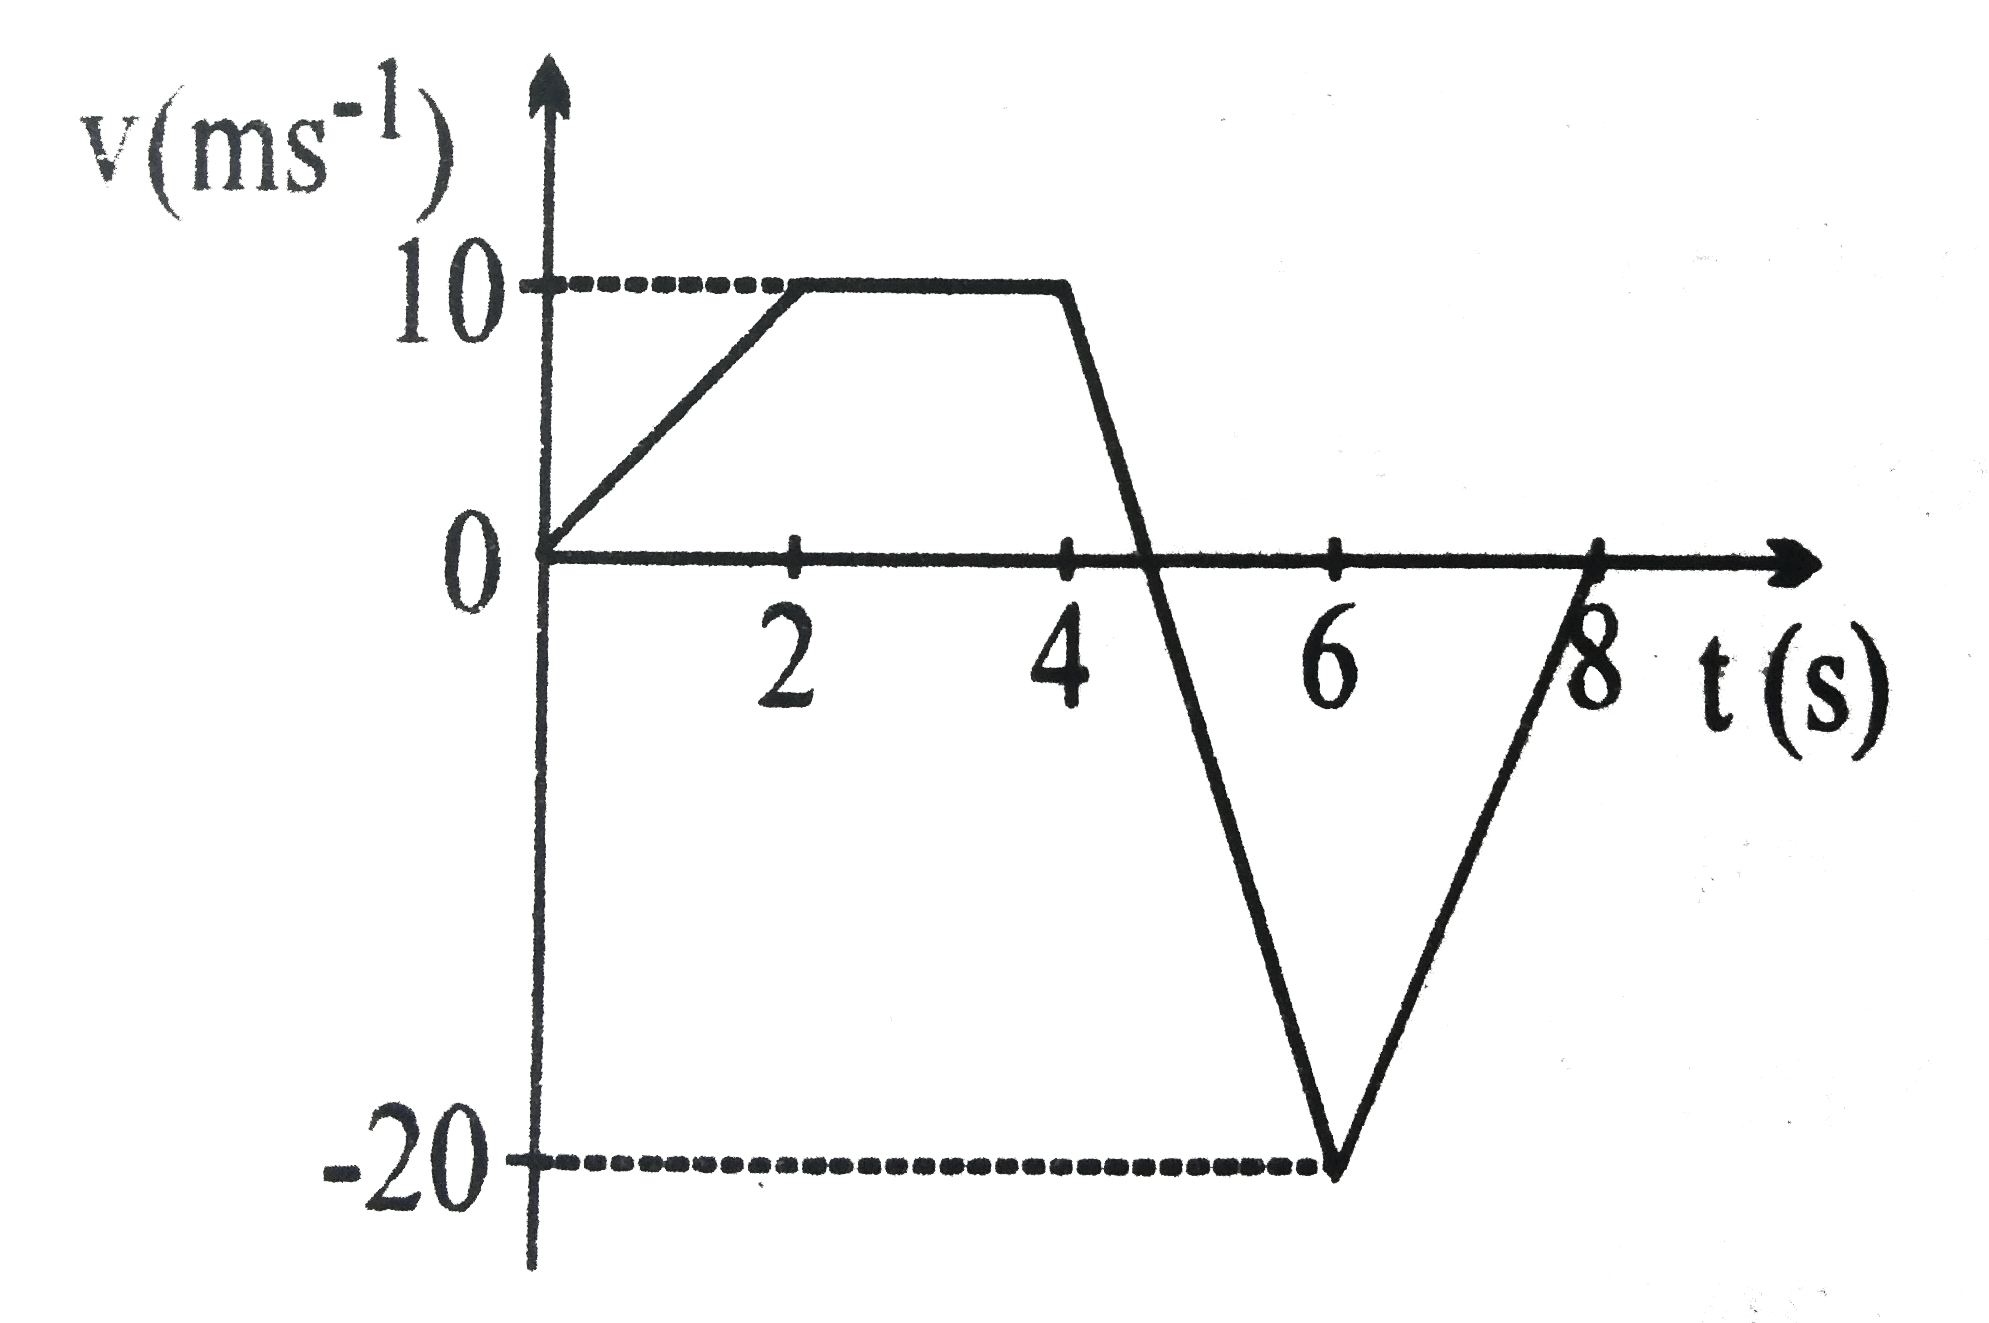
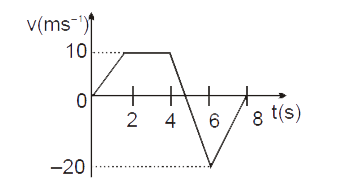
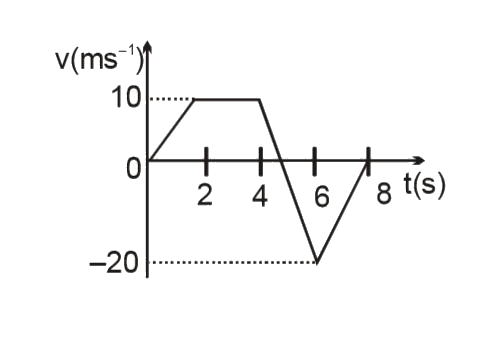
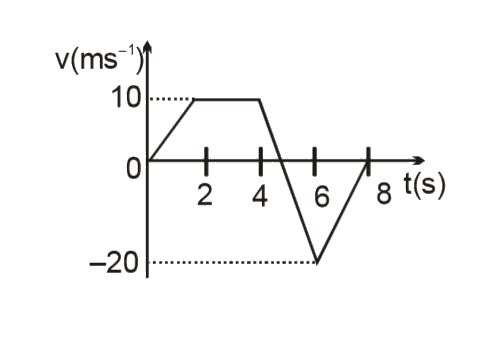
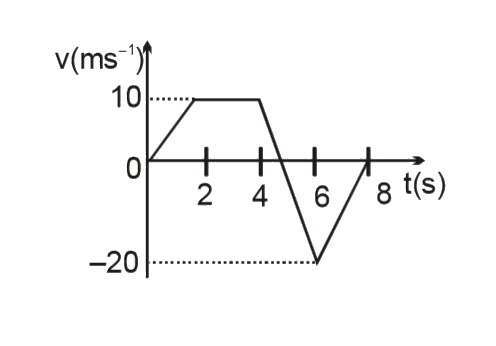
The figure shows a velocity-time graph of a particle moving along a straight line
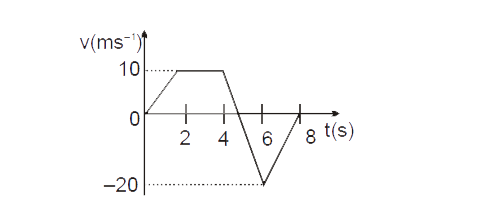
Identify the region in which the rate of change of velocity ∣∣∣Δ¯vΔt∣∣∣ of the particle is maximum
0 to 2s
2 to 4s
4 to 6s
6 t 8 s
The correct Answer is:C
Step by step video, text & image solution for The figure shows a velocity-time graph of a particle moving along a straight line Identify the region in which the rate of change of velocity |(Delta barv)/(Delta t)| of the particle is maximum by Physics experts to help you in doubts & scoring excellent marks in Class 12 exams.
Updated on:21/07/2023Topper's Solved these Questions
- ONE DIMENSION MOTIONBOOK - MOTIONCHAPTER - ONE DIMENSION MOTIONEXERCISE - EXERCSE -2 (Section - D : Relative Motion)
3 Videos
- ONE DIMENSION MOTIONBOOK - MOTIONCHAPTER - ONE DIMENSION MOTIONEXERCISE - EXERCSE -2 (Section - E : River Boat Problems)
3 Videos
- ONE DIMENSION MOTIONBOOK - MOTIONCHAPTER - ONE DIMENSION MOTIONEXERCISE - EXERCSE -2 (Section - B : Motion under Gravity)
8 Videos
- NLM & FRICTIONBOOK - MOTIONCHAPTER - NLM & FRICTIONEXERCISE - EXERCISE-4 ( LEVEL-II)
15 Videos
- OPTICSBOOK - MOTIONCHAPTER - OPTICSEXERCISE - Exercise
45 Videos
Similar Questions
Knowledge Check
The figure shows a velocity-time graph of a particle moving along a straight line
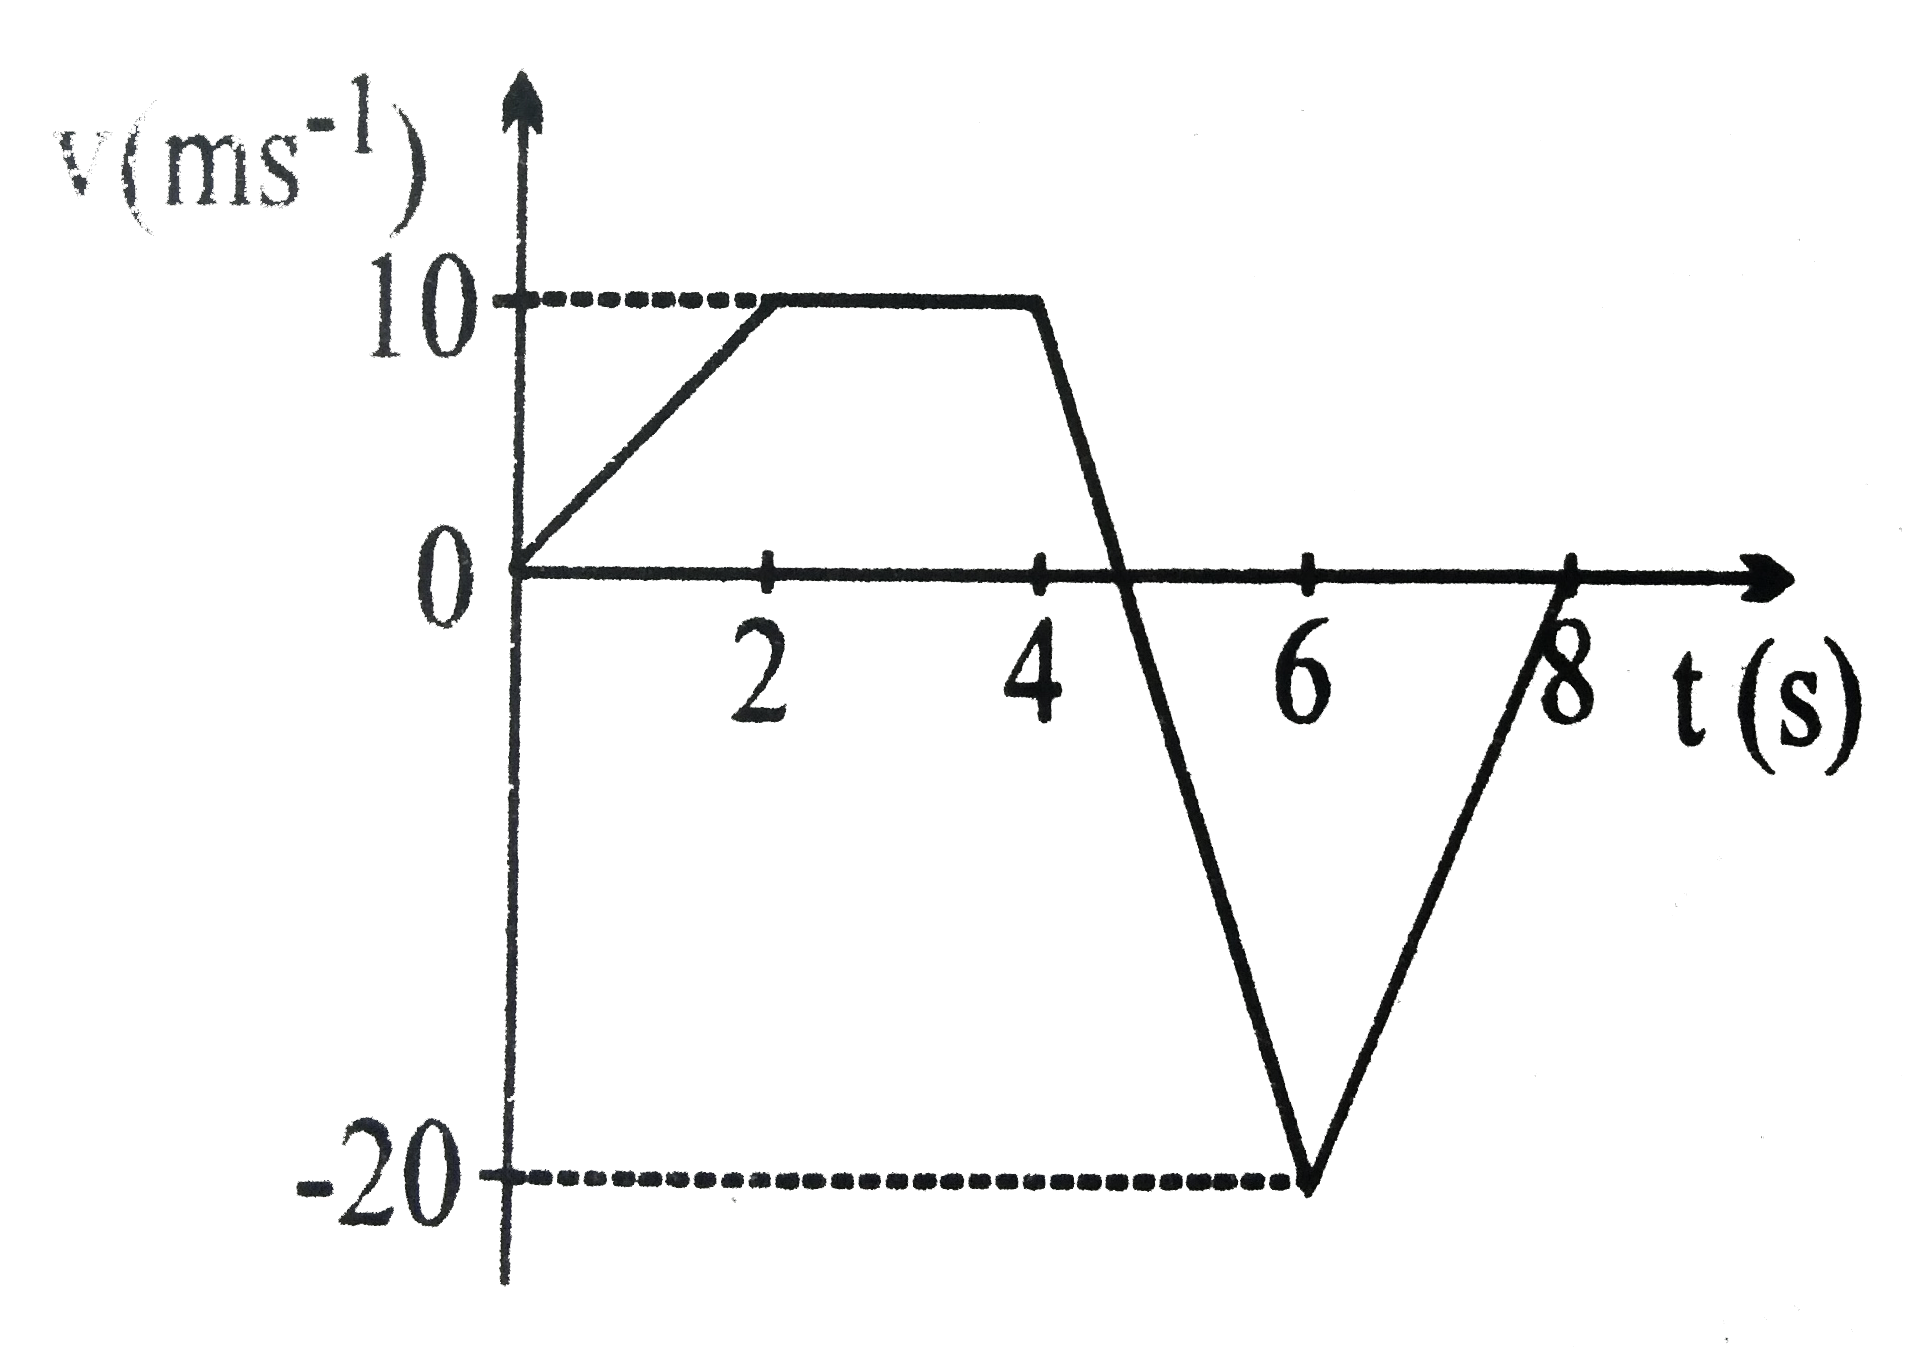
Identify the region in which the rate of change of velocity ∣∣∣Δ→vΔt∣∣∣ of the particle is maximumA0 to 2sB2to 4sC4 to 6sD6 to 8sThe figure shows a velocity-time graph of a particle moving along a straight line
Q. Identify the region in which the rate of change of velocity ∣∣∣Δ→vΔt∣∣∣ of the particle is maximumA0 to 2sB2 to 4sC4 to 6sD6 to 8sThe figure shows velocity-time graph of a particle moving along a straight line. Identify the correct statement.
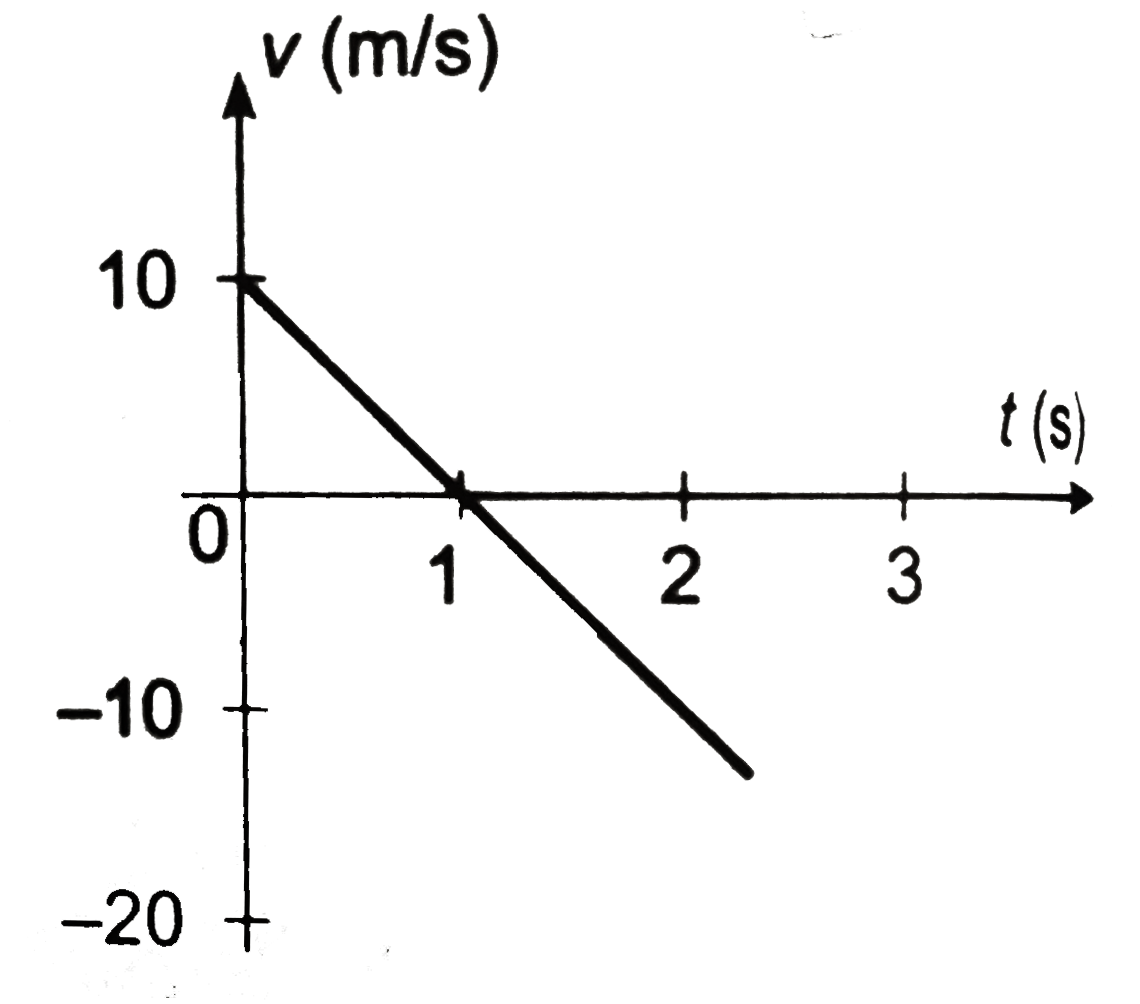 AThe particle starts from the originBThe particle crosses it initial position at t=2sCThe average speed of the particle in the time interval, 0≤t≤2s is zeroDAll of the above
The figure shows a velocity-time graph of a particle moving along a straight line
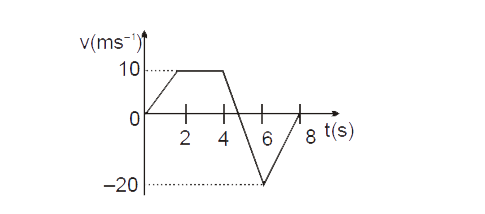
The total distance travelled by the particle is
View SolutionThe figure shows a velocity-time graph of a particle moving along a straight line
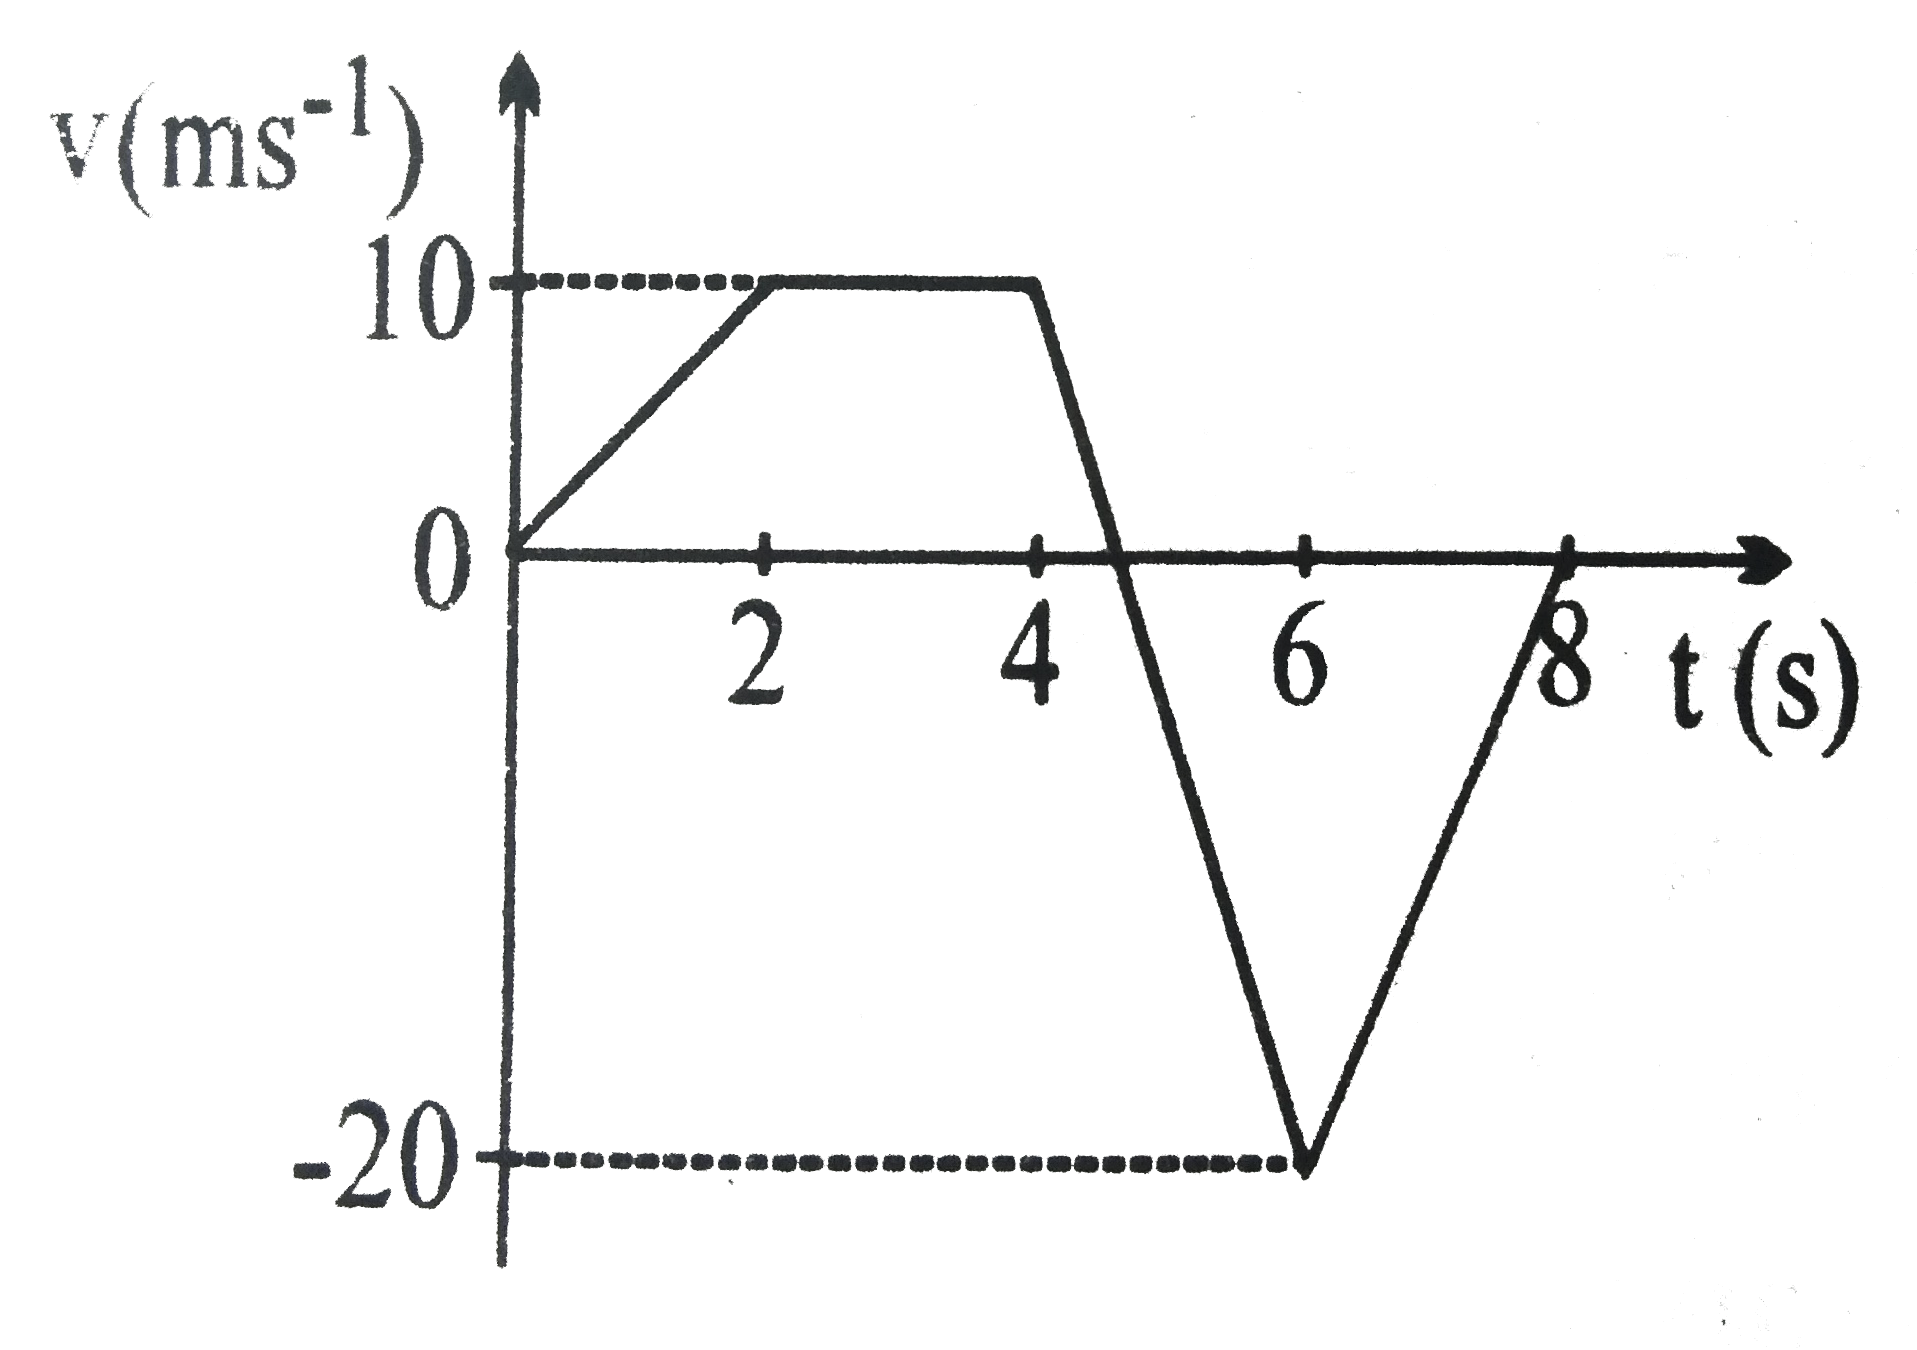
The total distance4 travelled by the particel is
View SolutionThe figure shows a velocity-time graph of a particle moving along a straight line
Q. The maximum of displacement of the particle is
View SolutionThe figure shows a velocity-time graph of a particle moving along a straight line
Q. The total distance travelled by the particle is
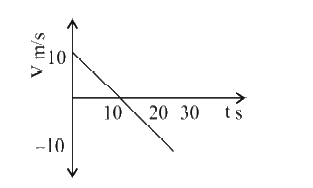
View SolutionThe velocity- time plot for a particle moving on a straight line is shown in the figure
View Solution

