Plot a graph between internal energy U and Temperature (T) of an ideal gas.
To plot a graph between internal energy (U) and temperature (T) of an ideal gas, we can follow these steps:
1. Understand the Relationship:
- For an ideal gas, the internal energy (U) is directly proportional to the temperature (T). This relationship can be expressed mathematically as:
U=nCvT
where n is the number of moles, and Cv is the molar heat capacity at constant volume.
2. Identify Variables:
- Here, the independent variable is temperature (T), and the dependent variable is internal energy (U).
3. Choose Values for Temperature:
- Select a range of temperature values (T). For example, you can choose values like 0 K, 100 K, 200 K, 300 K, 400 K, etc.
4. Calculate Internal Energy:
- For each selected temperature, calculate the corresponding internal energy using the formula U=nCvT. Assume a specific value for n and Cv for simplicity. For instance, let’s say n=1 mole and Cv=3R/2 (for a monatomic ideal gas).
5. Plot the Graph:
- On a graph, plot the temperature (T) on the x-axis and internal energy (U) on the y-axis. Since U is directly proportional to T, you will get a straight line starting from the origin (0,0) and sloping upwards.
6. Label the Graph:
- Clearly label the axes: the x-axis as "Temperature (T)" and the y-axis as "Internal Energy (U)". Indicate the proportional relationship with a straight line.
Final Graph:
- The graph will be a straight line passing through the origin, indicating that as the temperature increases, the internal energy of the ideal gas also increases linearly.
- For an ideal gas, the internal energy (U) is directly proportional to the temperature (T). This relationship can be expressed mathematically as:
U=nCvT
where n is the number of moles, and Cv is the molar heat capacity at constant volume.
- Here, the independent variable is temperature (T), and the dependent variable is internal energy (U).
- Select a range of temperature values (T). For example, you can choose values like 0 K, 100 K, 200 K, 300 K, 400 K, etc.
- For each selected temperature, calculate the corresponding internal energy using the formula U=nCvT. Assume a specific value for n and Cv for simplicity. For instance, let’s say n=1 mole and Cv=3R/2 (for a monatomic ideal gas).
- On a graph, plot the temperature (T) on the x-axis and internal energy (U) on the y-axis. Since U is directly proportional to T, you will get a straight line starting from the origin (0,0) and sloping upwards.
- Clearly label the axes: the x-axis as "Temperature (T)" and the y-axis as "Internal Energy (U)". Indicate the proportional relationship with a straight line.
- The graph will be a straight line passing through the origin, indicating that as the temperature increases, the internal energy of the ideal gas also increases linearly.
Topper's Solved these Questions
- BOOK - CBSE COMPLEMENTARY MATERIALCHAPTER - THERMODYNAMICS EXERCISE - SHORT ANSWER TYPE QUESTIONS (2 MARKS)11videos
THERMODYNAMICS
- BOOK - CBSE COMPLEMENTARY MATERIALCHAPTER - THERMODYNAMICS EXERCISE - SHORT ANSWER TYPE QUESTIONS (3 MARKS)10videos
THERMODYNAMICS
- BOOK - CBSE COMPLEMENTARY MATERIALCHAPTER - ROTATIONAL MOTION EXERCISE - MULTIPLE CHOICE QUESTIONS20videos
ROTATIONAL MOTION
- BOOK - CBSE COMPLEMENTARY MATERIALCHAPTER - WORK, ENERGY AND POWEREXERCISE - MCQ20videos
WORK, ENERGY AND POWER
Similar Questions
The relation between the internal energy (U) versus temeperature (T) for a 3 mole ideal gas in an isochoric process is given as U=α+βT where α and β are constant. If the specific heat capacity of the gas for above process is βm find the value of m.
View SolutionThe internal energy(U) ,pressure (P) and volume (V) of an ideal gas are related as U=3PV+4 .The gas is:
View Solution
Knowledge Check
- Question 1 - Select One
There are two samples A and B, which contains two different gases. Each sample has one mole of a gas. Graph between internal energy (E) and temperature (T) as shown in figure, then:
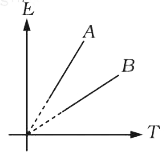 AA contains He, B contains N2BB contains N2, A contains O2CA contains CO2, B contains HeDA contains He, B contains CO2
 - Question 2 - Select One
The graph between the (velocity)2 and temperature T of a gas is
A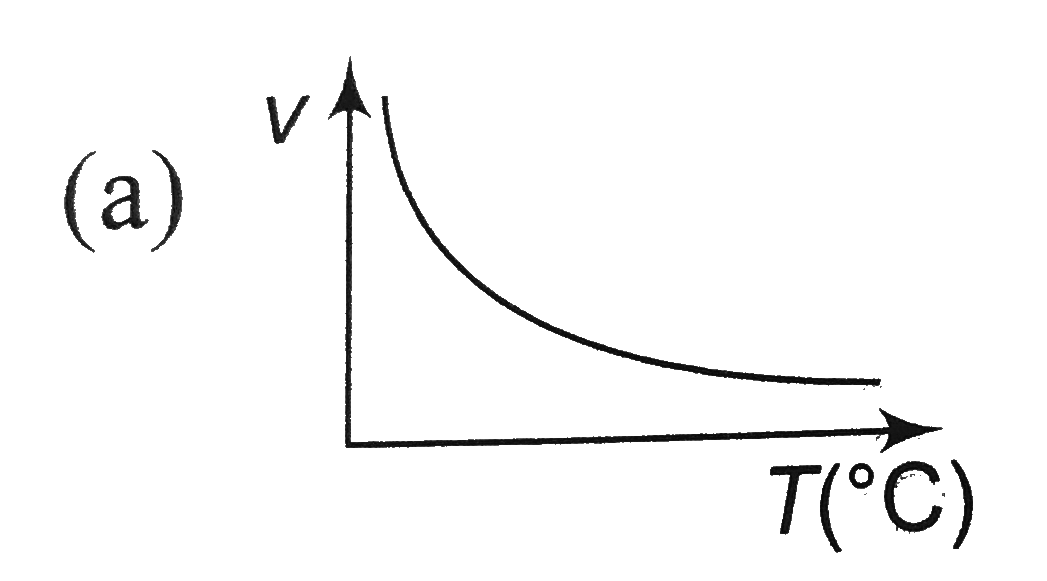 B
B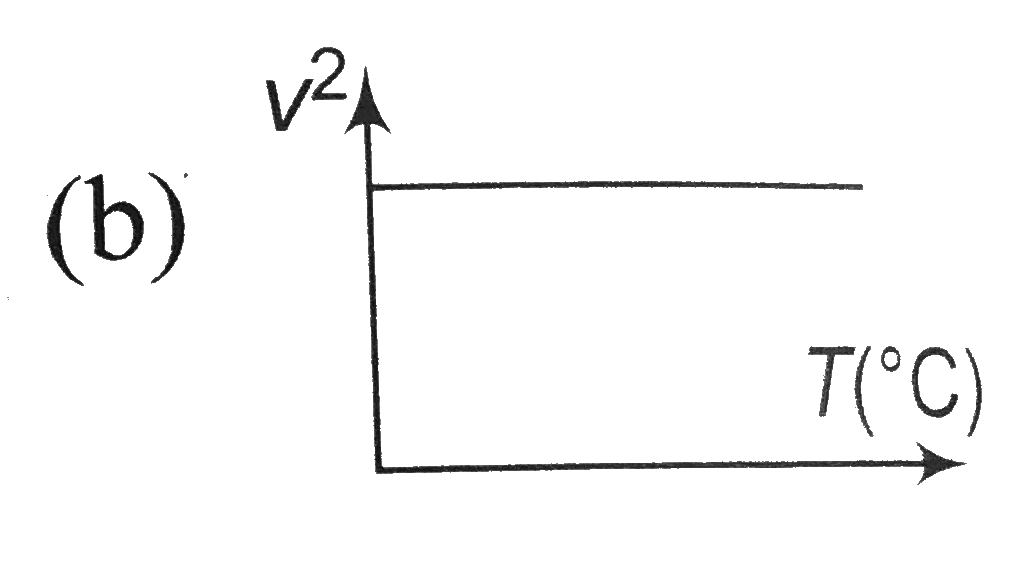 C
C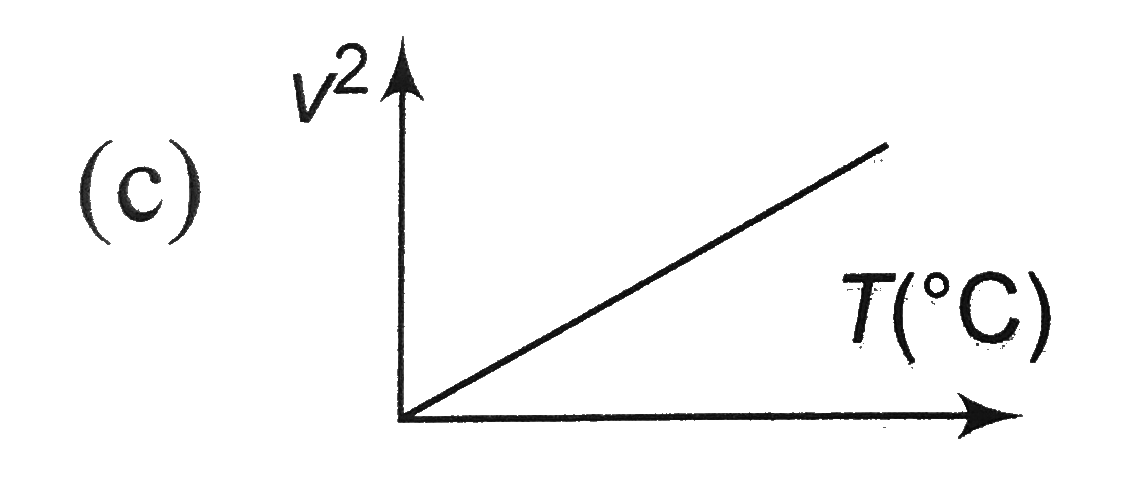 D
D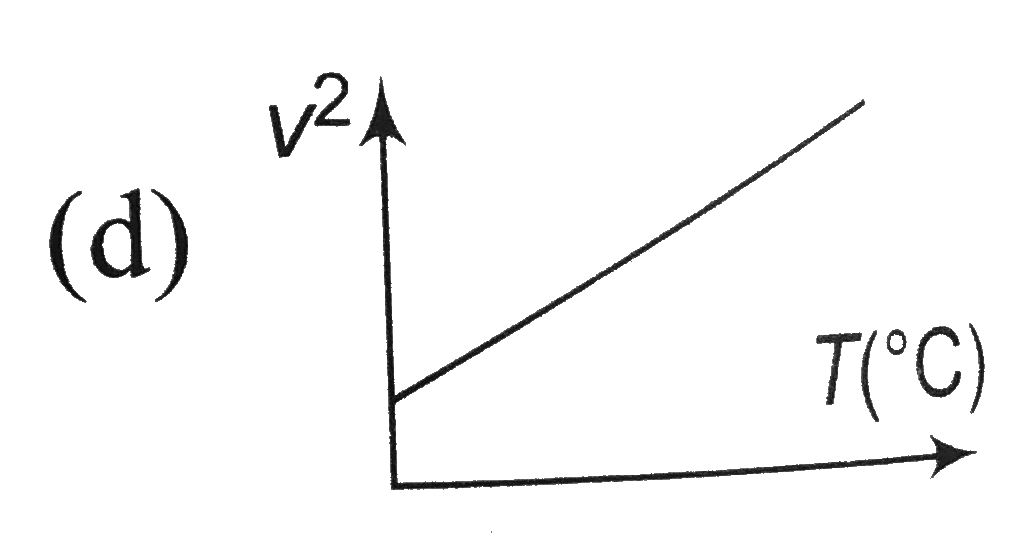
- Question 3 - Select One
The internal energy of one mole of ideal gas is
A32RTB12KTC12RTD32KT
Change in internal energy in an isothermal process for ideal gas is
View SolutionThe internal energy of one mole of ideal gas is
View SolutionThe internal energy (U), pressure (P) and volume (V) of an ideal gas are related as U=3PV+4. The gas is :-
View SolutionFor an ideal gas the relationship between internal energy change ΔU and enthalpy change ΔH is
View SolutionInternal energy of an ideal gas depends on :-
View Solution

