In an experiment, a boy plots a graph between for a simple pendulum for different values of (small) amplitudes, where and is the maximum velocity and the maximum acceleration respectively. He found the graph to be a straight line with a negative slope, making an angle of when the experiment was conducted on the earth surface. When the same experiment was conducted at a height h above the surface, the line was at an angle of . The value of h is [radius of the earth = R]
0.5R
0.24R
0.73R
R
The correct Answer is:C
Step by step video, text & image solution for In an experiment, a boy plots a graph between (v_(max))^(2)and (a_(max))^(2) for a simple pendulum for different values of (small) amplitudes, where v_(max)and a_(max) is the maximum velocity and the maximum acceleration respectively. He found the graph to be a straight line with a negative slope, making an angle of 30^(@) when the experiment was conducted on the earth surface. When the same experiment was conducted at a height h above the surface, the line was at an angle of 60^(@). The value of h is [radius of the earth = R] by Physics experts to help you in doubts & scoring excellent marks in Class 12 exams.
Topper's Solved these Questions
Similar Questions
Knowledge Check
- Question 1 - Select One
In Searl's experiment a graph is plotted between
Aload on hanger and radius of wireBload on hanger and mean value of spherometer screw readingCradius of the wire and spherometer screw readingDnone of these - Question 2 - Select One
if the maximum and minimum voltage of AM wave are Vmax and Vmin, respectively then modulation factor
Am=VmaxVmax+VminBm=VminVmax+VminCVmax+VminVmax−VminDVmax−VminVmax+Vmin. - Question 3 - Select One
In an experiment , to find the loss of energy with respect to time in case of swinging simple pendulum , the graph between (amplitude)2 and time is
A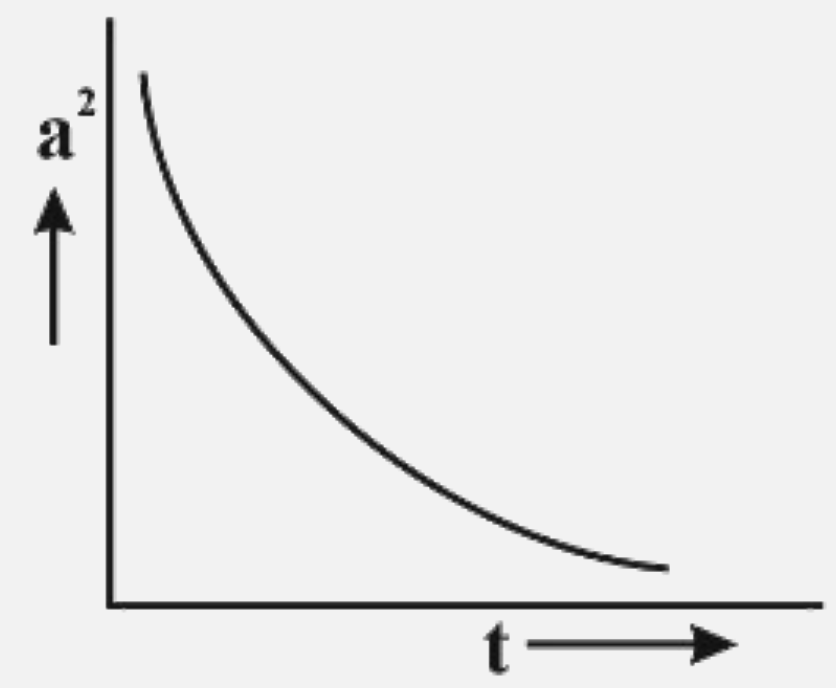 B
B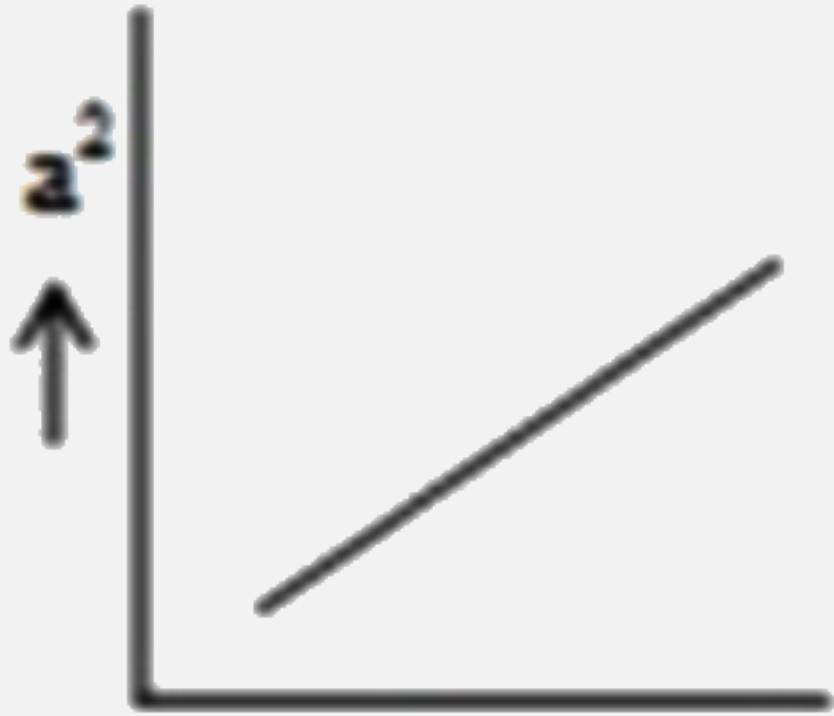 C
C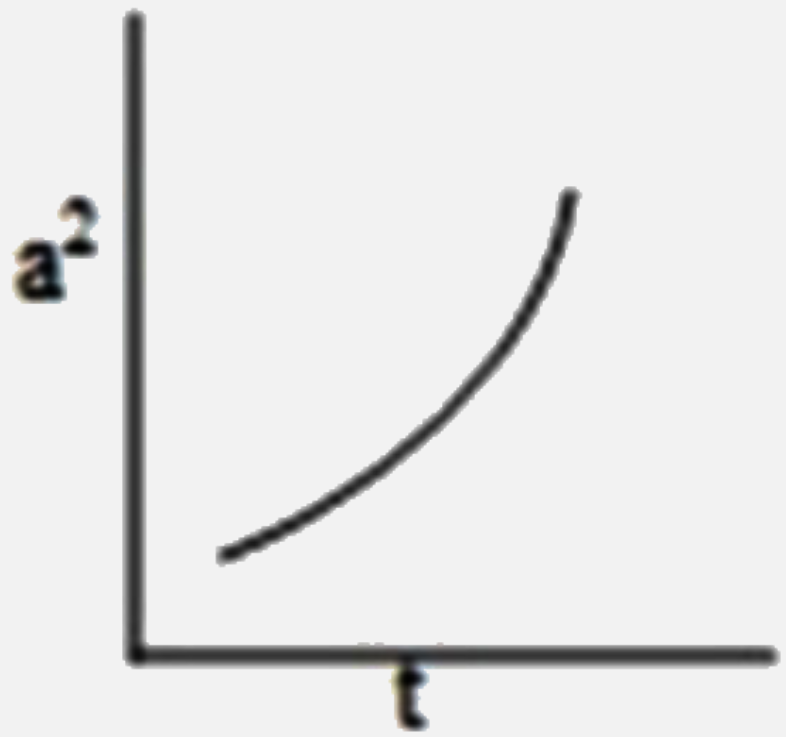 D
D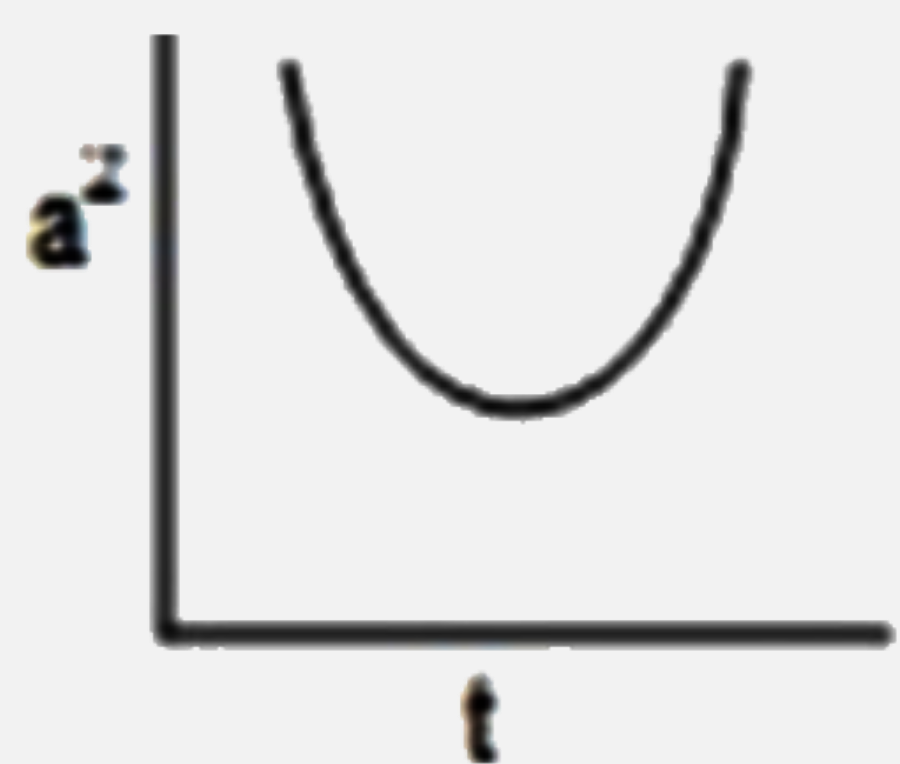
If the maximum and minimum voltages of an AM wave are Vmax.andVmin. respectively then modulation factor -
View SolutionTwo pendulums oscillates with a constant phase difference of 90∘ and same amplitude. The maximum velocity of one pendulum is v, then the maximum velocity of the other pendulum will be
View SolutionFor e.m. wave propagating along x-axis, Emax=30V/m. What is the maximum value of magnetic field?
View SolutionMax. concentration of Hb normally found in RBC :−
View Solution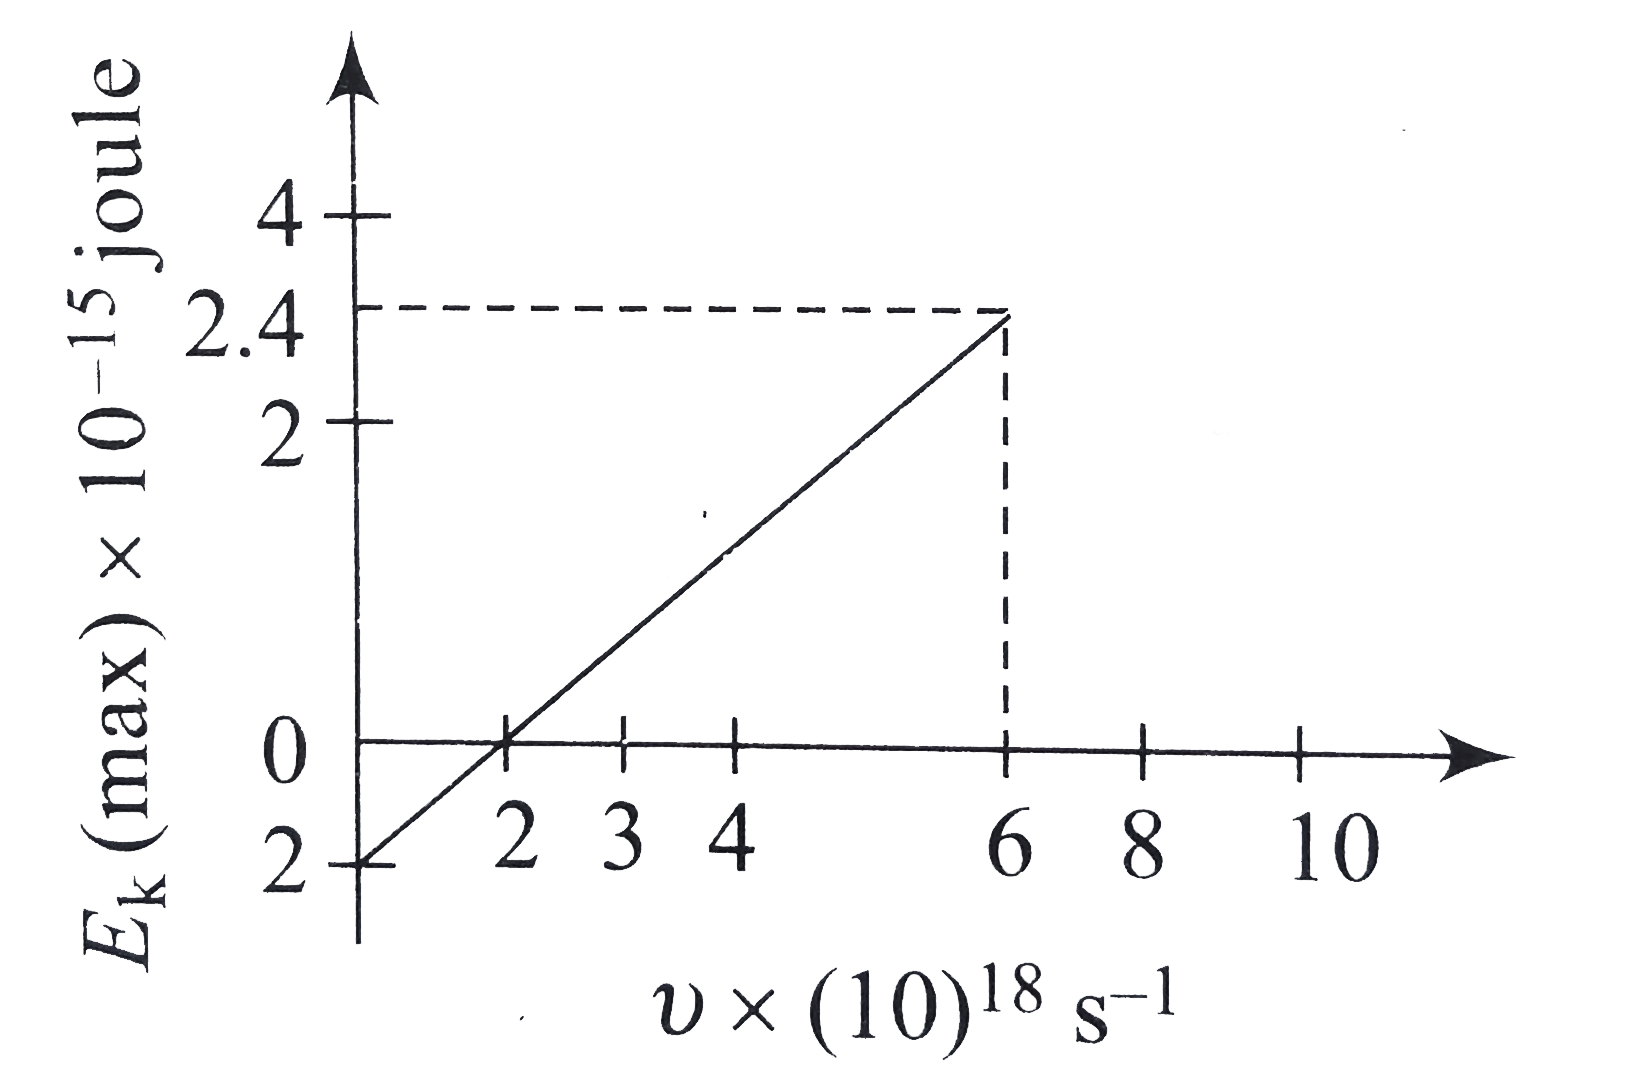
In the experiment on photoelectric effect, the graph between EK(max) and v is found to be a straight line as sshoen in fig. The threshold frequency and Planck's constant according to this graph areView Solution
