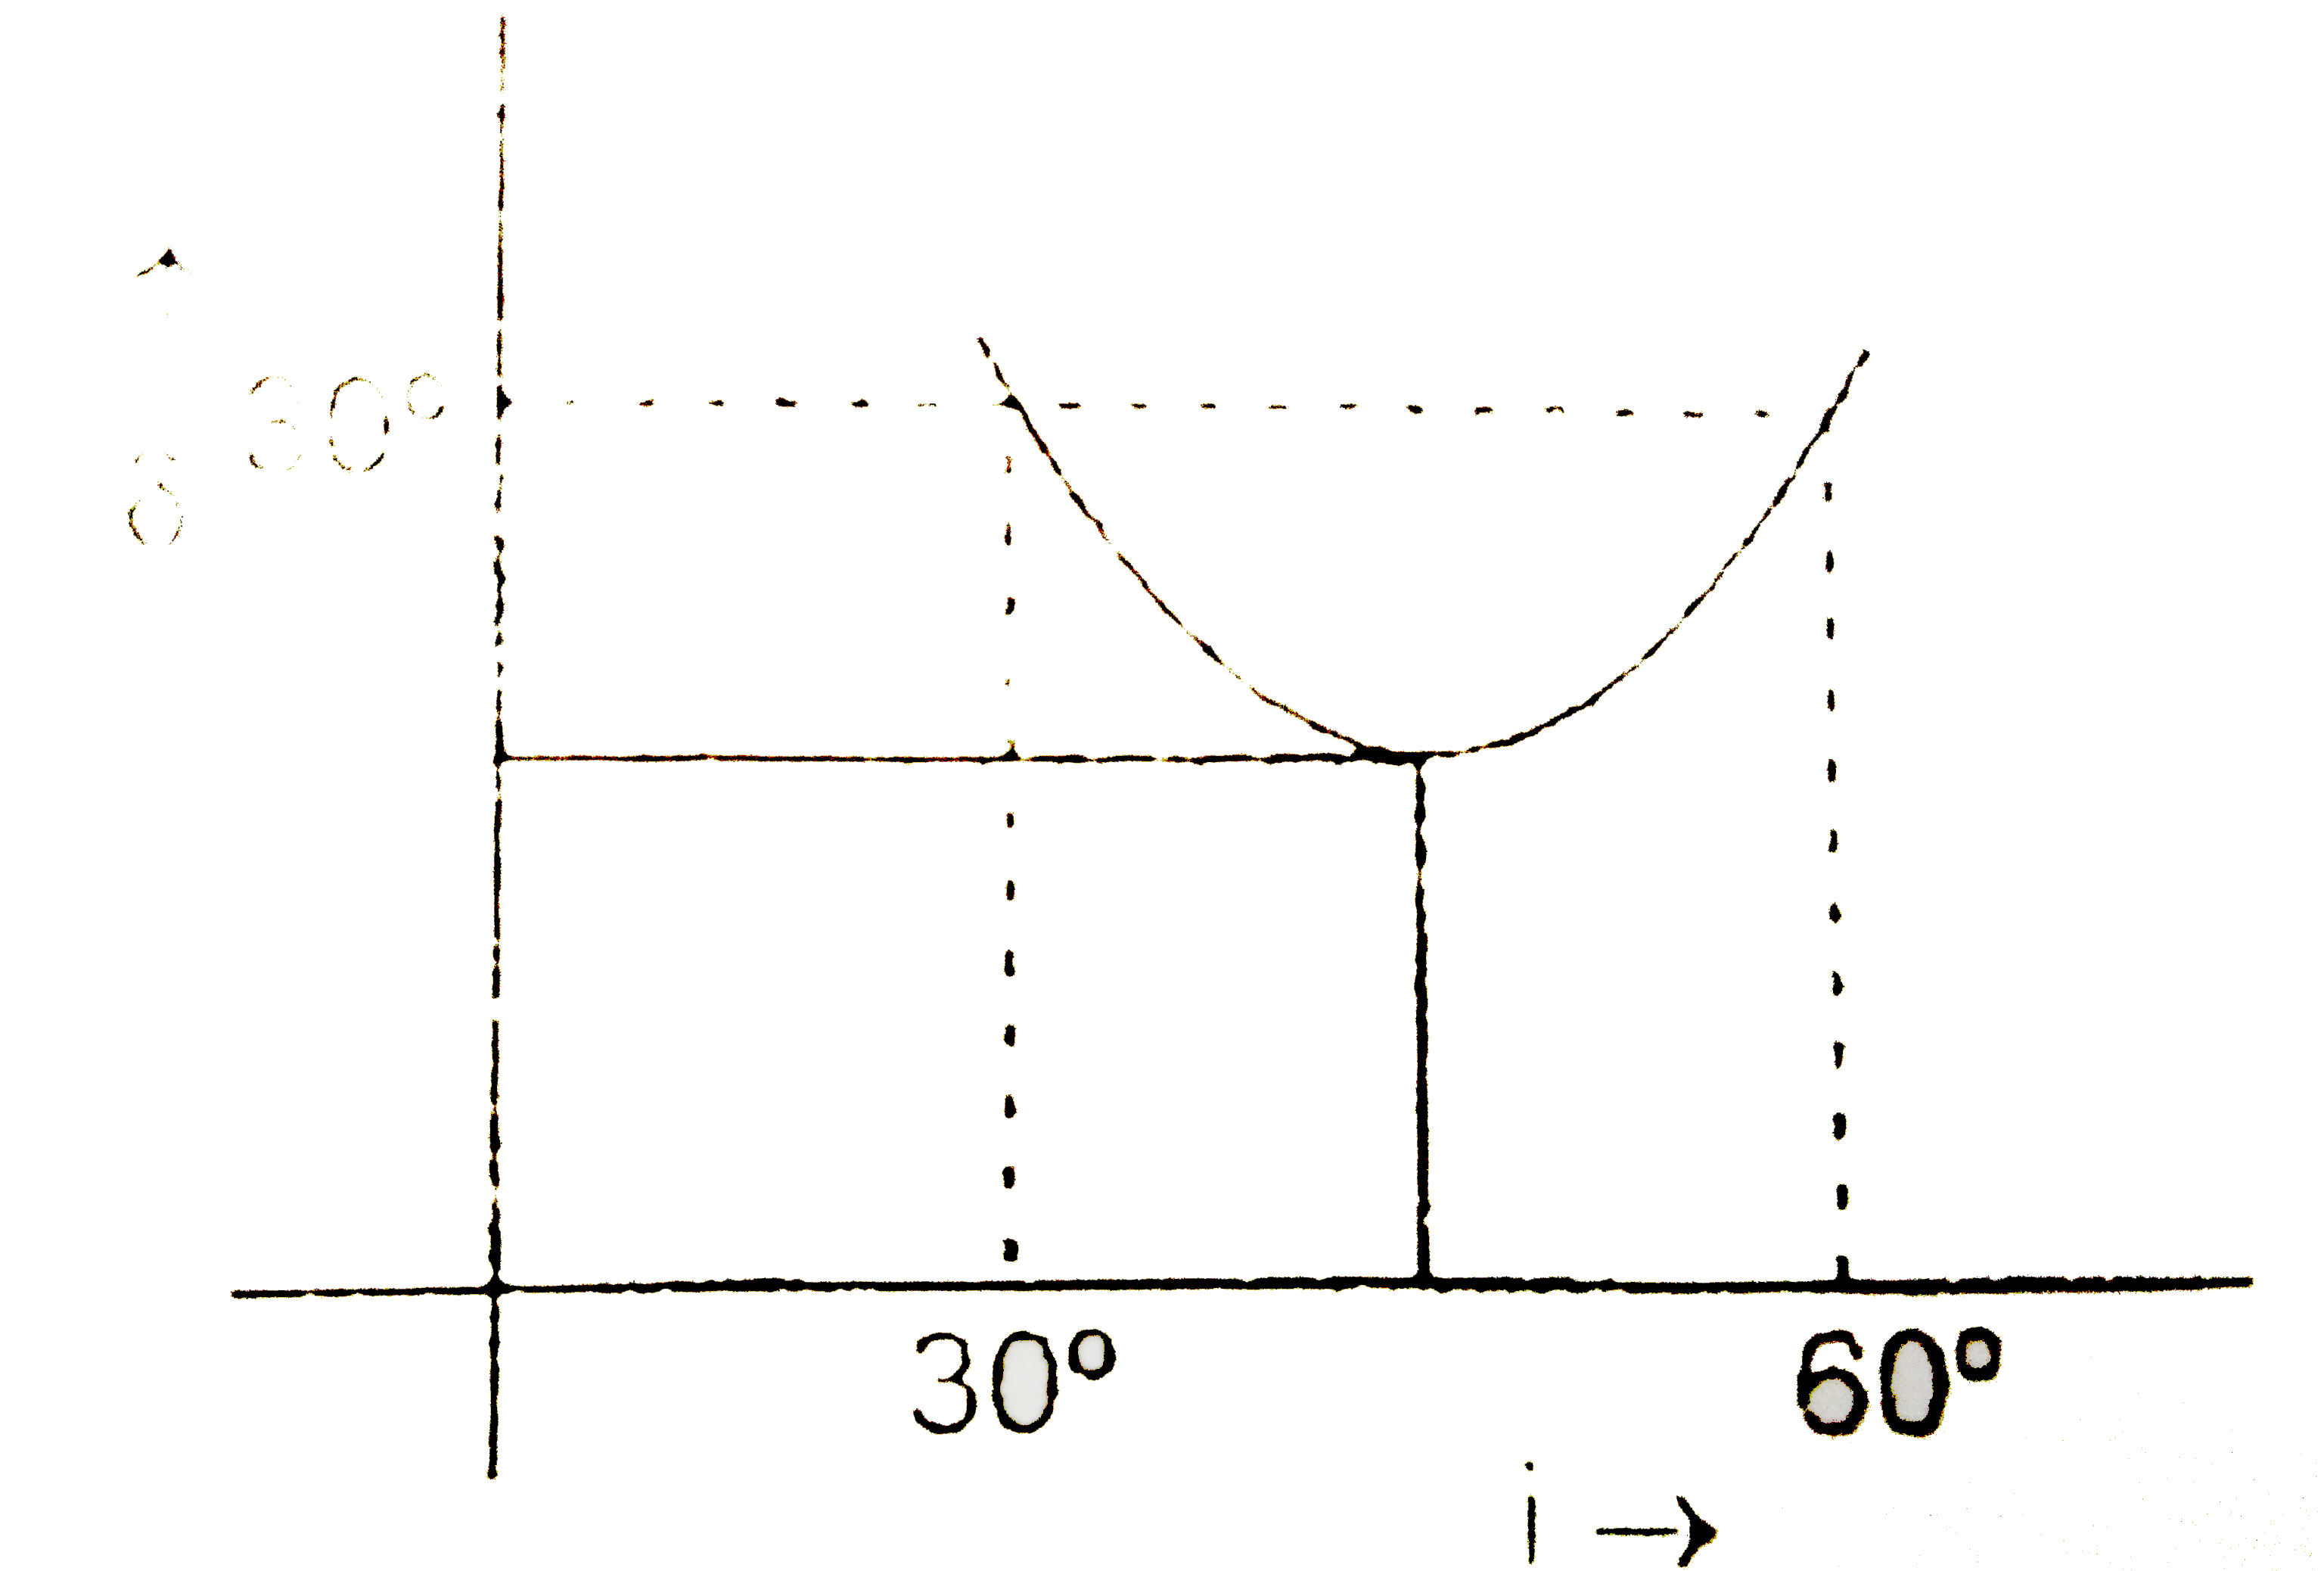
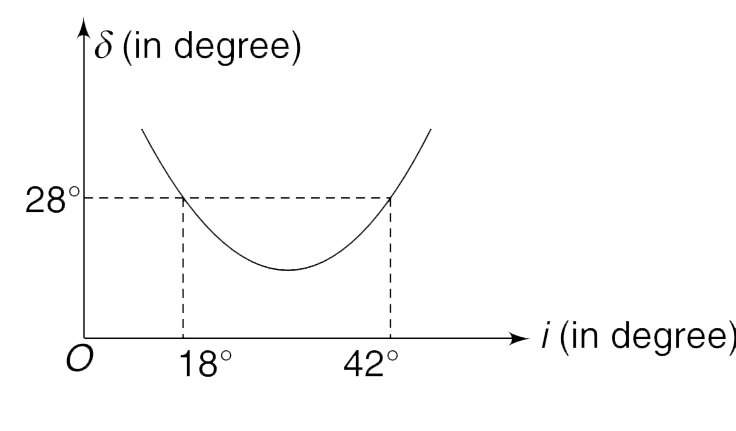
A graph is plotted between angle of deviation (δ) and angle of incidence (i) for a prism. The nearly correct graph is
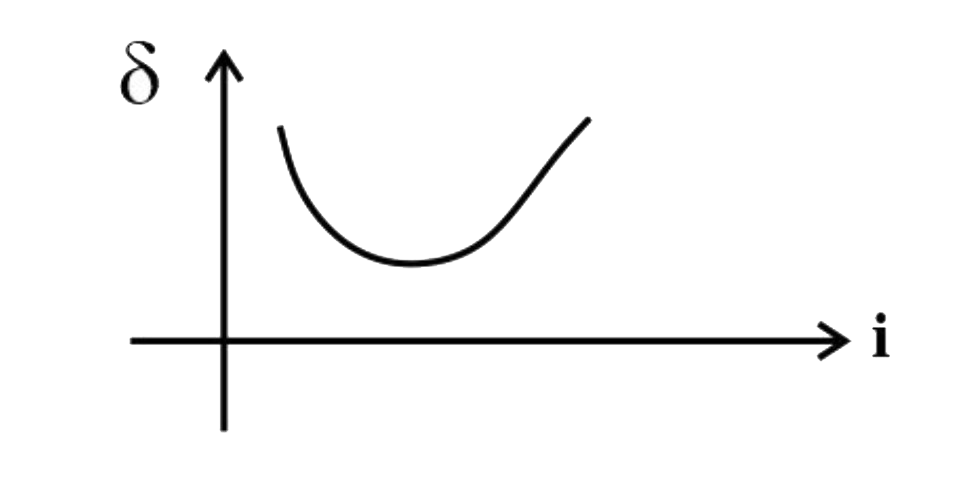
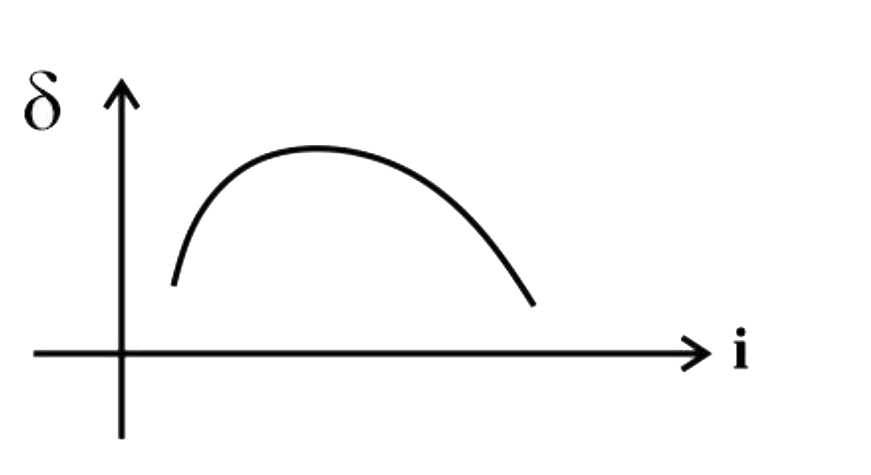
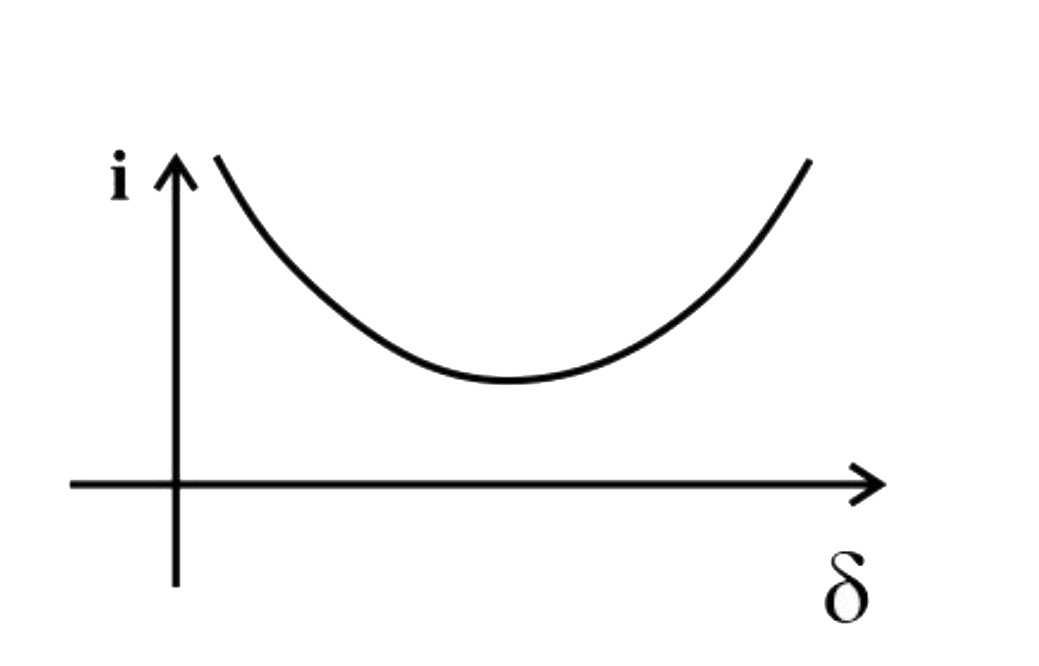
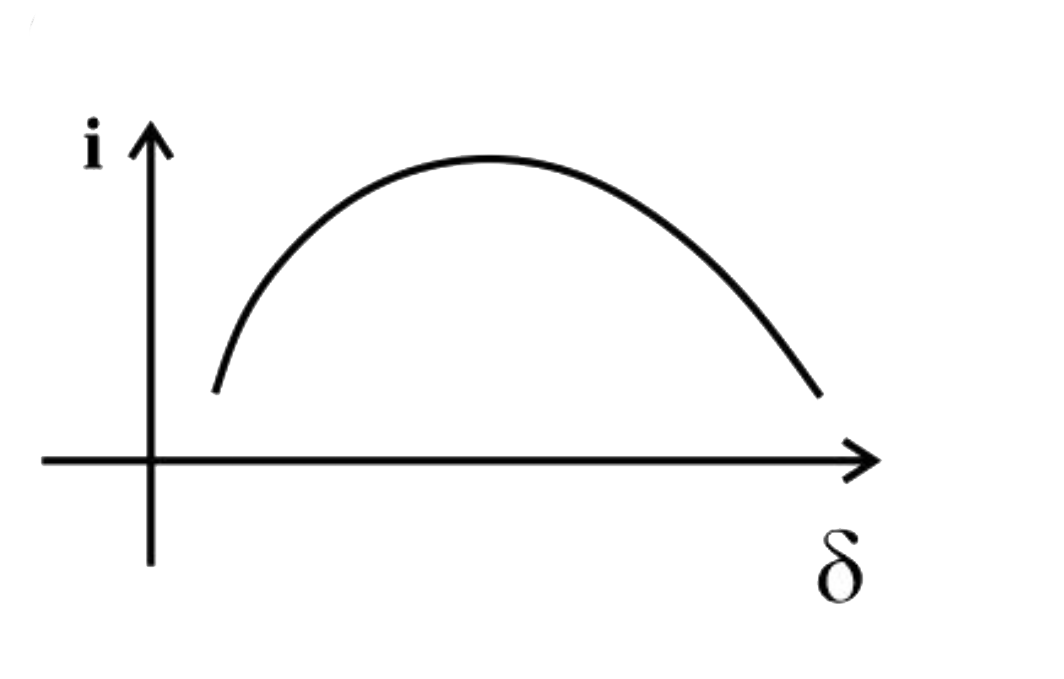
The correct Answer is:A
Step by step video, text & image solution for A graph is plotted between angle of deviation (delta) and angle of incidence (i) for a prism. The nearly correct graph is by Physics experts to help you in doubts & scoring excellent marks in Class 12 exams.
Updated on:21/07/2023Topper's Solved these Questions
Similar Questions
Knowledge Check
The graph between angle of deviation (δ) and angle of incidence (i) for a triangular prism is represented by
A B
B C
C D
D
The graph between angle of deviation (δ) and angle of incidence (i) for a triangular prism is represented by
A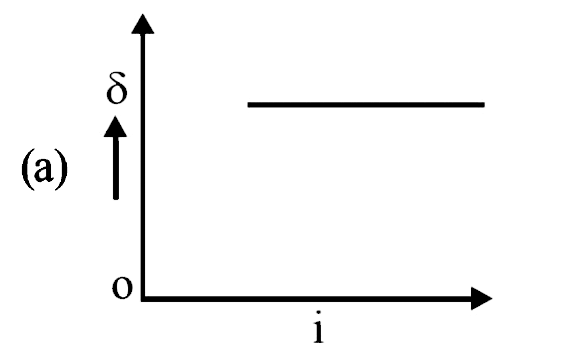 B
B C
C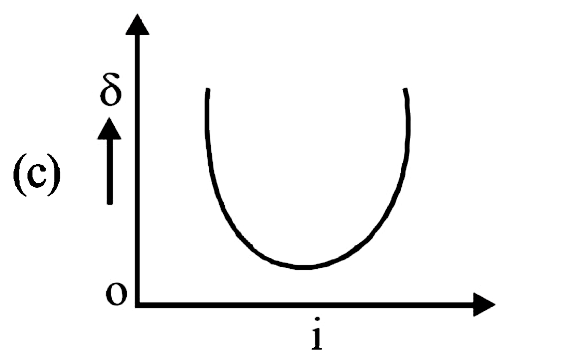 D
D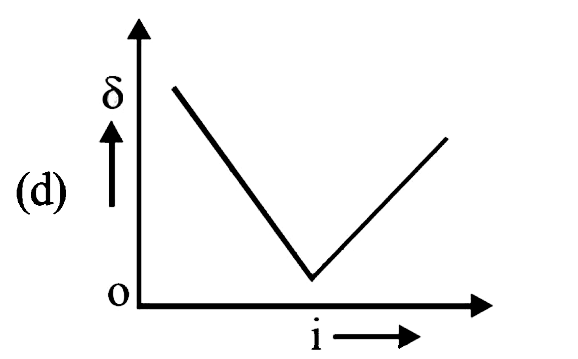
The graph between angle of deviation (δ) and angle of incidence (i) for a triangular prism is represented by
A<imga≤ocr_imageload∈g=lazysrc=https://d10lpgp6xz60nq.cloudfront.net/physics_images/NAR_NEET_PHY_XII_P3_C09_E06_027_O01.pngwh=80%mx-autosty≤=background:white;>B C
C D
D
Explain the relation between angle of incidence and deviation for a prism
View SolutionOn increasing angle of incidence for a prism the angle of deviation
View SolutionFigure shown the graph of angle of deviation δ verses angle of incidence I for a light ray striking a prism. The prism angle is
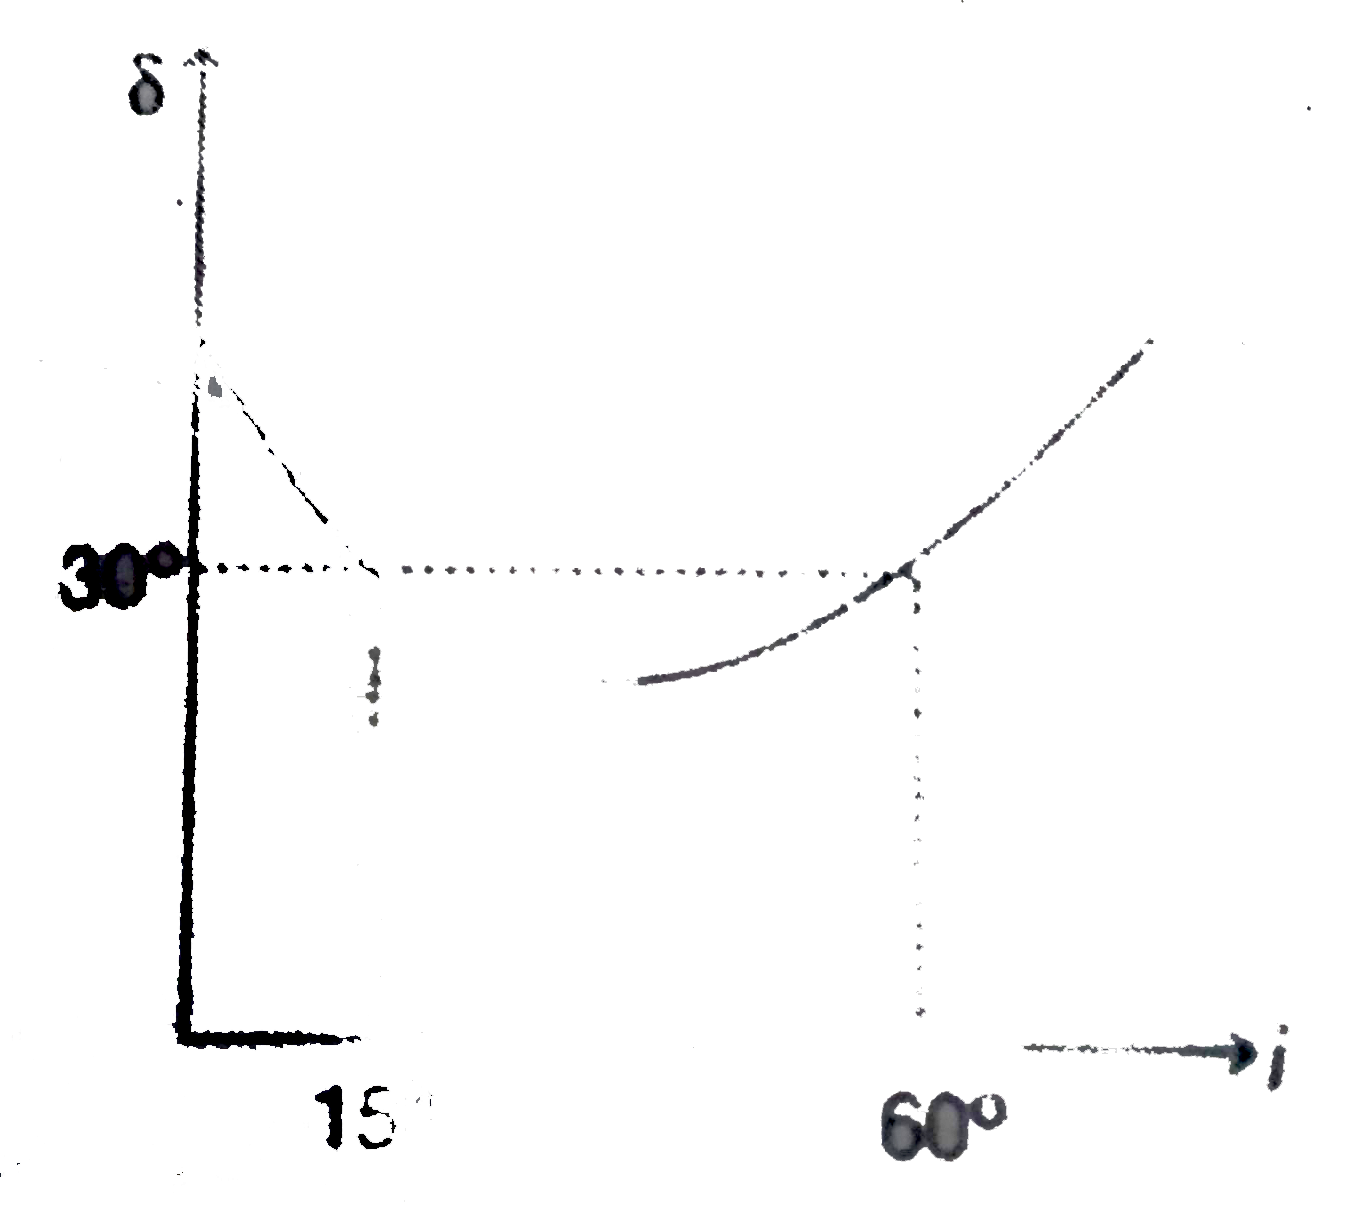
View SolutionFigure shows the graph of angle of deviation ∂ versus angle of incidence i for a light ray striking a prism. The prism angle is
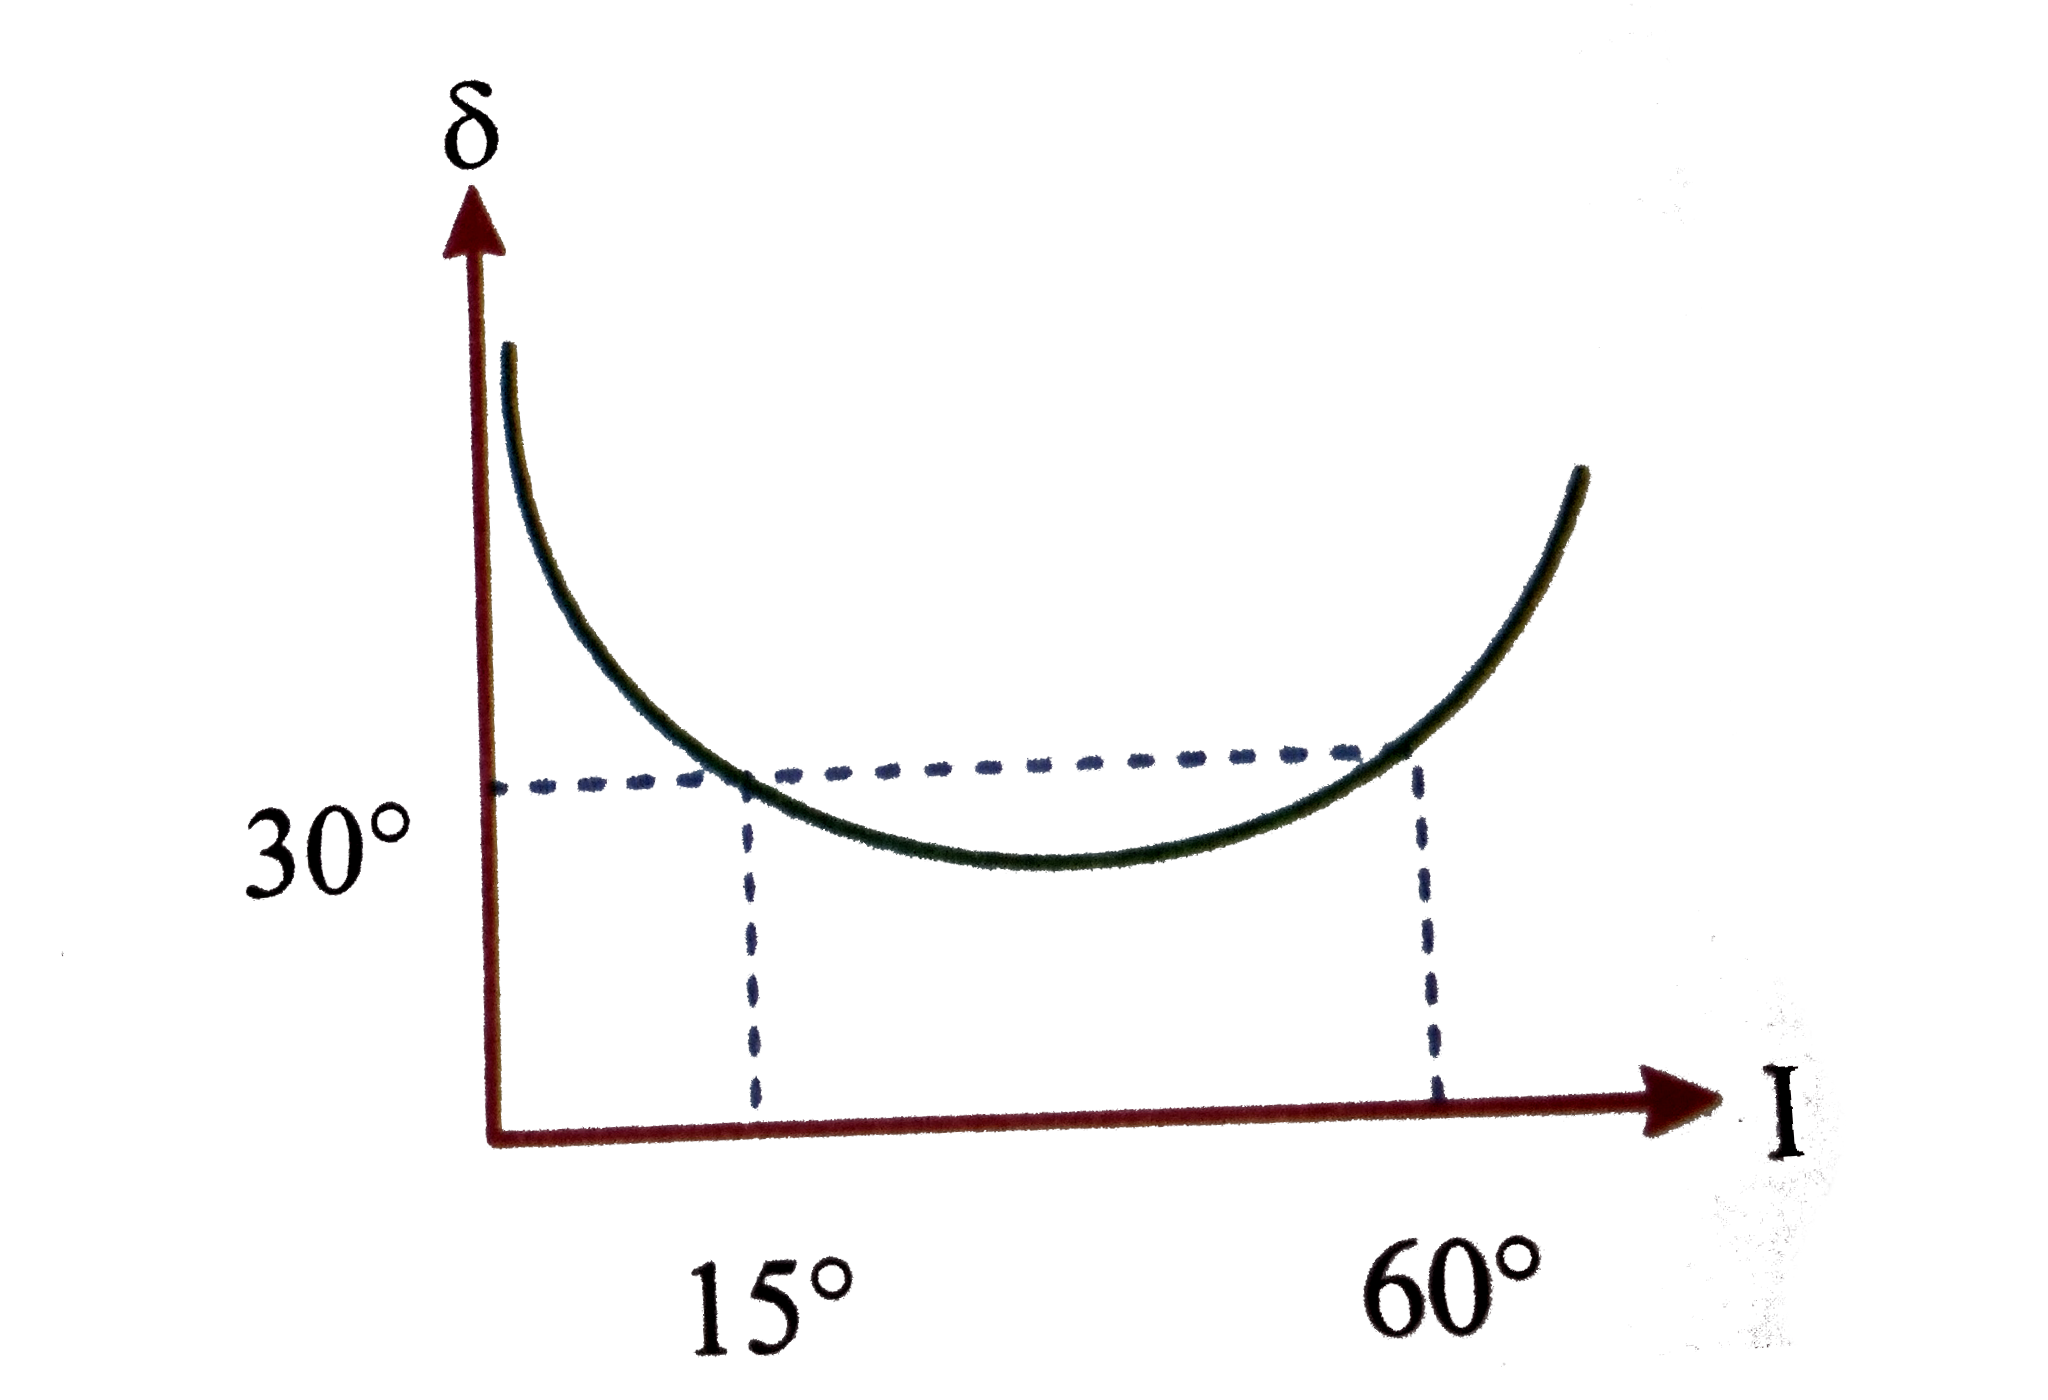
View SolutionThe expected graphical representation of the variation of angle of deviation 'δ' with angle of incidence 'i' in a prism is :
View Solution

