The graph shows the effect of temperature on the rate at which the enzyme in a biological washing powder digests and removes fruit juice stains .
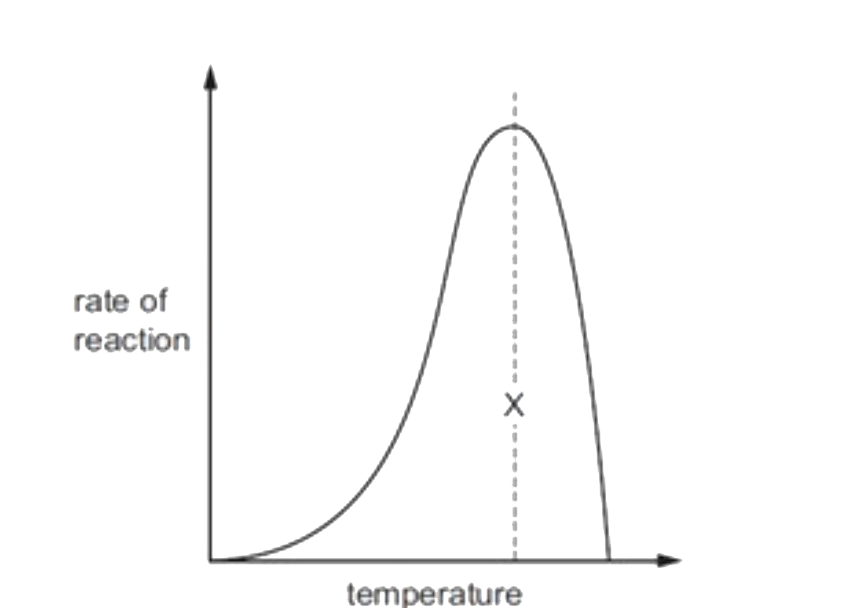
Which statements explain the shape of the graph at temperatures higher than X ?
I. Bonds are broken between the R groups of the amino acids in the polypeptide chains of the enzyme.
II. There are more collisions between the enzyme and its substrate.
III. The tertiary structure of the enzyme is altered.
Iv. The shapes of the active site and the substrate are no longer complementary .
I,II and III
I,II and IV
I,III and IV
II,III and IV
The correct Answer is:C
Step by step video & image solution for The graph shows the effect of temperature on the rate at which the enzyme in a biological washing powder digests and removes fruit juice stains . Which statements explain the shape of the graph at temperatures higher than X ? I. Bonds are broken between the R groups of the amino acids in the polypeptide chains of the enzyme. II. There are more collisions between the enzyme and its substrate. III. The tertiary structure of the enzyme is altered. Iv. The shapes of the active site and the substrate are no longer complementary . by Biology experts to help you in doubts & scoring excellent marks in Class 12 exams.
Updated on:21/07/2023Topper's Solved these Questions
Similar Questions
Knowledge Check
Optimum temperature is the temperature at which an enzyme
AWorks at its bestBIs not destroyedCAction is reversedDIs inactivated.Optimum temperature is the temperature at which and enzyme
Awork at its bestBis not destroyedCaction is reversedDis inactivatedWhich one of the graphs show the effect of temperature on the velocity of a typical enzymatic reaction?
A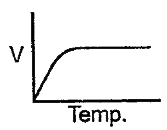 B
B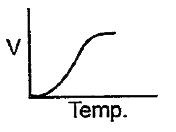 C
C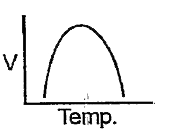 D
D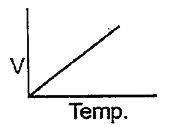
The effect of enzymes on a biological reaction is that the
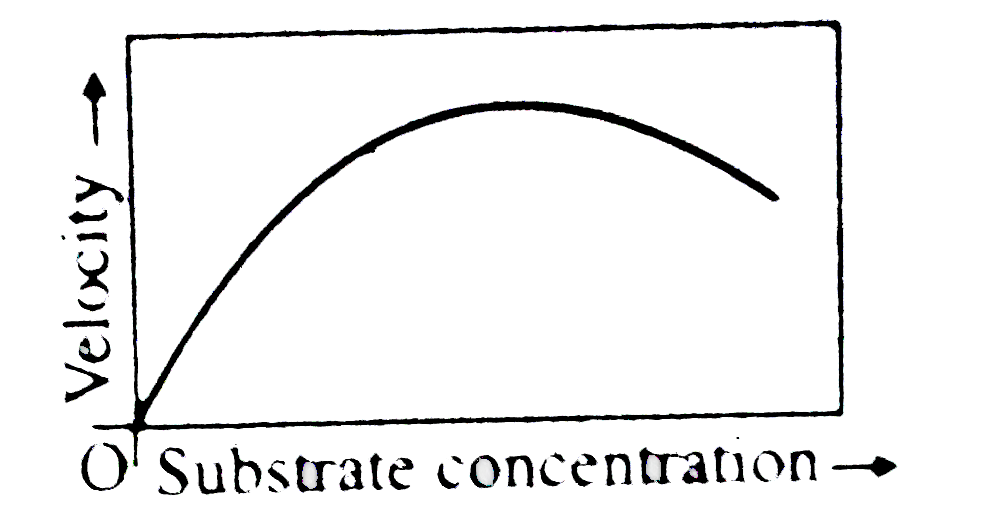
View SolutionThe given graph shows the effect of substrate concentration on the rate of reaction of the enzymes green gram-phosphatase. What does the graph indicate ?
View SolutionFrom the following, the statement /s that will help to determine the specificity of an enzyme is /are:
I. The bonding between R groups of amino acids of the polypeptide
II. The optimum pH of the enzyme
III. The peptide bonds between amino acids of the polypeptide
IV. The shape of the substrate molecule
View SolutionThe given graph shows the effect of substrate concentration on the rate of reaction of the enzyme green-gram-phosphatase What does the graph indicate?
View SolutionThe given graph shows the effect of substrate concentration on the rate of reaction of the enzyme green gram-phosphatase

What dose the graph indicate
View Solution
