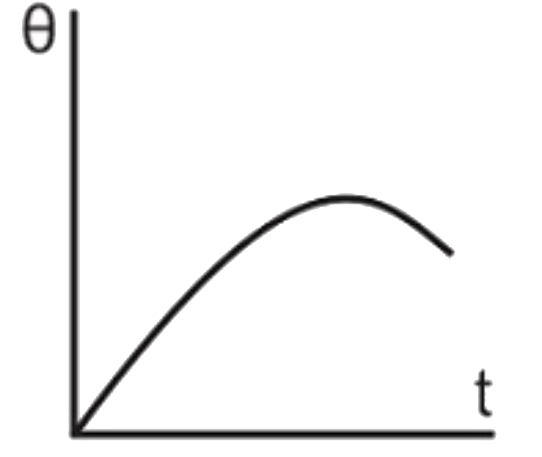
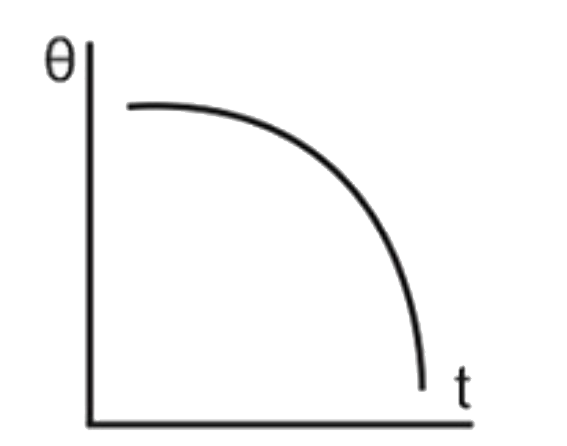
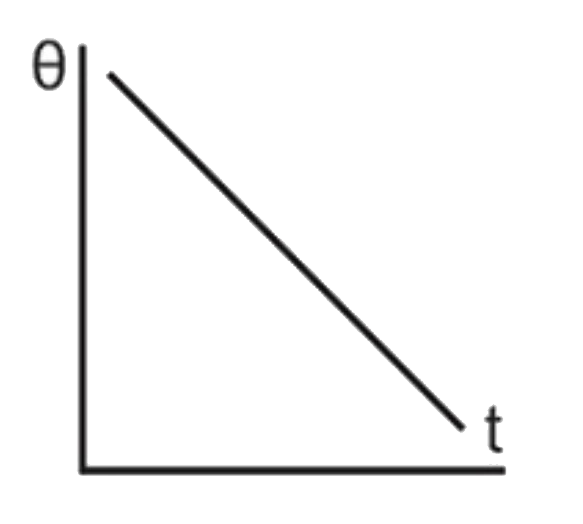
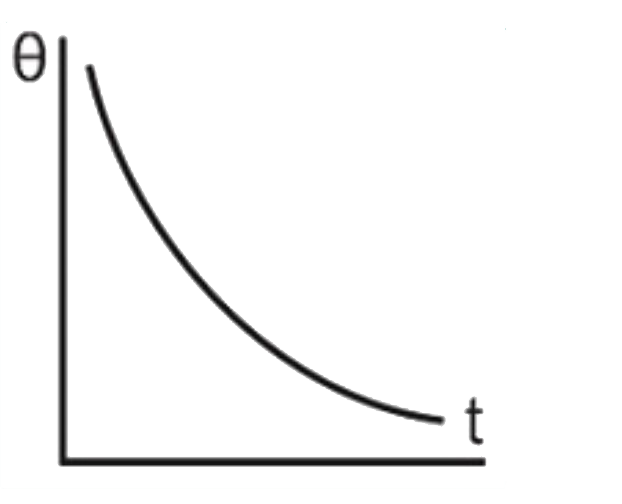
The correct graph between the temperature of a hot body kept in cooler surrounding and time is (Assume newton's law of cooling)


The correct Answer is:D
To solve the problem of determining the correct graph between the temperature of a hot body kept in cooler surroundings and time, we will apply Newton's Law of Cooling. Here’s a step-by-step breakdown of the solution:
Step 1: Understand Newton's Law of Cooling
Newton's Law of Cooling states that the rate of change of temperature of an object is proportional to the difference between its own temperature and the ambient temperature. Mathematically, it can be expressed as:
dTdt=−k(T−Ts)
Where:
- T is the temperature of the hot body,
- Ts is the temperature of the surroundings,
- k is a positive constant,
- t is time.
Step 2: Set Up the Initial Conditions
Let:
- T0 be the initial temperature of the hot body,
- Ts be the constant temperature of the surroundings.
Initially, at t=0:
T(0)=T0
Step 3: Solve the Differential Equation
To find the temperature of the body as a function of time, we can integrate the differential equation. The solution to the equation is given by:
T(t)=Ts+(T0−Ts)e−kt
Step 4: Analyze the Behavior of the Function
1. At t=0:
T(0)=Ts+(T0−Ts)e0=Ts+(T0−Ts)=T0
This confirms that the initial temperature is T0.
2. As t→∞:
T(t)→Ts+(T0−Ts)e−∞=Ts+0=Ts
This indicates that the temperature of the body approaches the temperature of the surroundings as time progresses.
Step 5: Graph the Function
The function T(t)=Ts+(T0−Ts)e−kt is an exponential decay function. The graph will start at T0 when t=0 and will asymptotically approach Ts as t increases. The curve will be decreasing and will never actually reach Ts, but will get infinitely close to it.
Conclusion
The correct graph that represents the temperature of a hot body cooling in cooler surroundings over time is an exponential decay curve starting from T0 and approaching Ts.
Newton's Law of Cooling states that the rate of change of temperature of an object is proportional to the difference between its own temperature and the ambient temperature. Mathematically, it can be expressed as:
- T is the temperature of the hot body,
- Ts is the temperature of the surroundings,
- k is a positive constant,
- t is time.
Let:
- T0 be the initial temperature of the hot body,
- Ts be the constant temperature of the surroundings.
T(0)=T0
To find the temperature of the body as a function of time, we can integrate the differential equation. The solution to the equation is given by:
1. At t=0:
T(0)=Ts+(T0−Ts)e0=Ts+(T0−Ts)=T0
This confirms that the initial temperature is T0.
T(t)→Ts+(T0−Ts)e−∞=Ts+0=Ts
This indicates that the temperature of the body approaches the temperature of the surroundings as time progresses.
The function T(t)=Ts+(T0−Ts)e−kt is an exponential decay function. The graph will start at T0 when t=0 and will asymptotically approach Ts as t increases. The curve will be decreasing and will never actually reach Ts, but will get infinitely close to it.
The correct graph that represents the temperature of a hot body cooling in cooler surroundings over time is an exponential decay curve starting from T0 and approaching Ts.
Topper's Solved these Questions
Similar Questions
A body cools in 7 minutes from 60∘C to 40∘C. What will be its temperature after the next 7 minutes? The temperature of the surrounding is 10∘C. Assume that Newton's law of cooling holds good throughout the process.
View SolutionThe temperature of a body falls from 52∘C to 36∘C in 10 minutes when placed in a surrounding of constant temperature 20∘C. What will be the temperature of the body after another 10min. (Use Newton's law of cooling)
View Solution
Knowledge Check
Graph of rate of cooling against time is (assume Newton's law of cooling)
Astraight lineBexponentially decreasing curveCcurveDparabolaA cooling curve is plotted between the temperature of a hot body and time. Which of the following is not true for the cooling curve?
ACooling is faster from a calorimeter having a larger surface area than a smaller one.BCooling is faster from a calorimeter painted black from outside than that from a polished surfaced calorimeter.CCooling is faster from a copper calorimeter than from a steel calorimeter.DThe rate of cooling remains same throughout the experiment. Hence the graph is a striagth lineA liquid takes 10 minutes to cool from 80∘C to 50∘C. The temperature of the surroudings is 20∘C. Assuming that the Newton's law of cooling is obeyed, the cooling constant will be -
A0.056/mtB0.042/mtC0.081/mtD0.069/mt
A body cools from 70∘C to 50∘C in 6 minutes when the temperature of the surrounding is 30∘C. What will be the temperature of the body after further 12 minutes if coolilng proseeds ac cording to Newton's law of cooling ?
View SolutionAc cording to Newton's law of cooling, the rate of cooling of a body is proportional to (Δθ)n, where Δθ is the difference of the temperature of the body and thae surrounding. What is the value of n out of 4,3,2,and 1?
View SolutionA body cools from 60%∘C to 50∘C in 10 min. Find its temperature at the end of next 10 min if the room temperature is 25∘C. Assume Newton's law of cooling holds.
View SolutionA liquid in a beaker has temperature θ(t) at time t and θ0 is temperature of surroundings, then according to Newton's law of cooling the correct graph between loge(θ−θ0) and t is :
View SolutionAccording to Newton's law of cooling, the rate of cooling of a body in air is proportional to the difference between the temperature of the body and the temperature of the surrounding air. If the air temperature is 20∘C and the body cools for 20 minutes from 140∘C→80∘C, then the temperature will be 50∘C in
View Solution
