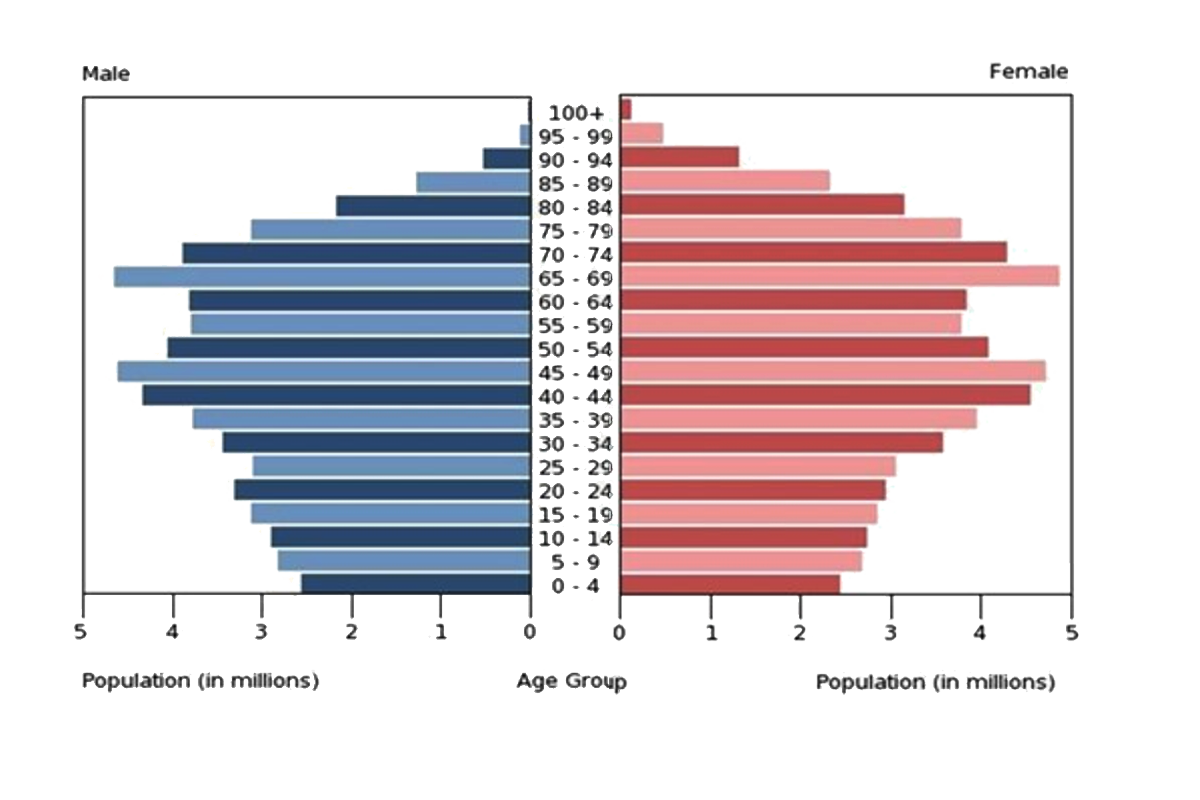
Observe the following agewise population graph of a country in 2018 . The population in this country is

stable
expanding
declining
can't comment based on this graph
The correct Answer is:C
Step by step video & image solution for Observe the following agewise population graph of a country in 2018 . The population in this country is by Biology experts to help you in doubts & scoring excellent marks in Class 12 exams.
Updated on:21/07/2023Topper's Solved these Questions
Similar Questions
Knowledge Check
In a growing population of a country .
Areproductive and pre-reproductive individuals are equal in numberBreproductive individuals are less than the post-reproductive individualsCpre-reproductive individuals are more than the reproductive individualsDpre-reproductive individuals are less than the reproductive individualsIn a growing population of a country ,
APre-reproductive individuals are more than the reproductive individuals.BReproductive individuals are less than the post-reproductive individuals.CReproductive and pre-reproductive individuals are equal in number.DPre-reproductive individuals are less than the reproductive individuals.In a growing population of a country ,
Apre-reproductive individuals ar emore than the repoductive individualsBreproductive individuals are less then the post-reproductive individualsCreproductive and pre-reproductive individuals are equal in numberDpre-reproductive individuals are less than the reproductive individuals
Country having maximum population in the world is
View SolutionThe best way to decrease population of a country is
View SolutionFrom 1980−1990, the population of a country was increased by 20%.
From 1990−2000, the population of the country was increased by 20%.
From 2000−2010, the population of the country was increased by 20%.
Then the overall increased population (in percentage) of the country from 1980−2010 was.
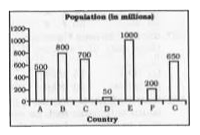
View SolutionThe bar graph shows the population of different countries. Study the diagram and answer the following questions.

Population of country E is greater than that of country A by _____.
View Solution