The bar graph shows the population of different countries. Study the diagram and answer the following questions.
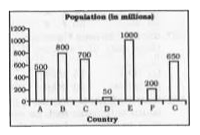
Population of country E is greater than that of country A by _____.
200%
100%
50%
150%
The correct Answer is:B
Step by step video, text & image solution for The bar graph shows the population of different countries. Study the diagram and answer the following questions. Population of country E is greater than that of country A by _____. by Maths experts to help you in doubts & scoring excellent marks in Class 14 exams.
Topper's Solved these Questions
- BOOK - KIRAN PUBLICATIONCHAPTER - STATISTICS AND DATA INTERPRETATIONEXERCISE - TYPE-III39videos
STATISTICS AND DATA INTERPRETATION
- BOOK - KIRAN PUBLICATIONCHAPTER - STATISTICS AND DATA INTERPRETATIONEXERCISE - TYPE-IV182videos
STATISTICS AND DATA INTERPRETATION
- BOOK - KIRAN PUBLICATIONCHAPTER - STATISTICS AND DATA INTERPRETATIONEXERCISE - TYPE-VIII8videos
STATISTICS AND DATA INTERPRETATION
- BOOK - KIRAN PUBLICATIONCHAPTER - SIMPLIFICATIONEXERCISE - TEST YOURSELF25videos
SIMPLIFICATION
- BOOK - KIRAN PUBLICATIONCHAPTER - TIME AND DISTANCEEXERCISE - Type -XI74videos
TIME AND DISTANCE
Similar Questions
The bar graph shows the number of soldiers in the armies of different countries. Study the diagram and answer the following questions.
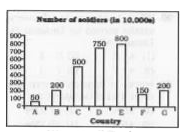
The number of soldiers of country F is greater than that of country A by ____.View SolutionThe bar graph shows the number of soldiers in the armies of different countries. Study the diagram and answer the following questions.

The number of soldiers of country F is greater than that of country A by ____.View Solution
Knowledge Check
- Question 1 - Select One
The bar graph shows the population of different countries. Study the diagram and answer the following questions.
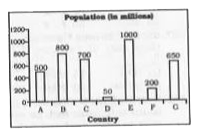
What is the ratio of population of country A to that of country G?A13:10B10:13C5:13D13:5 - Question 2 - Select One
The bar graph shows the debt of different countries. Study the diagram and answer the following questions.
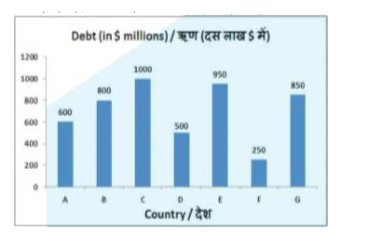
Debt of country A is lesser than that of country B by ___________.A20%B25%C33.33%D30% - Question 3 - Select One
The bar graph shows the population of different countries. Study the diagram and answer the following questions.
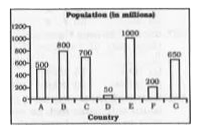
Which country has the second highest population?ABBDCEDA
The bar graph shows the debt of different countries. Study the diagram and answer the following questions.
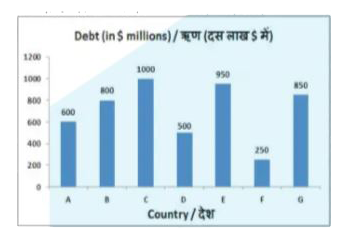
What is the ratio of debt of country A to that of country F?View SolutionThe bar graph shows the debt of different countries. Study the diagram and answer the following questions.
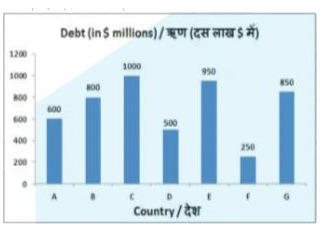
Which country has the second lowest debt?View SolutionThe bar graph shows the population of different countries. Study the diagram and answer the following questions.
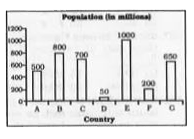
If country D spends $120 per person on health annually, then how much does it spend (in $ millions) on health on its entire population?View SolutionThe line graph shows the production of steel of a certain country. Study the diagram and answer the following questions.
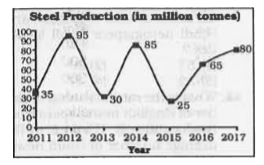
The steel production in 2012 was greater than that in 2015 by _____.View SolutionThe bar graph shows the production of the different departments of a company. Study the diagram and answer the following questions.
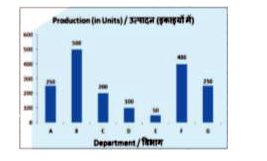
The production of department C is greater than that of department E by ____View Solution

