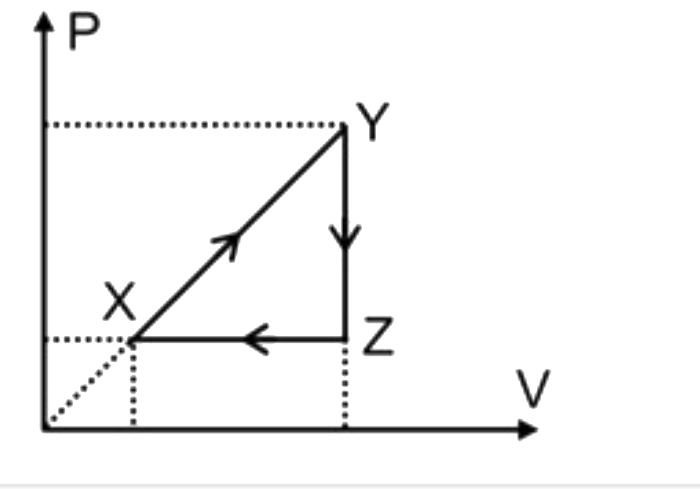
In the show indicator diagram over pressure - volume scales 'n' moles of an ideal gas is cycled . If the temperature of the gas in the state X and Y are respectively TXandTY . Temperature of the gas in the state Z is the (All temperature are in absolute scale )
Arithmetic mean of TxandTy
Geometric mean of TxandTy
Harmonic mean of TxandTy
None of the above is correct
The correct Answer is:B
Step by step video & image solution for In the show indicator diagram over pressure - volume scales 'n' moles of an ideal gas is cycled . If the temperature of the gas in the state X and Y are respectively T_X and T_Y . Temperature of the gas in the state Z is the (All temperature are in absolute scale ) by Physics experts to help you in doubts & scoring excellent marks in Class 12 exams.
Updated on:21/07/2023Topper's Solved these Questions
Similar Questions
Figure shows graphs of pressure versus density for an ideal gas at two temperatures T1 and T2 Then
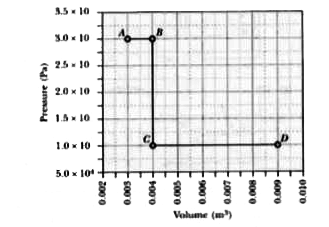
View SolutionTwo moles of a confined ideal monatomic gas begin at state A in the pressure-volume graph and follow the path shown to state D. If the temperature of the gas at A is 54 K, what is the temperature of the gas at D?
View Solution
Knowledge Check
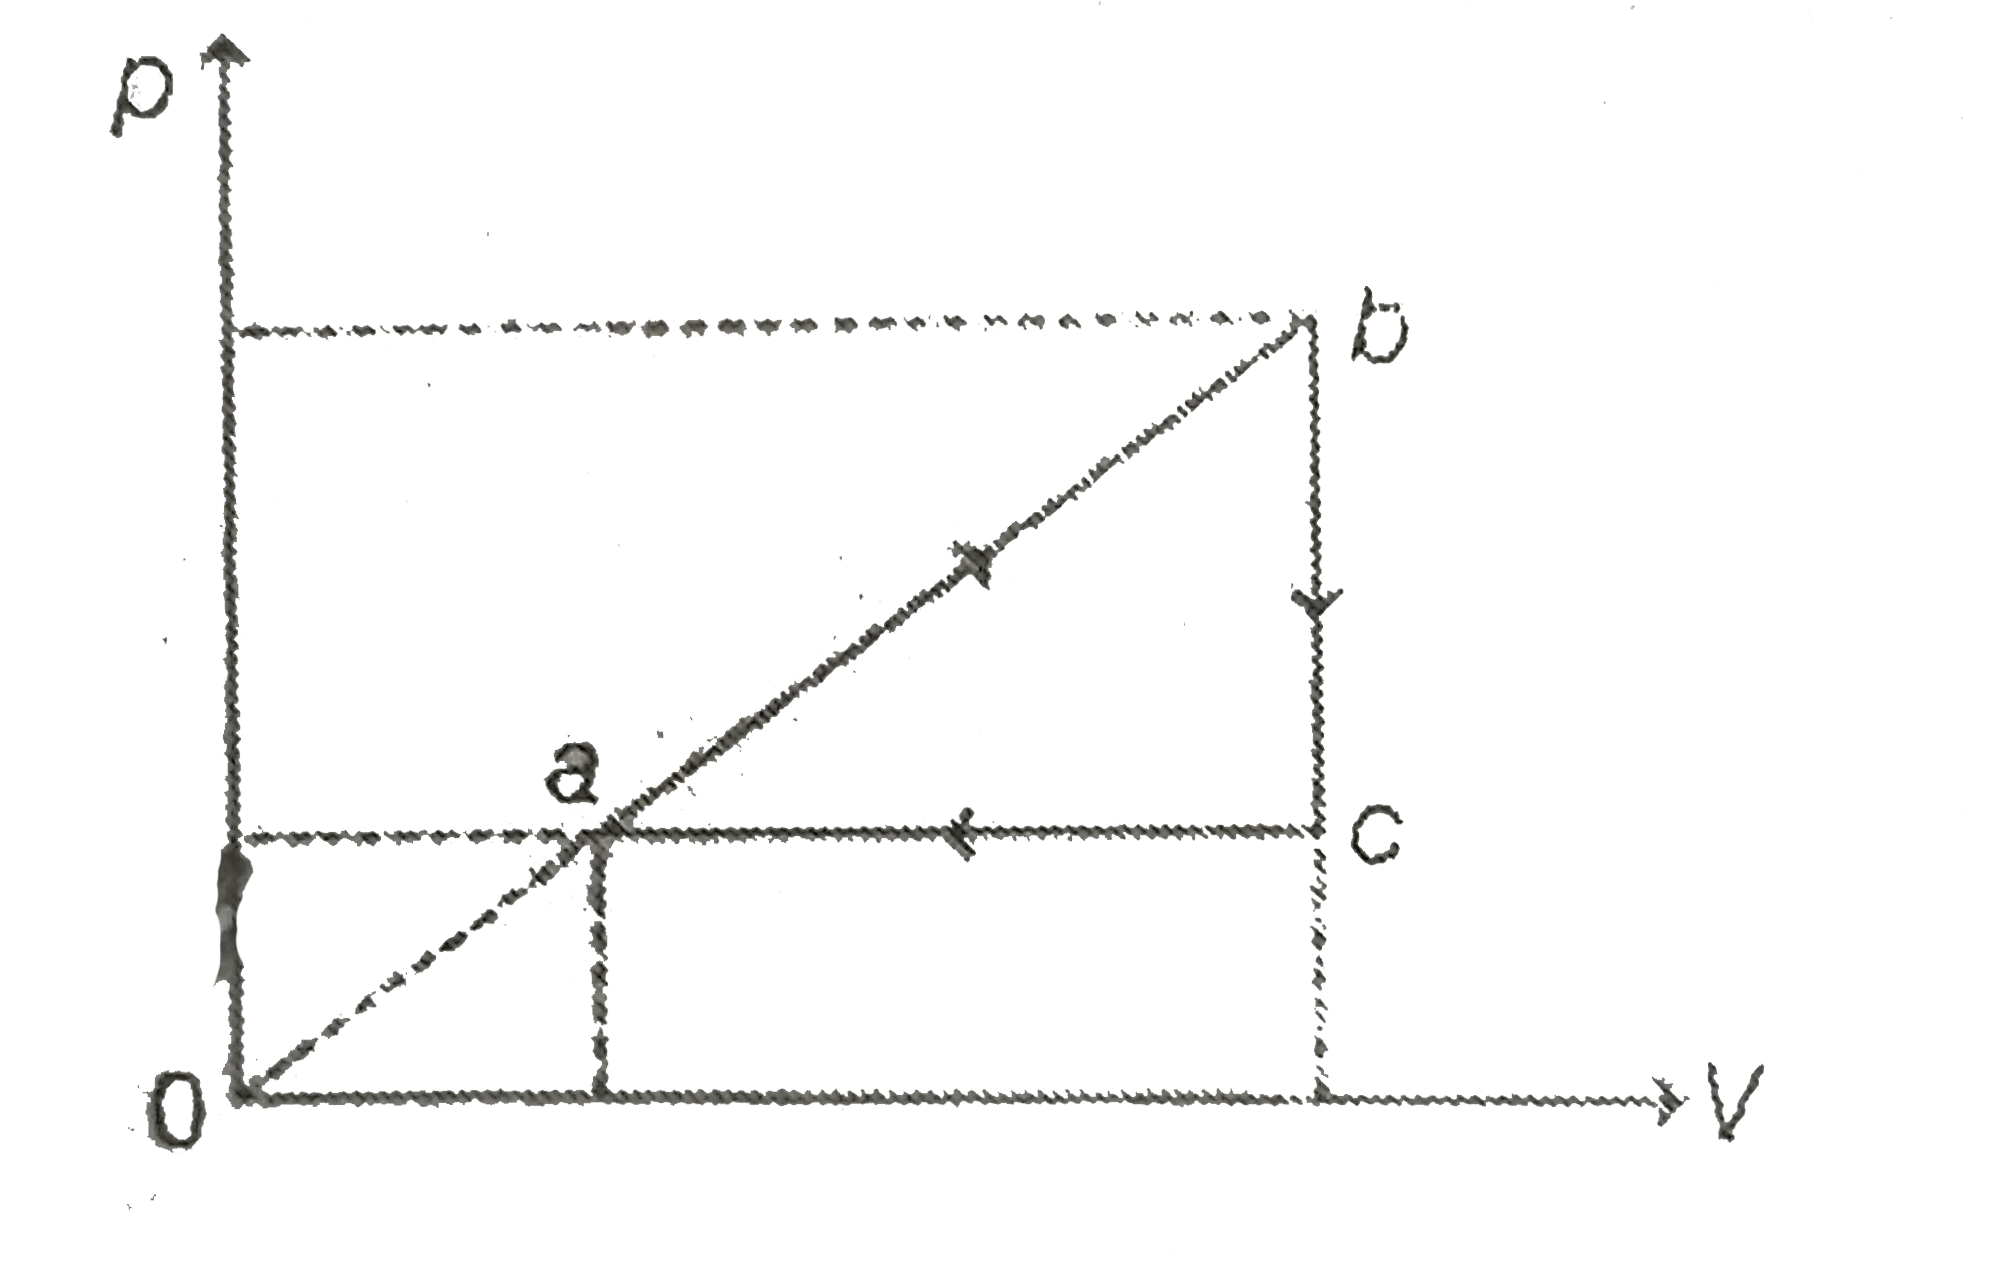
Figure illustrates a cycle conducted with n moles of an ideal gas. In the states a and b the gas temperatures are Ta and Tb respectively. Temperature of the gas in the state C is ltbr)
 A√TaTbBTa+TbCTaTbTa+TbD(Ta+Tb)/2
The volume vs. temperature graph of 1 mole of an ideal gas is given below
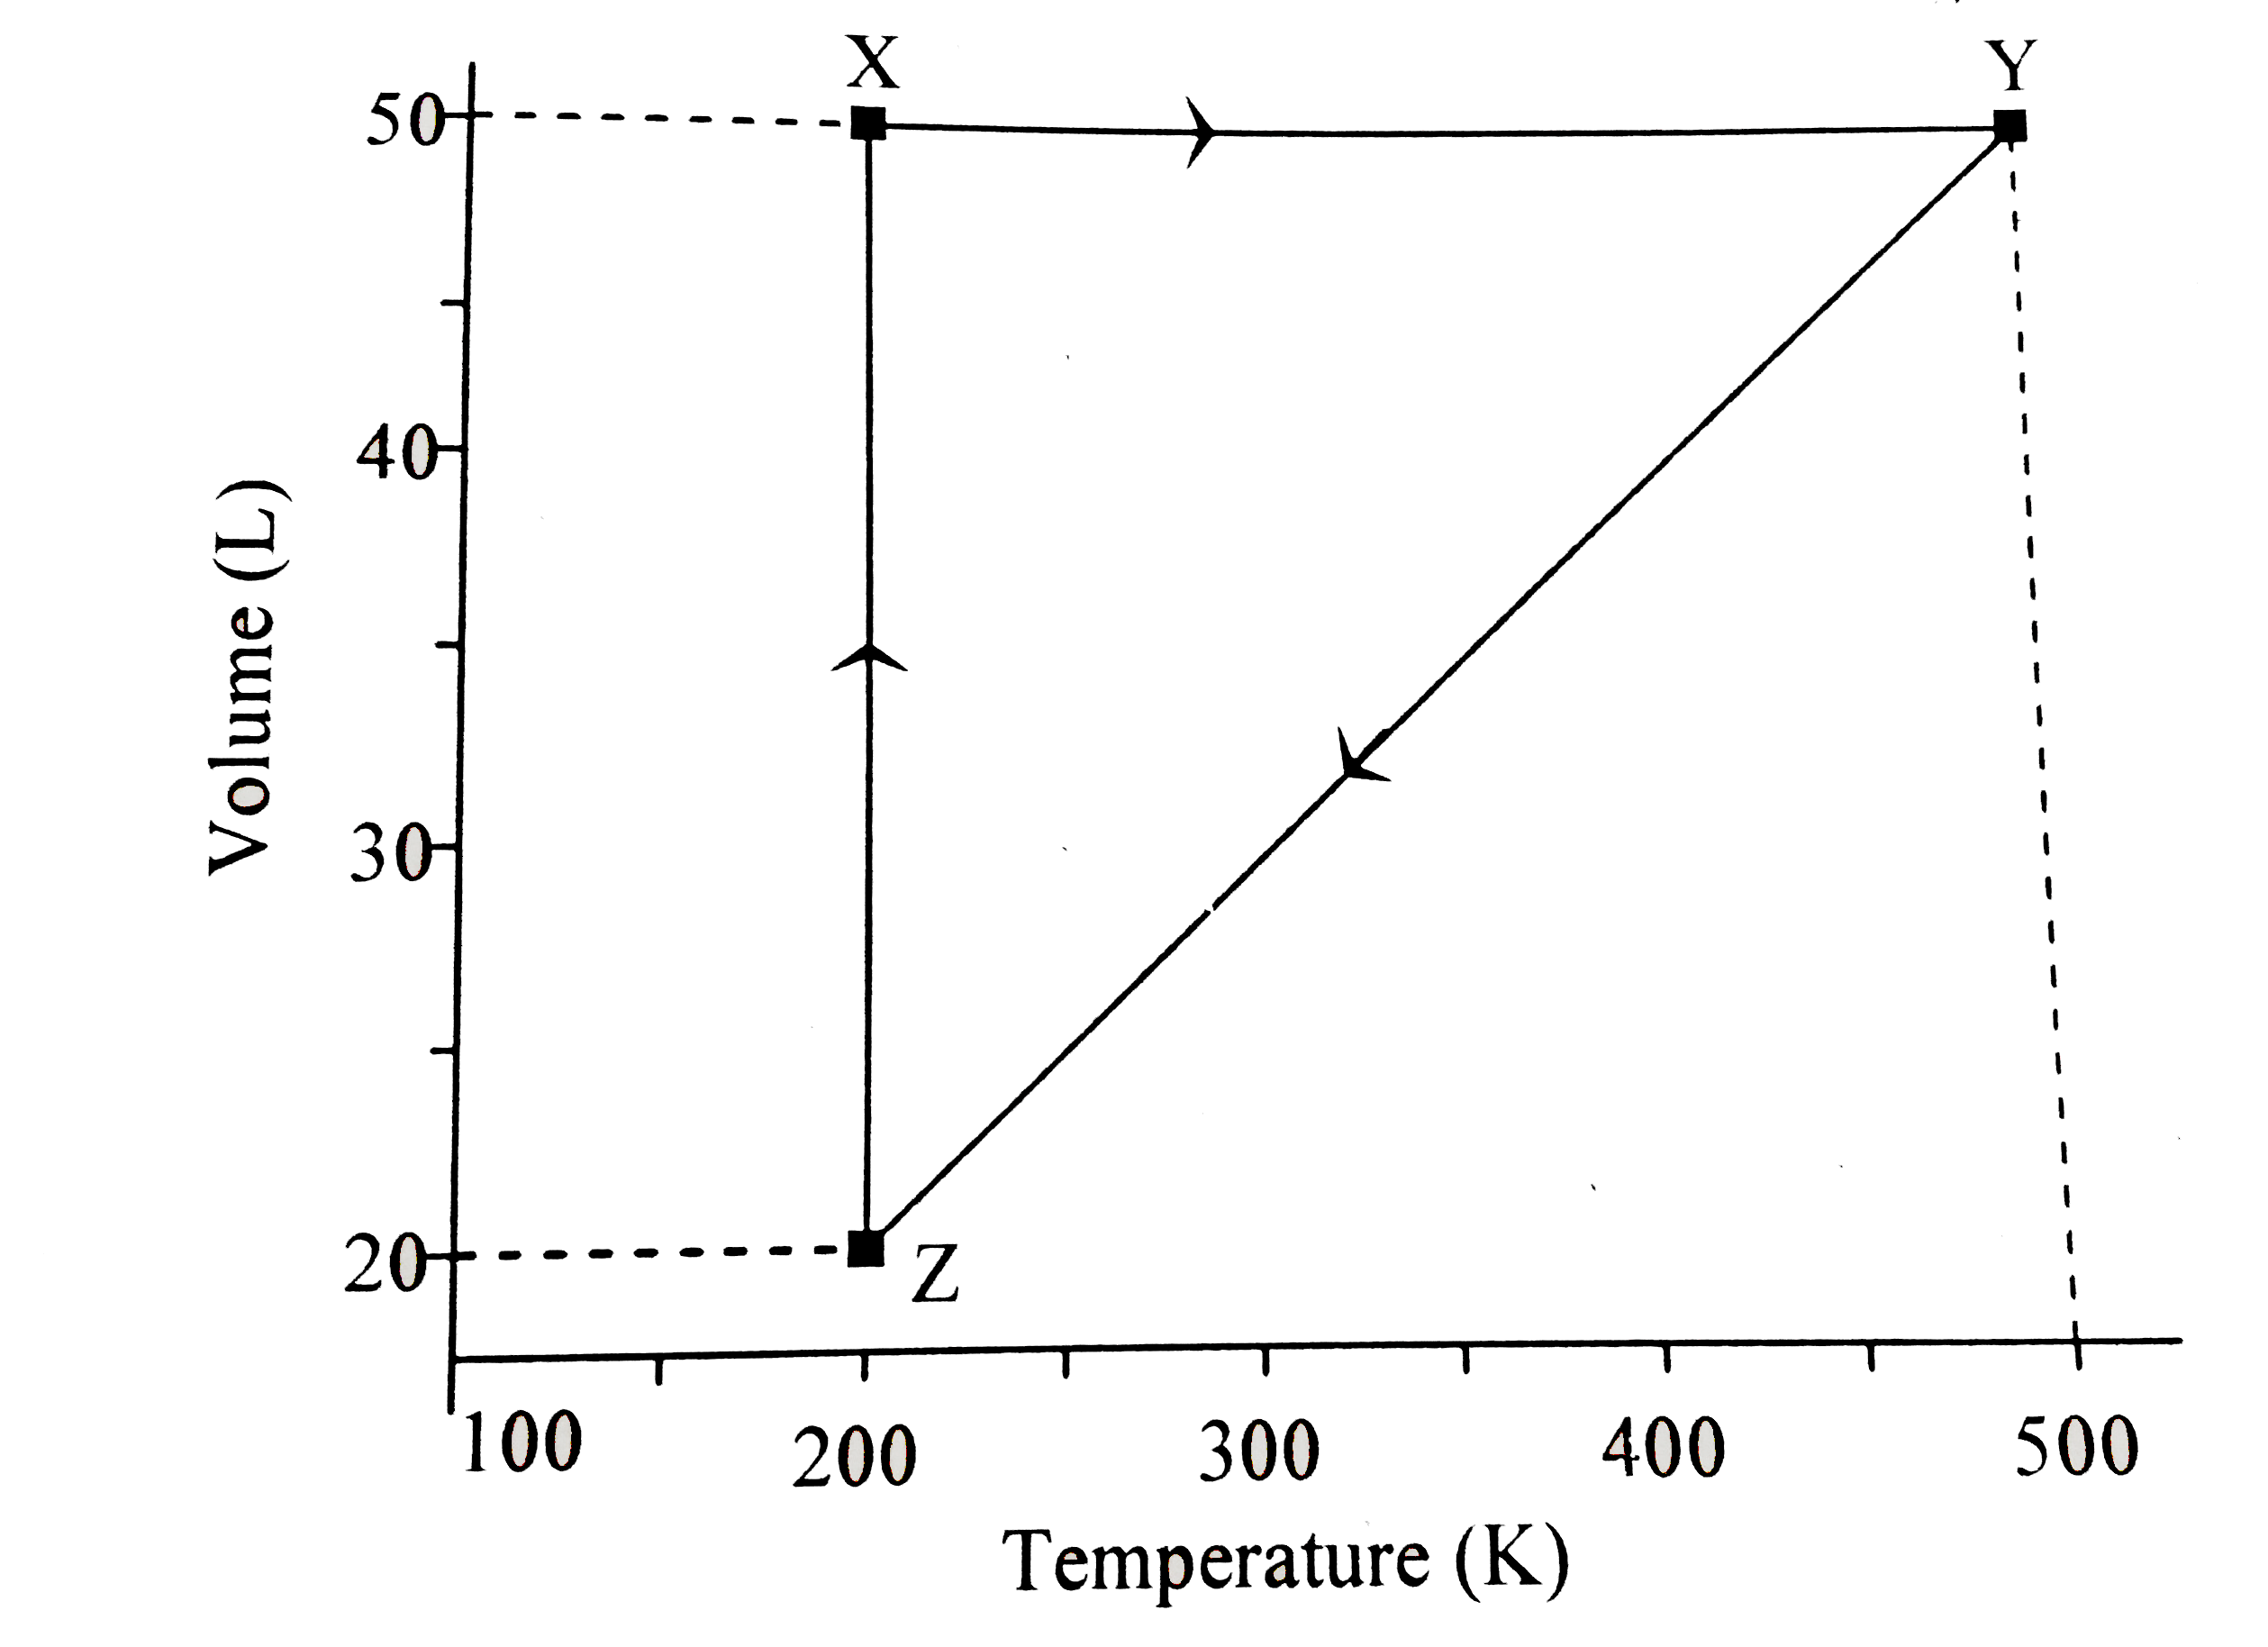
The pressure of the gas (in atm) at X, Y and Z, respectively, areA0.328,0.820,0.820B3.28,8.20,3.28C0.238,0.280,0.280D32.8,0.280,82.0The specific heat of an ideal gas varies with temperature T as
AT1BT2CT−2DT0
Draw the P-T and V-T diagrams of an isochoric process of n moles an ideal gas from pressure P0 volume V0 to pressure 4P0, indicating the pressures and temperatures of the gas in the initial and the final states.
View Solutionmonatomic ideal gas is contained in a rigid container of volume V with walls of totsl inner surface area A, thickness x and thermal condctivity K. The gas is at an initial temperature t0 and pressure P0 . Find tjr pressure of the gas as a function of time if the temperature of the surrounding air is Ts . All temperature are in absolute scale.
View SolutionA sample of ideal gas is taken through the cyclic process shown in the figure. The temerauture of the gas in state A is TA =200 K. In states B and C the temperature of the gas is the same.

What is the greastes temperature of the gas during the cyclic process ?
View SolutionIf the absolute temperature of a gas is doubled and the pressure is reuced to one-half, the volume of the gas will ____________
View SolutionIf 2 mol of an ideal monatomic gas at temperature T0 are mixed with 4 mol of another ideal monatoic gas at temperature 2T0 then the temperature of the mixture is
View Solution