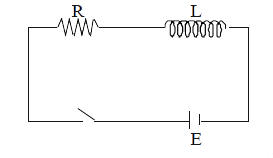
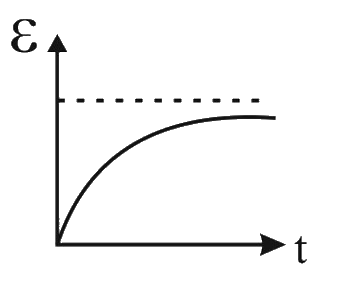
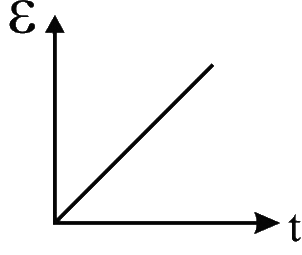
Plot the variation of emf across the inductor with respect time __
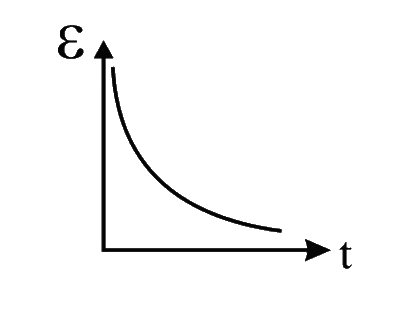
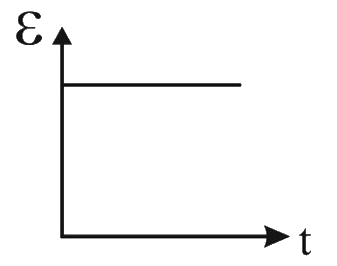
The correct Answer is:C
Step by step video & image solution for Plot the variation of emf across the inductor with respect time __ by Physics experts to help you in doubts & scoring excellent marks in Class 12 exams.
Updated on:21/07/2023Topper's Solved these Questions
Similar Questions
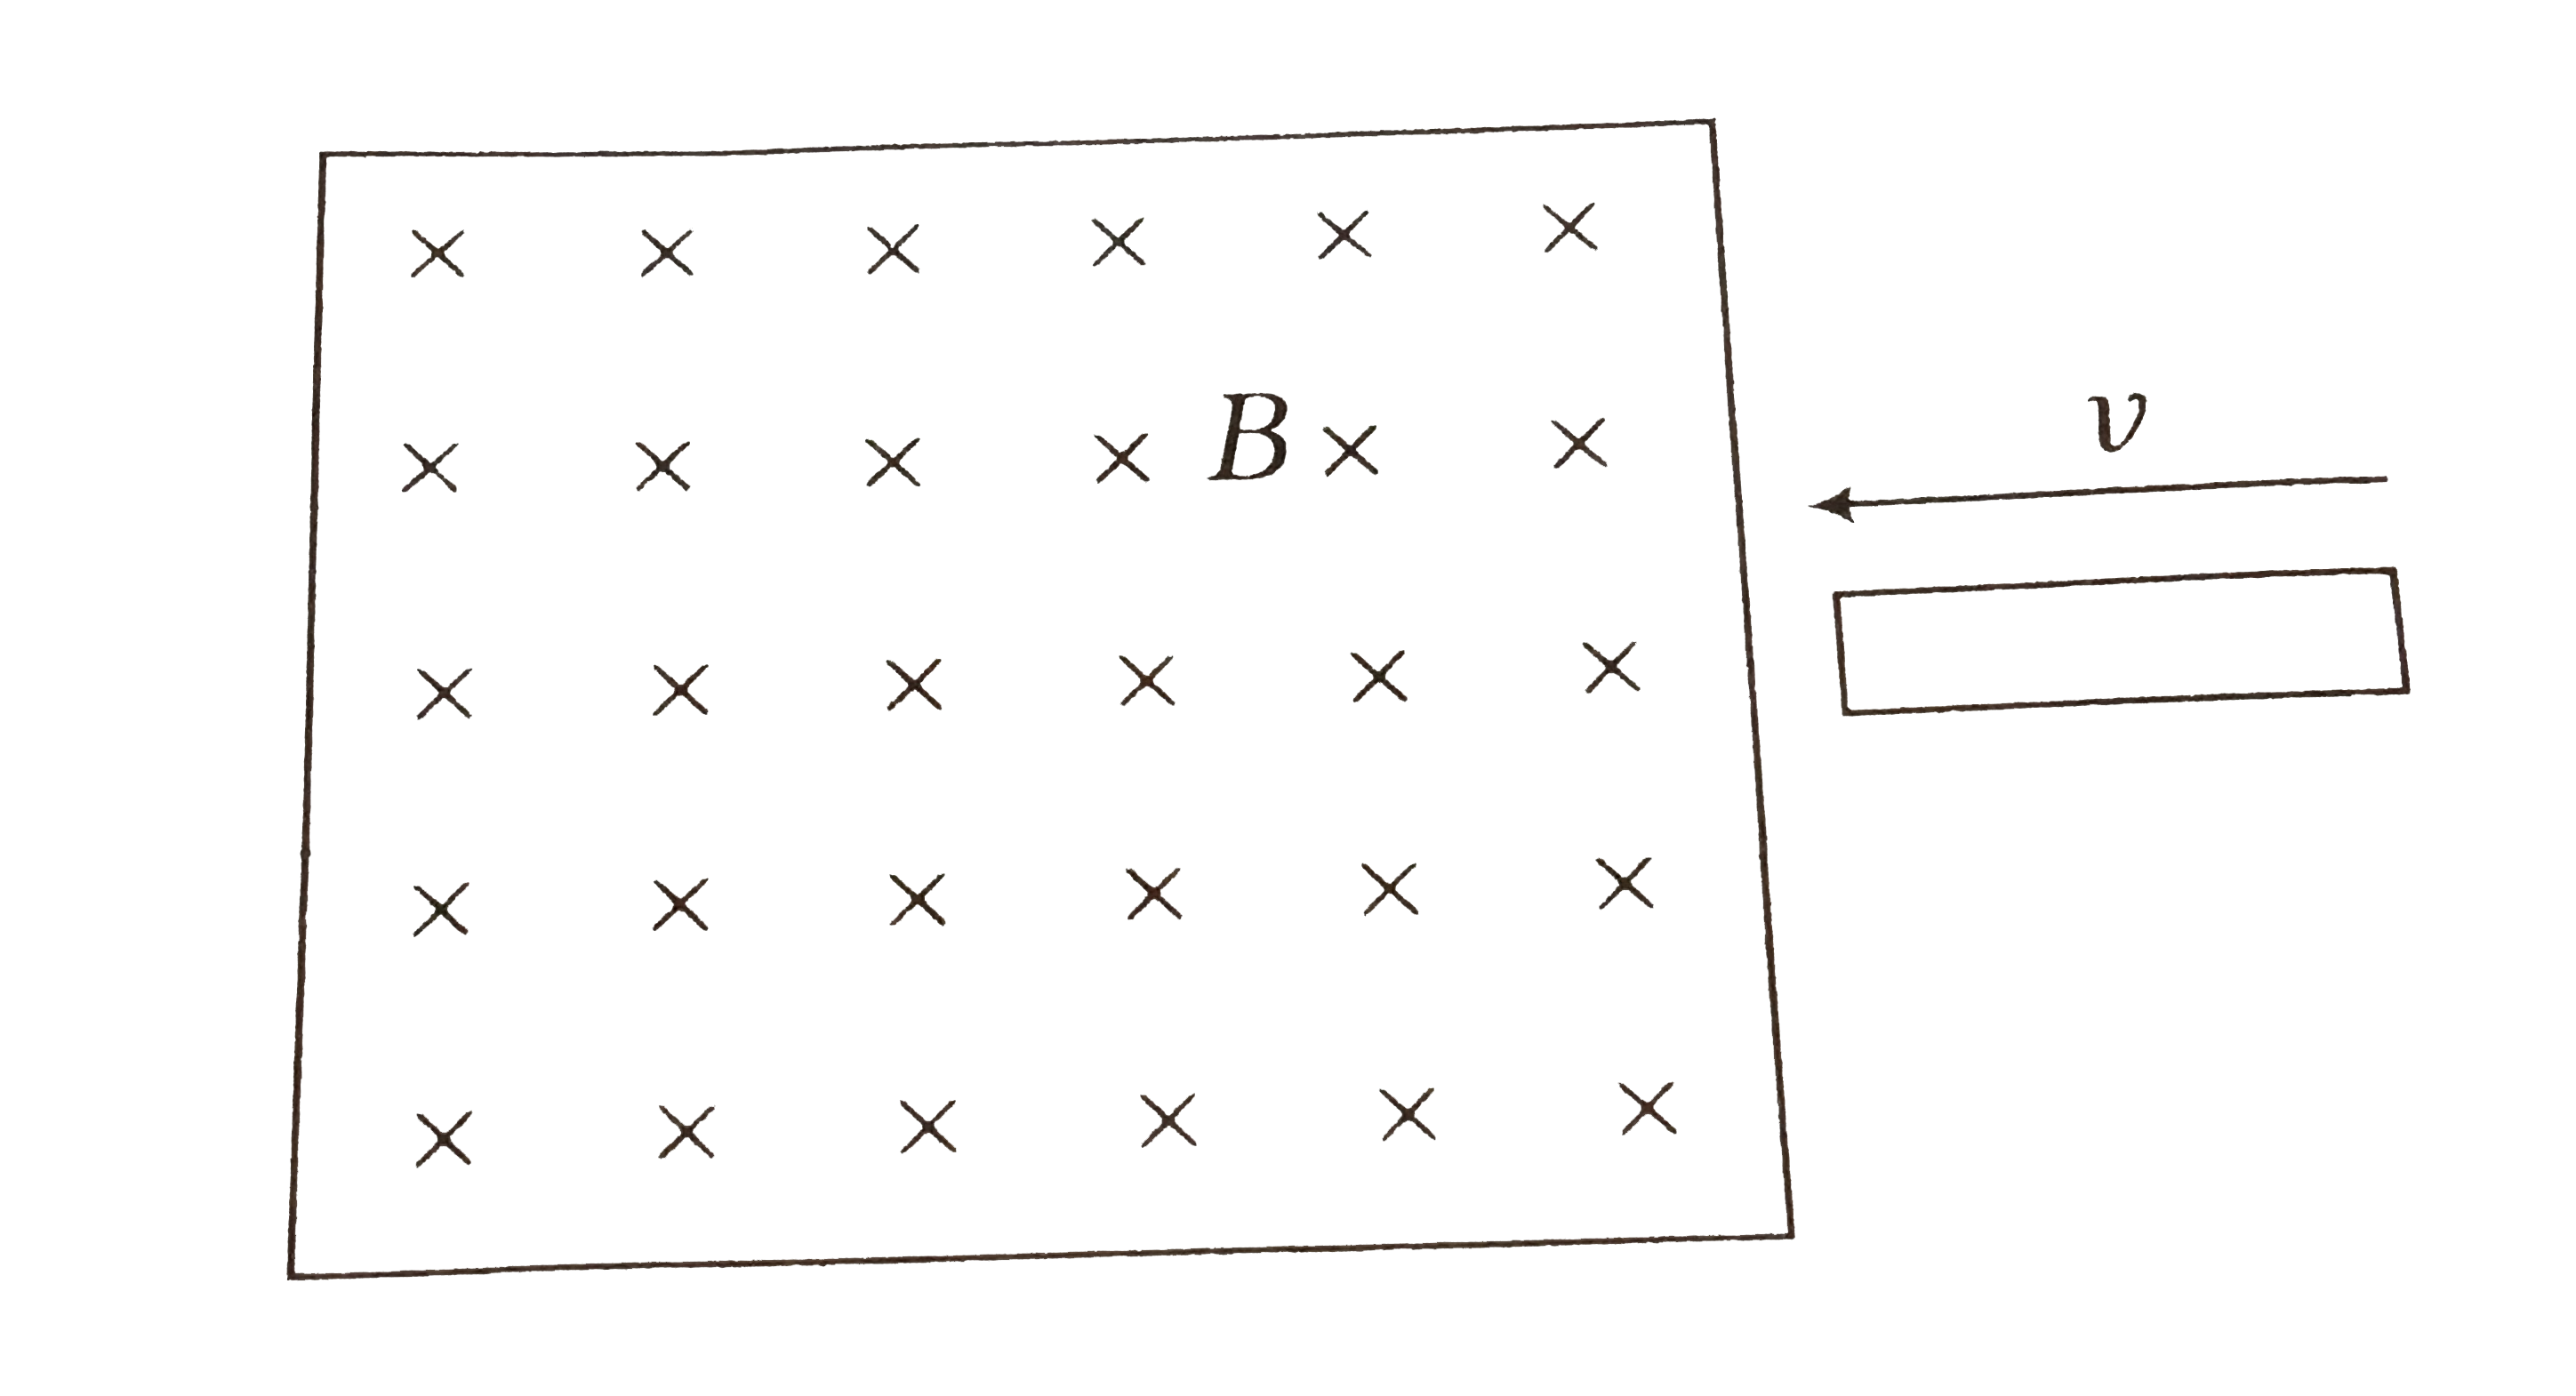
Through a uniform B field, A small rectangular loop is moving towards left with constant velocity as shown in the figure. Counting of time t begins at the moment, the loop starts entering the field.
Plot the variation of flux through the loop with respect to time. Also, plot the variation of induced emf w.r.t. time t.
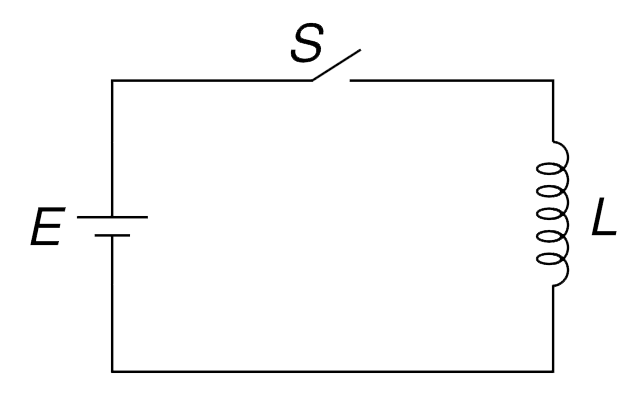
View SolutionConsider an ideal inductor (having no resistance) of inductance L which is connected to an ideal cell (no resistance) of emf E by closing the switch S at time t=0. Plot the variation of current through the inductor versus time.
View Solution
Knowledge Check
The current in a 4.0 mH inductor vaires in time as shown in the figure. The corresponding graph of the self induced emf across the inductor over the time interval t=0 to t=12.0 ms is
 A
A B
B C
C D
D
The variation of displacement with respect to time is depicted in the following figure. The figure shows that
 Aacceleration is constantBvelocity is constantCthe motion is acceleratedDthe motion is retarded and finally the particle stops
The variation of displacement with respect to time is depicted in the following figure. The figure shows that
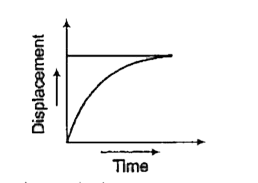 Aacceleration is canstantBvelocity is constantCthe motion is acceleratedDthe motion is retarded and finally the particle stops
Sketch a graph showing the variation of reactance of an inductor with frequency of the applied voltage
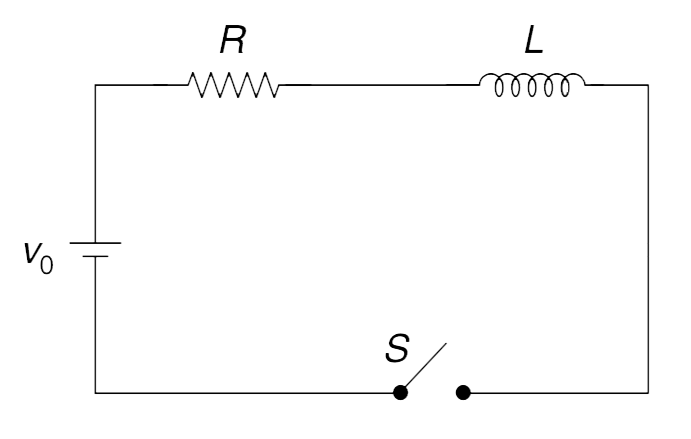
View SolutionA pure inductor coil having inductance L is connected to a resistance R and a cell of emf V0 as shown in the figure. Switch ‘S’ is closed at t = 0.
(a) Plot the variation of voltage across the resistance and the inductance as a function of time
(b) Find the time (t1) when the two curves, obtained in (a) intersect.
(c) A student decides to start counting time from the instant the current becomes half its maximum value. Show the graphical plot of current vs time as obtained by this student.
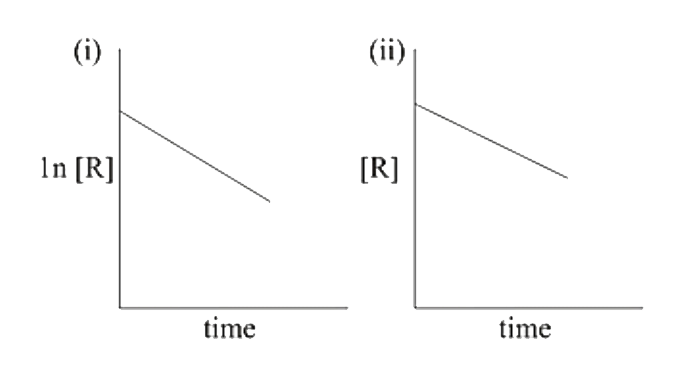
View SolutionThe given plots represent the variation of the concentration of a reactant R with time for two different reaction (i) and (ii) The respective orders of the reactions are
View SolutionThe current I in an inductance coil varies with time according to the graph given in the figure.
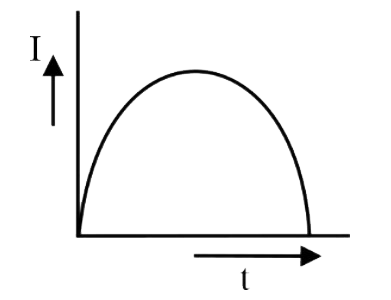
Which one of the following graphs gives the variation of voltage with time across the inductor?
View SolutionIn an L-R circuit connected to a battery of constant e.m.f. E switch S is closed at time t=0. If e denotes the magnitude of induced e.m.f. across inductor and i the current in the circuite at any time t. Then which of the following graphs shows the variation of e with i?
View Solution
