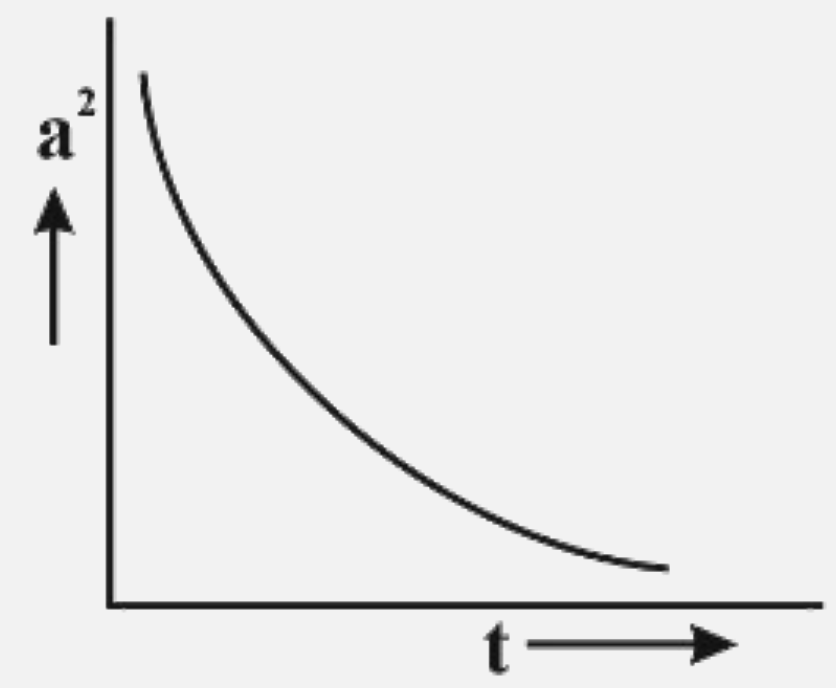
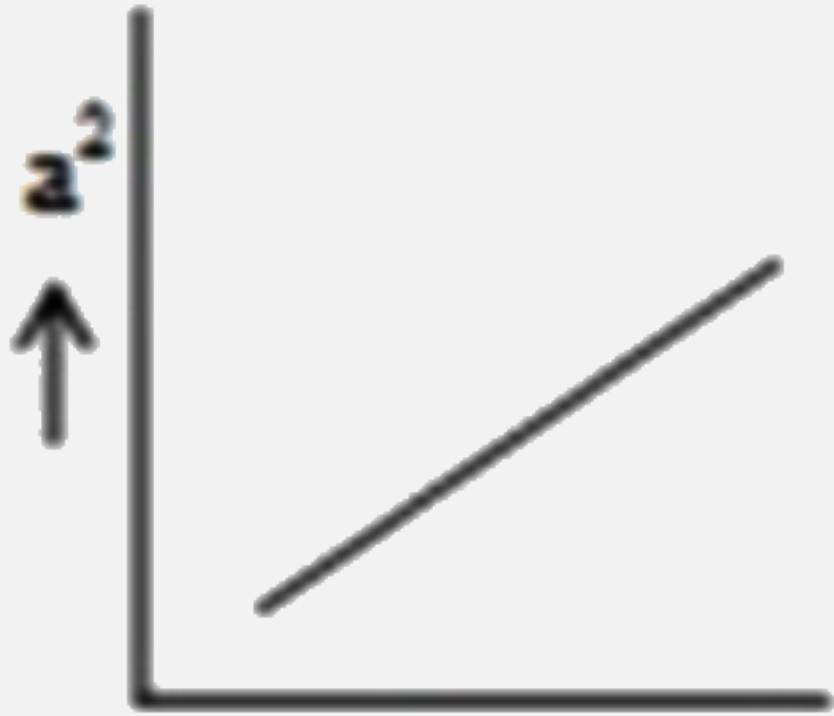
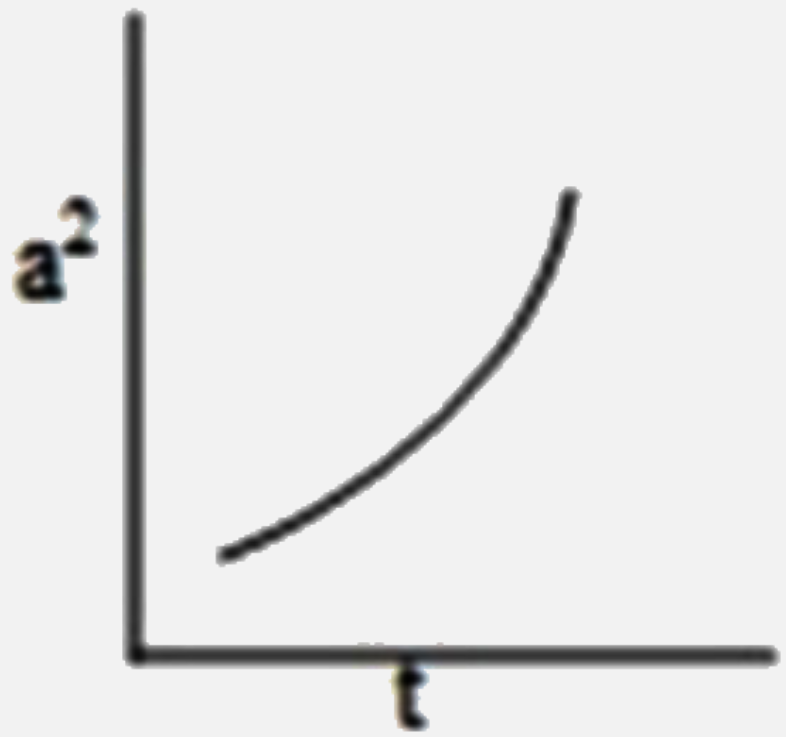
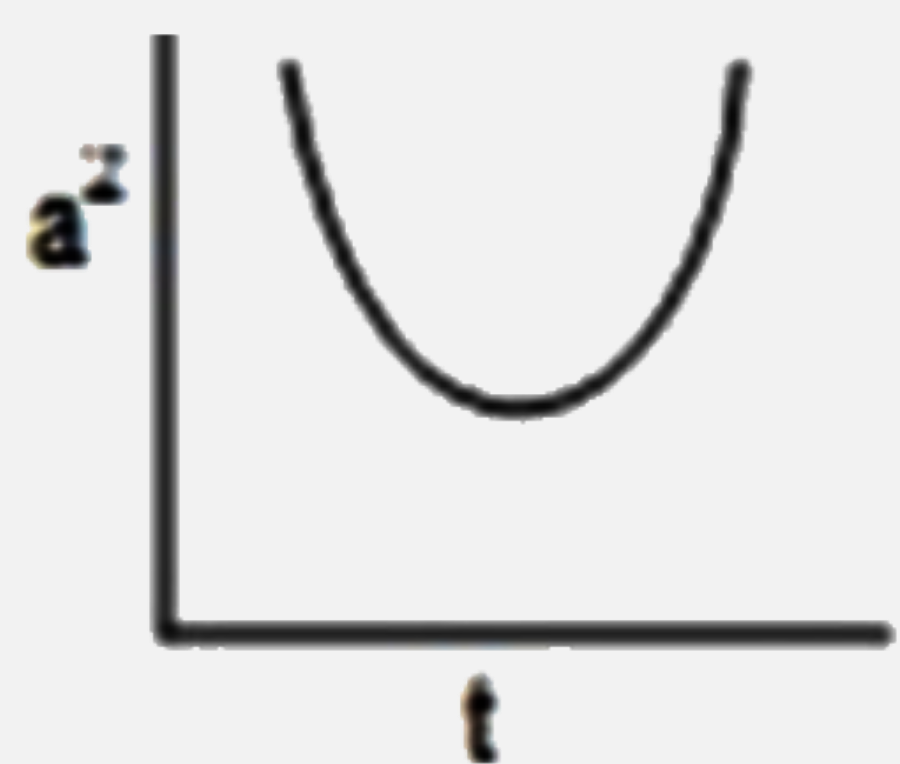
In an experiment , to find the loss of energy with respect to time in case of swinging simple pendulum , the graph between (amplitude)2 and time is
The correct Answer is:A
To solve the question regarding the graph between the square of the amplitude and time for a swinging simple pendulum experiencing energy loss, we can follow these steps:
Step 1: Understand the Concept of Energy Loss in a Pendulum
When a simple pendulum swings, it converts potential energy to kinetic energy and vice versa. However, due to air resistance and friction at the pivot, some energy is lost over time. This loss of energy results in a decrease in the amplitude of the pendulum's swing.
Hint: Think about how energy is conserved in an ideal pendulum versus a real pendulum with energy losses.
Step 2: Analyze the Behavior of Amplitude Over Time
As the pendulum swings back and forth, the amplitude (the maximum displacement from the rest position) will decrease over time due to energy loss. This means that the amplitude is not constant; it diminishes gradually.
Hint: Consider how the pendulum behaves after each swing and how the height it reaches decreases.
Step 3: Relate Amplitude to Time
The amplitude can be related to time in a way that shows a decrease. If we denote the amplitude at time t as A(t), we can say that A(t) decreases over time. The square of the amplitude, A2(t), will also decrease over time.
Hint: Think about how a graph of a decreasing quantity looks over time.
Step 4: Determine the Shape of the Graph
Since the amplitude decreases over time, the graph of A2 versus time will show a downward trend. The relationship can be approximated as an exponential decay, which is often represented as a hyperbolic curve on a graph.
Hint: Visualize or sketch what a graph looks like when a quantity decreases continuously.
Step 5: Conclude the Type of Graph
Based on the analysis, the graph between (amplitude)2 and time will be a decreasing curve, indicating that as time progresses, the square of the amplitude decreases due to the loss of energy.
Hint: Remember that the graph should reflect the continuous loss of energy, leading to a steady decrease in amplitude.
Final Answer
The graph between (amplitude)2 and time for a swinging simple pendulum experiencing energy loss is a downward-sloping curve, indicating a decrease in amplitude over time.
When a simple pendulum swings, it converts potential energy to kinetic energy and vice versa. However, due to air resistance and friction at the pivot, some energy is lost over time. This loss of energy results in a decrease in the amplitude of the pendulum's swing.
As the pendulum swings back and forth, the amplitude (the maximum displacement from the rest position) will decrease over time due to energy loss. This means that the amplitude is not constant; it diminishes gradually.
The amplitude can be related to time in a way that shows a decrease. If we denote the amplitude at time t as A(t), we can say that A(t) decreases over time. The square of the amplitude, A2(t), will also decrease over time.
Since the amplitude decreases over time, the graph of A2 versus time will show a downward trend. The relationship can be approximated as an exponential decay, which is often represented as a hyperbolic curve on a graph.
Based on the analysis, the graph between (amplitude)2 and time will be a decreasing curve, indicating that as time progresses, the square of the amplitude decreases due to the loss of energy.
The graph between (amplitude)2 and time for a swinging simple pendulum experiencing energy loss is a downward-sloping curve, indicating a decrease in amplitude over time.
Topper's Solved these Questions
Similar Questions
Knowledge Check
- Question 1 - Select One
In an experiment , to find the loss of energy with respect to time in case of swinging simple pendulum , the graph between (amplitude)2 and time is
A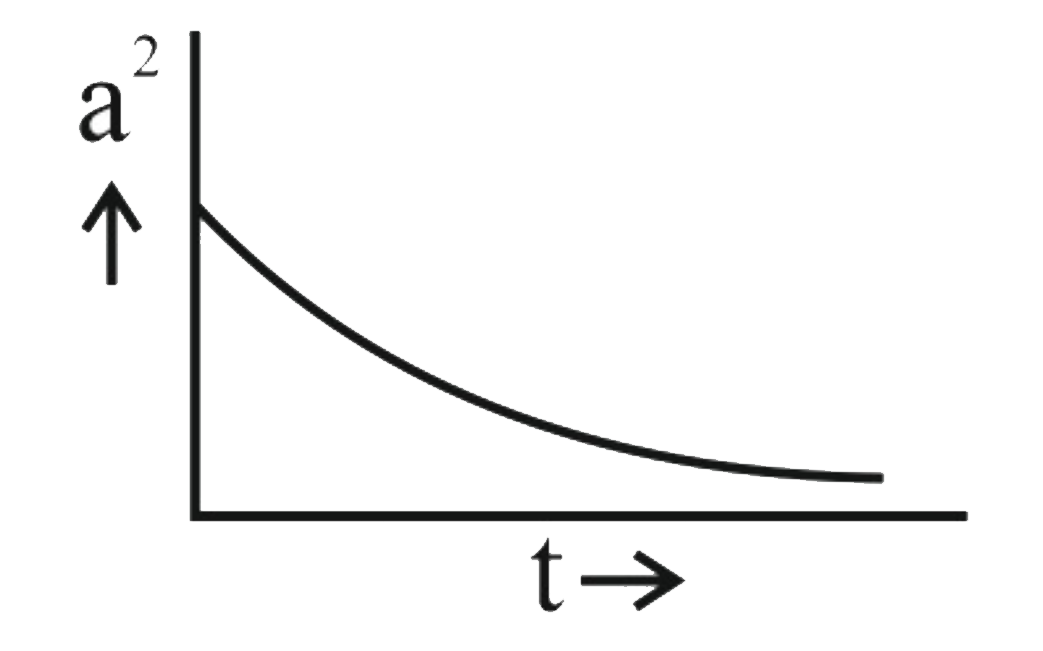 B
B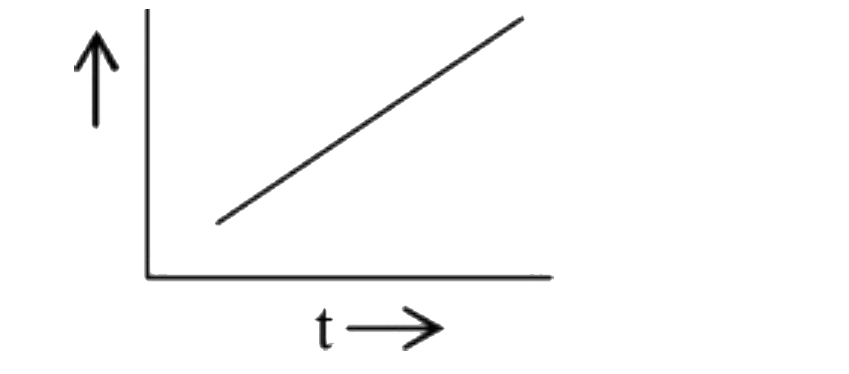 C
C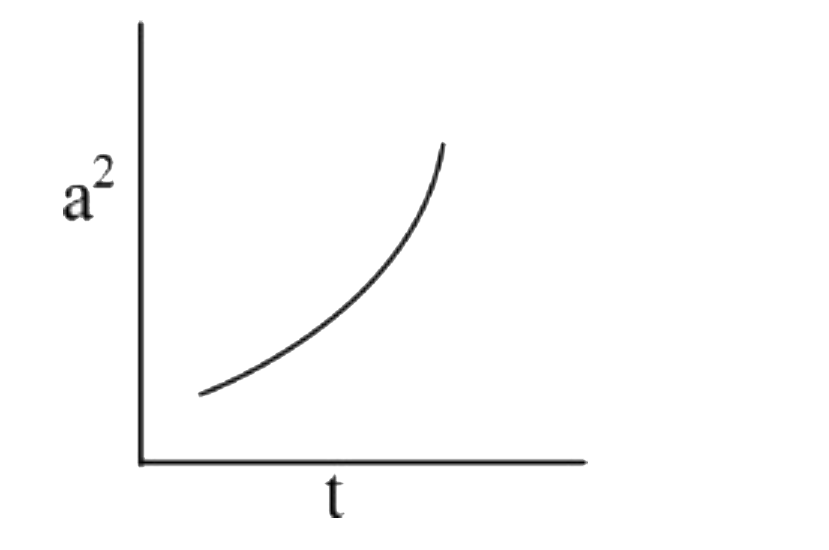 D
D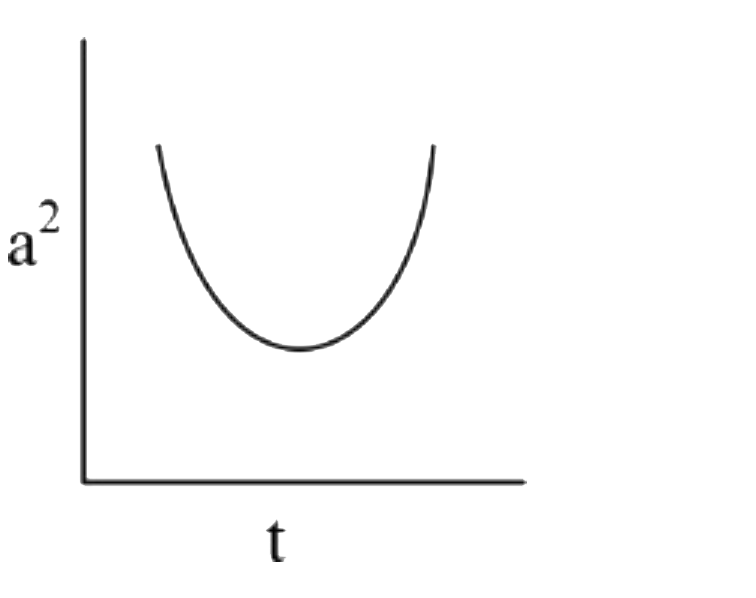
- Question 2 - Select One
For a simple pendulum the graph between length and time period will be
A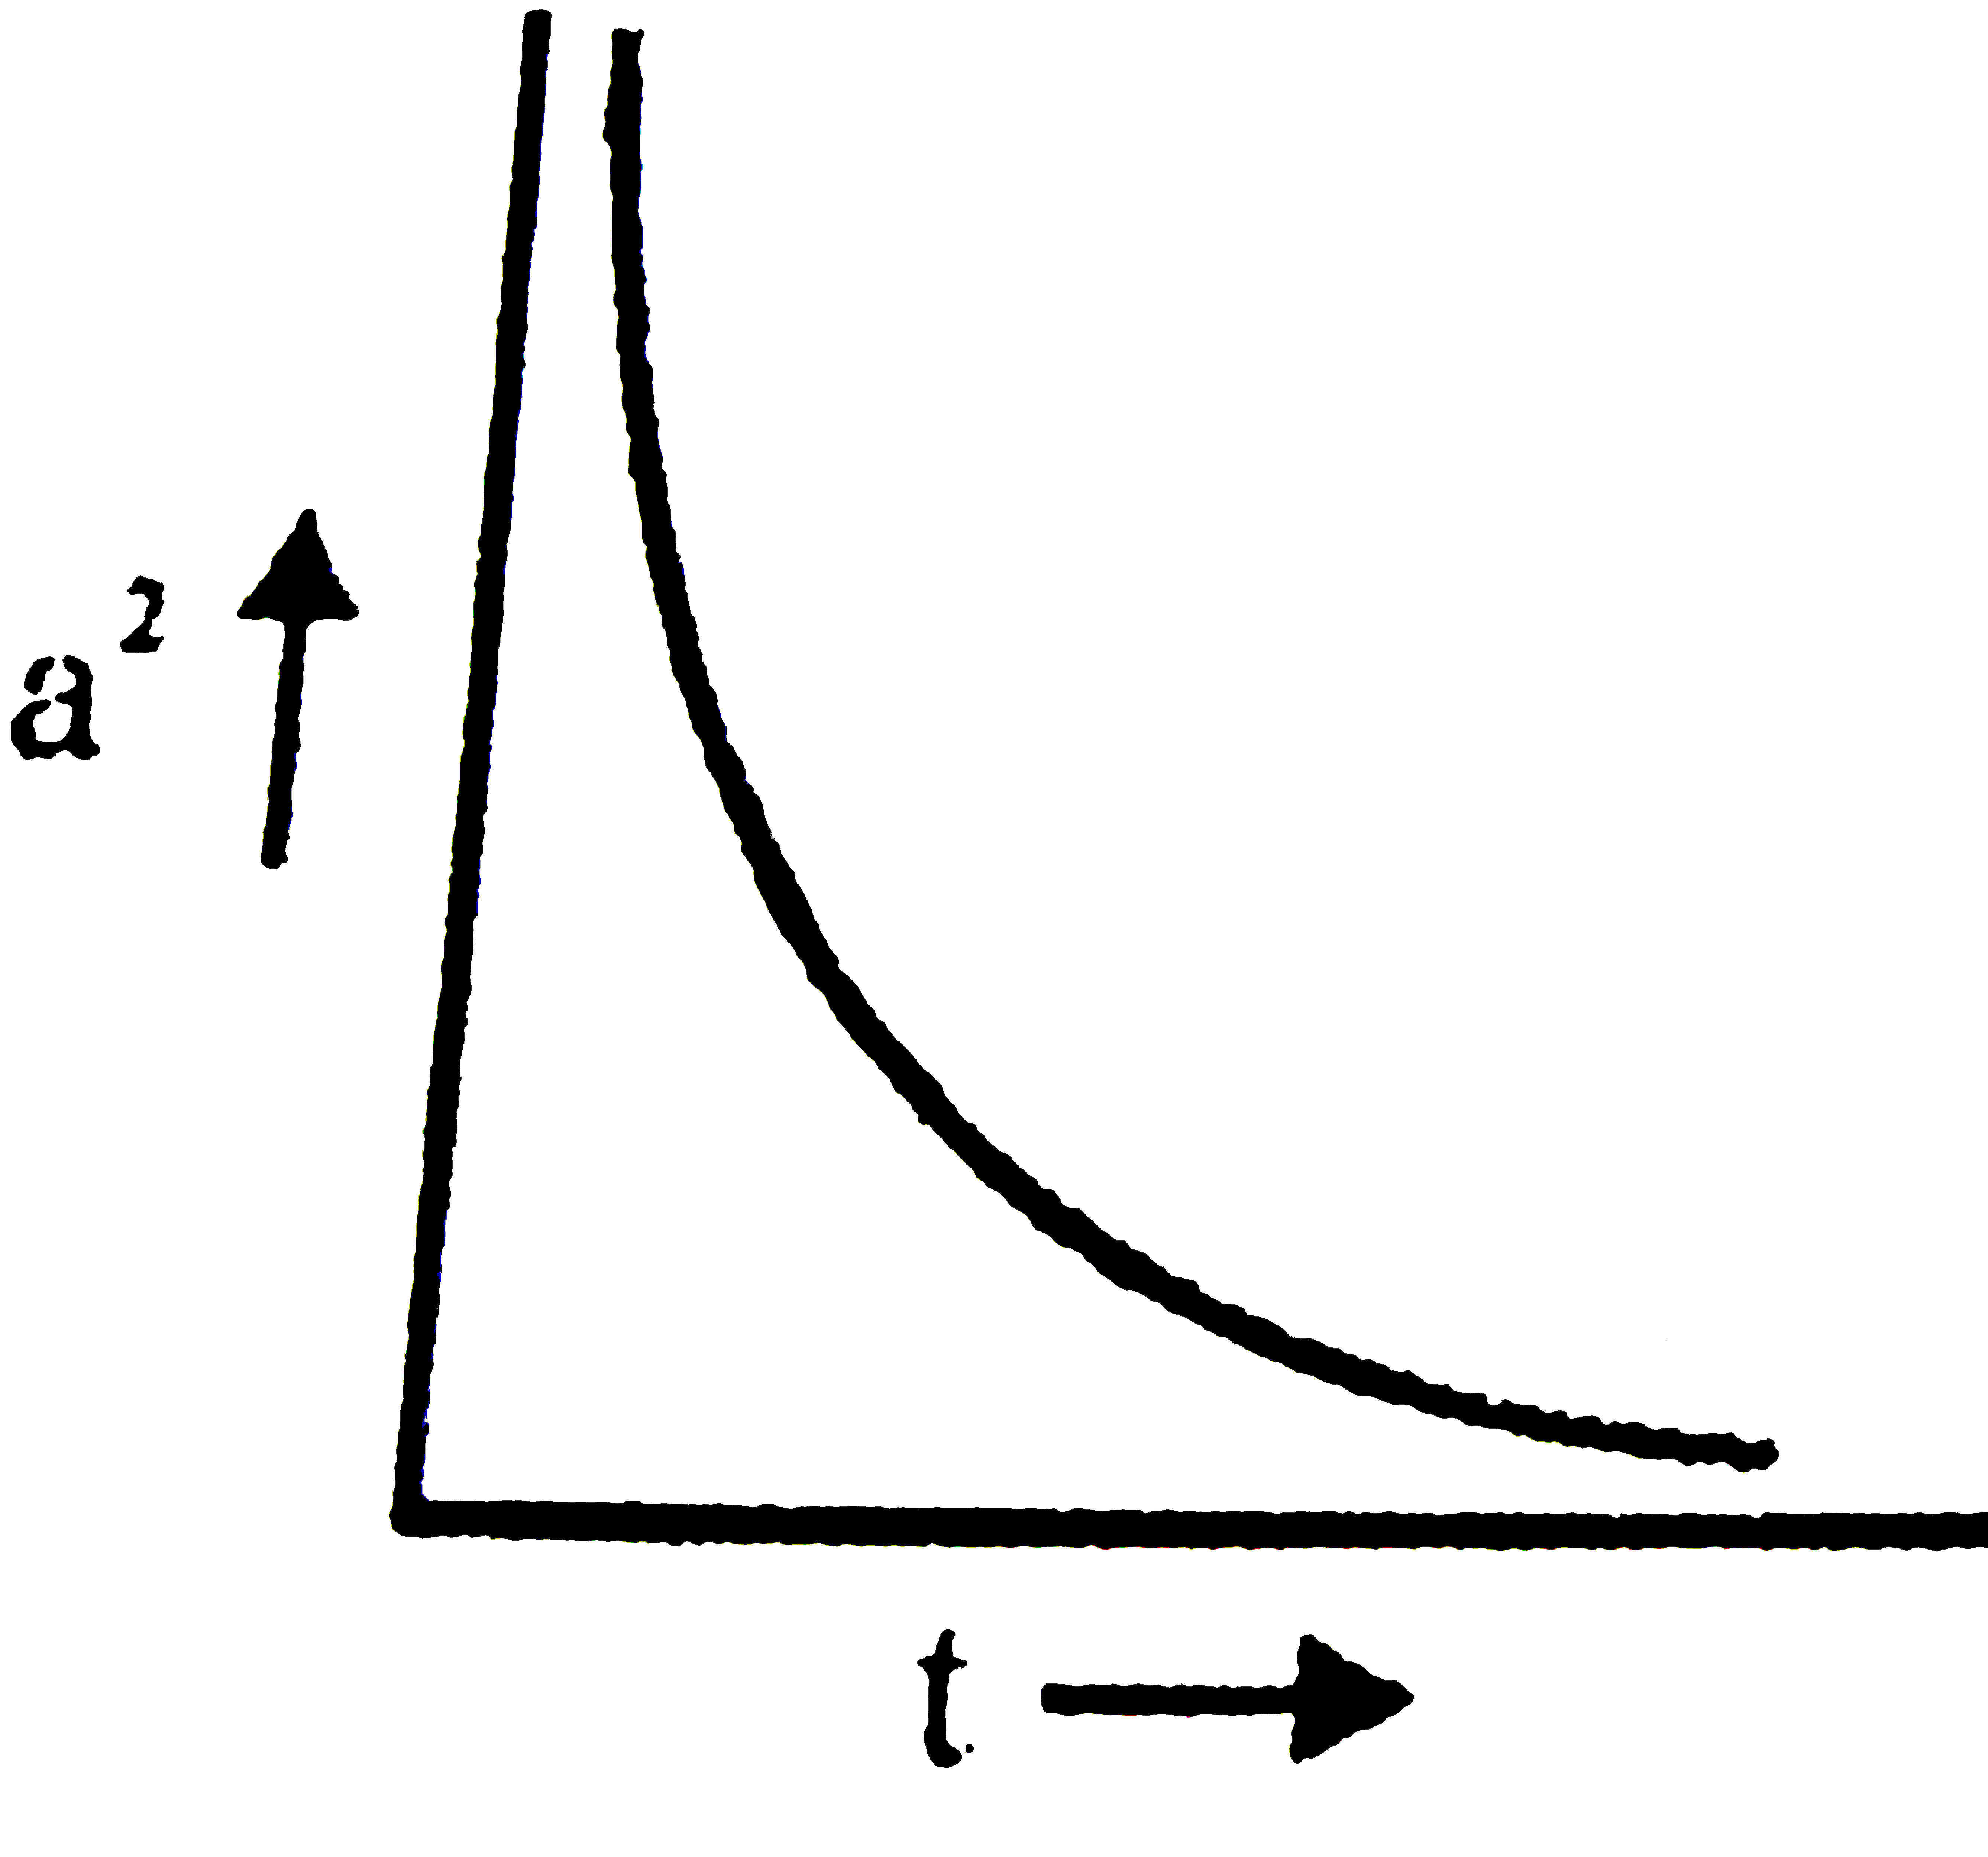 B
B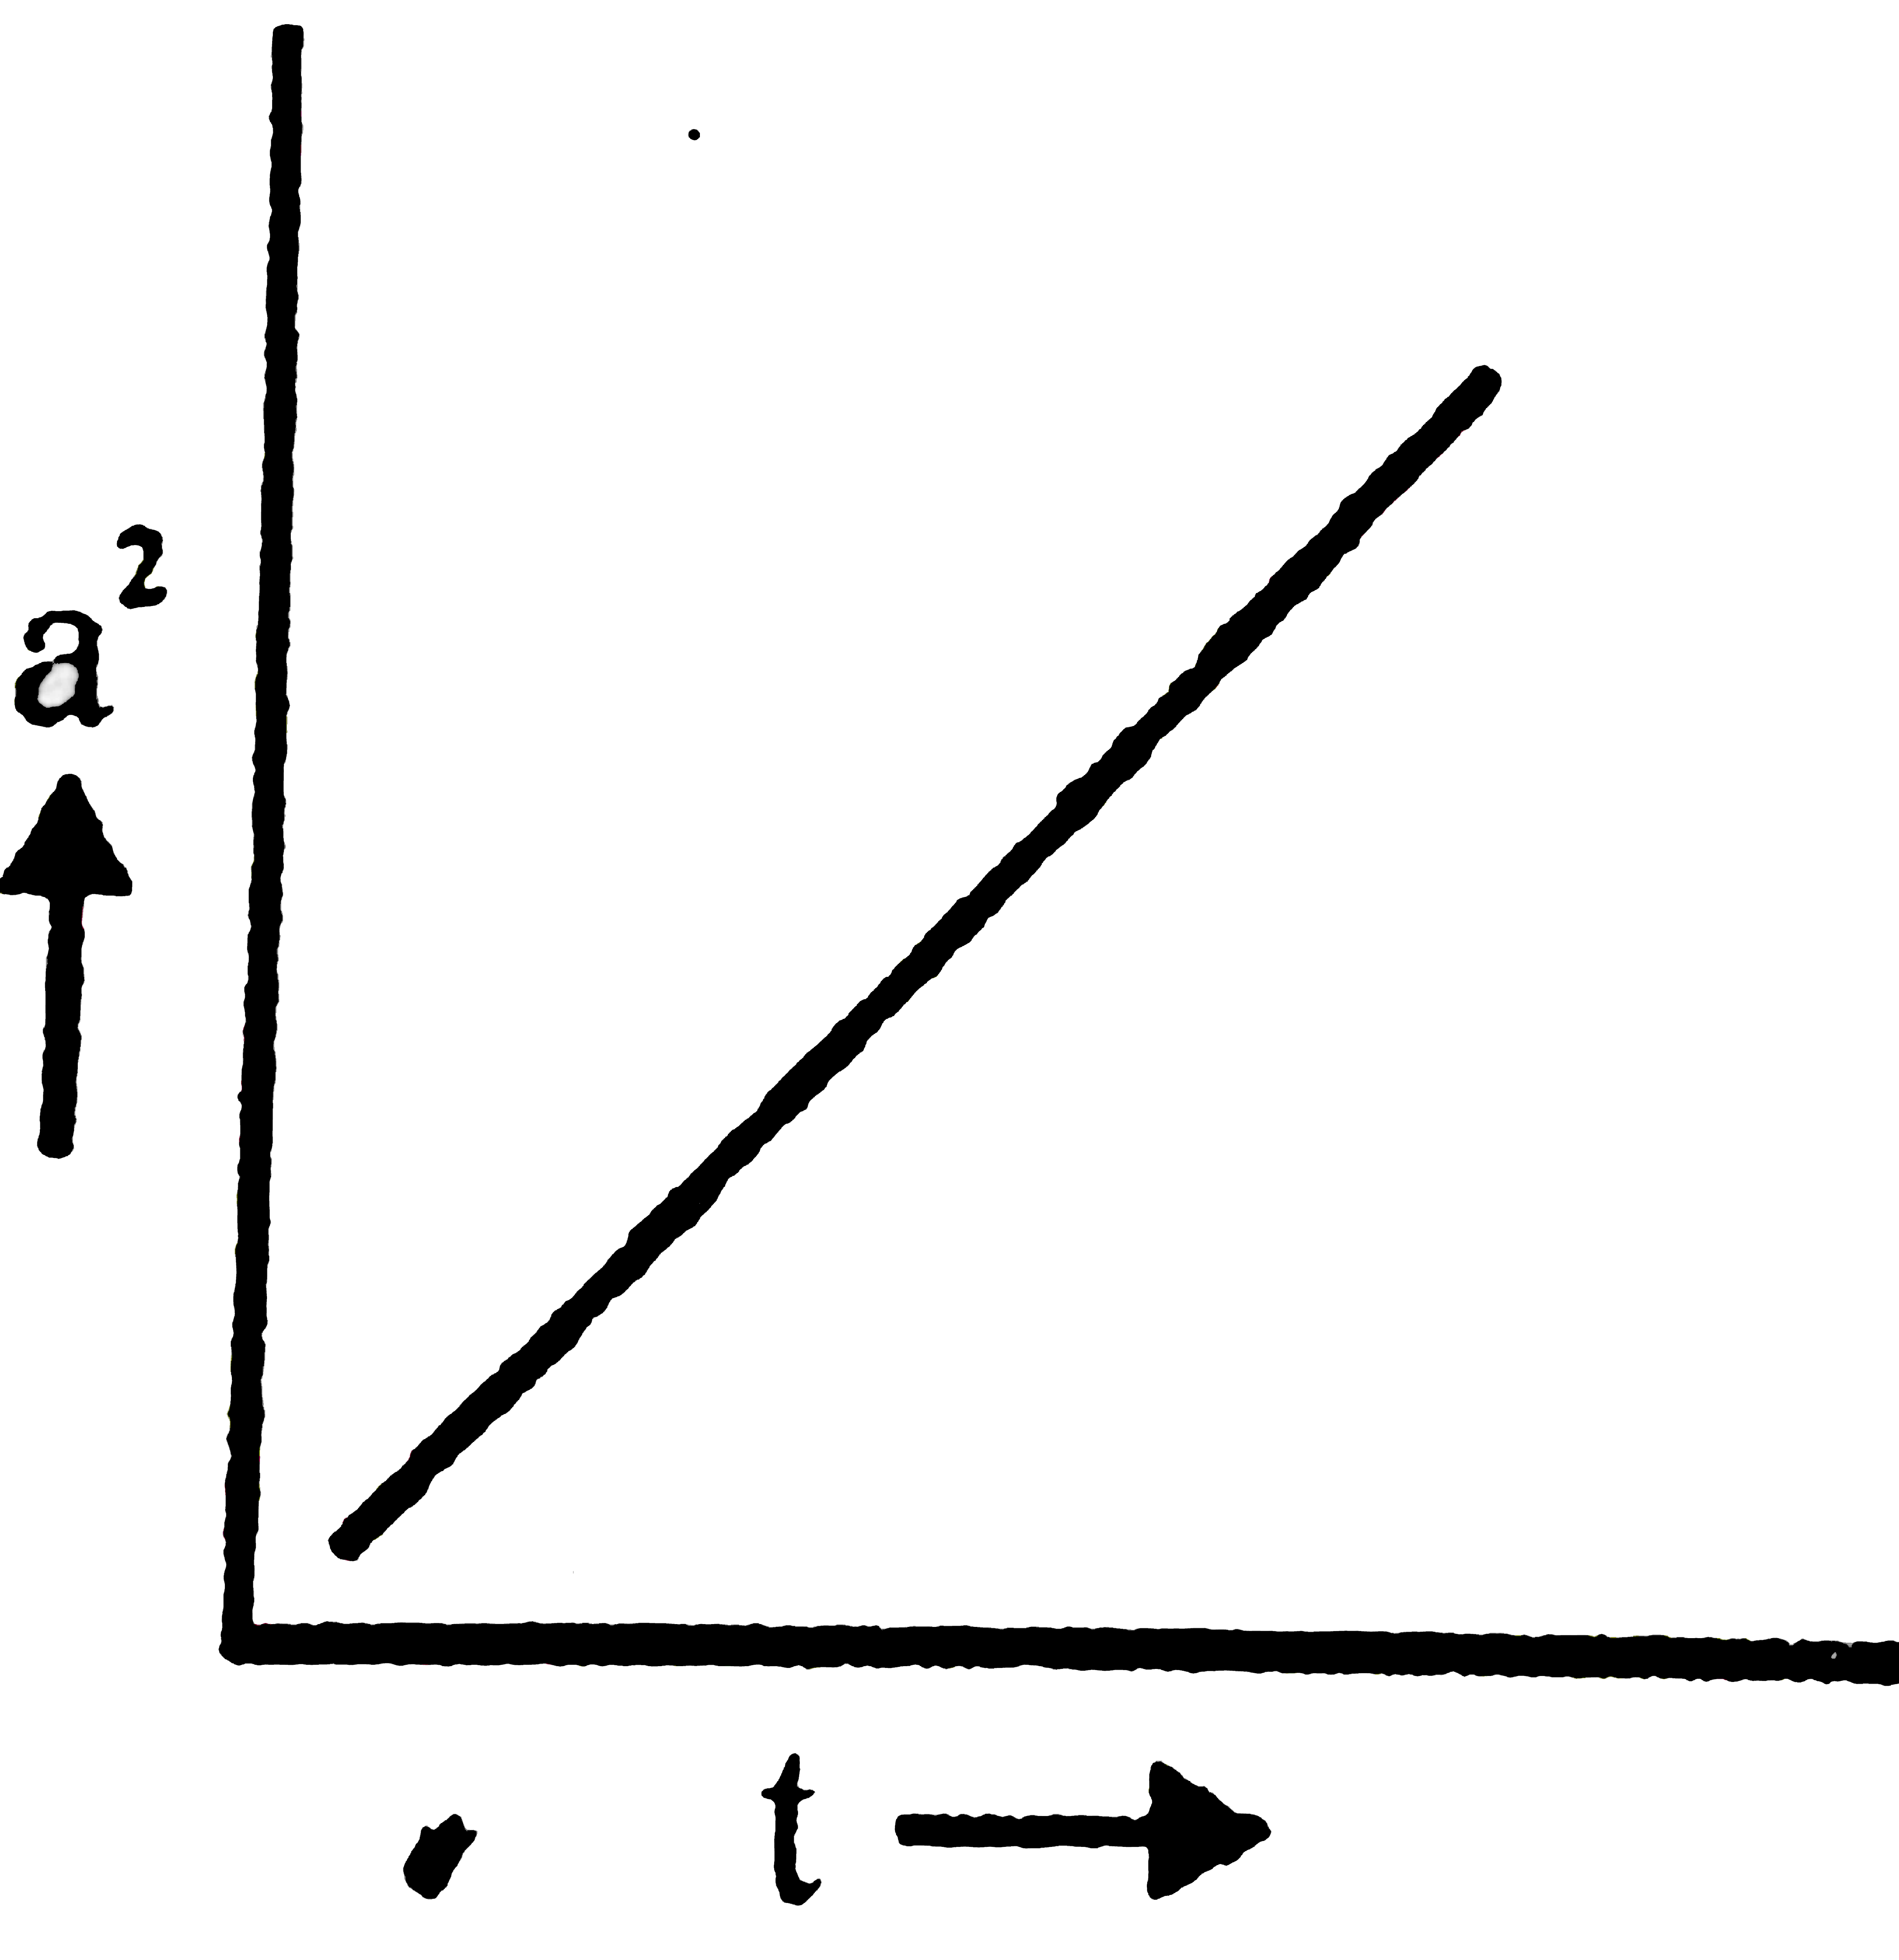 C
C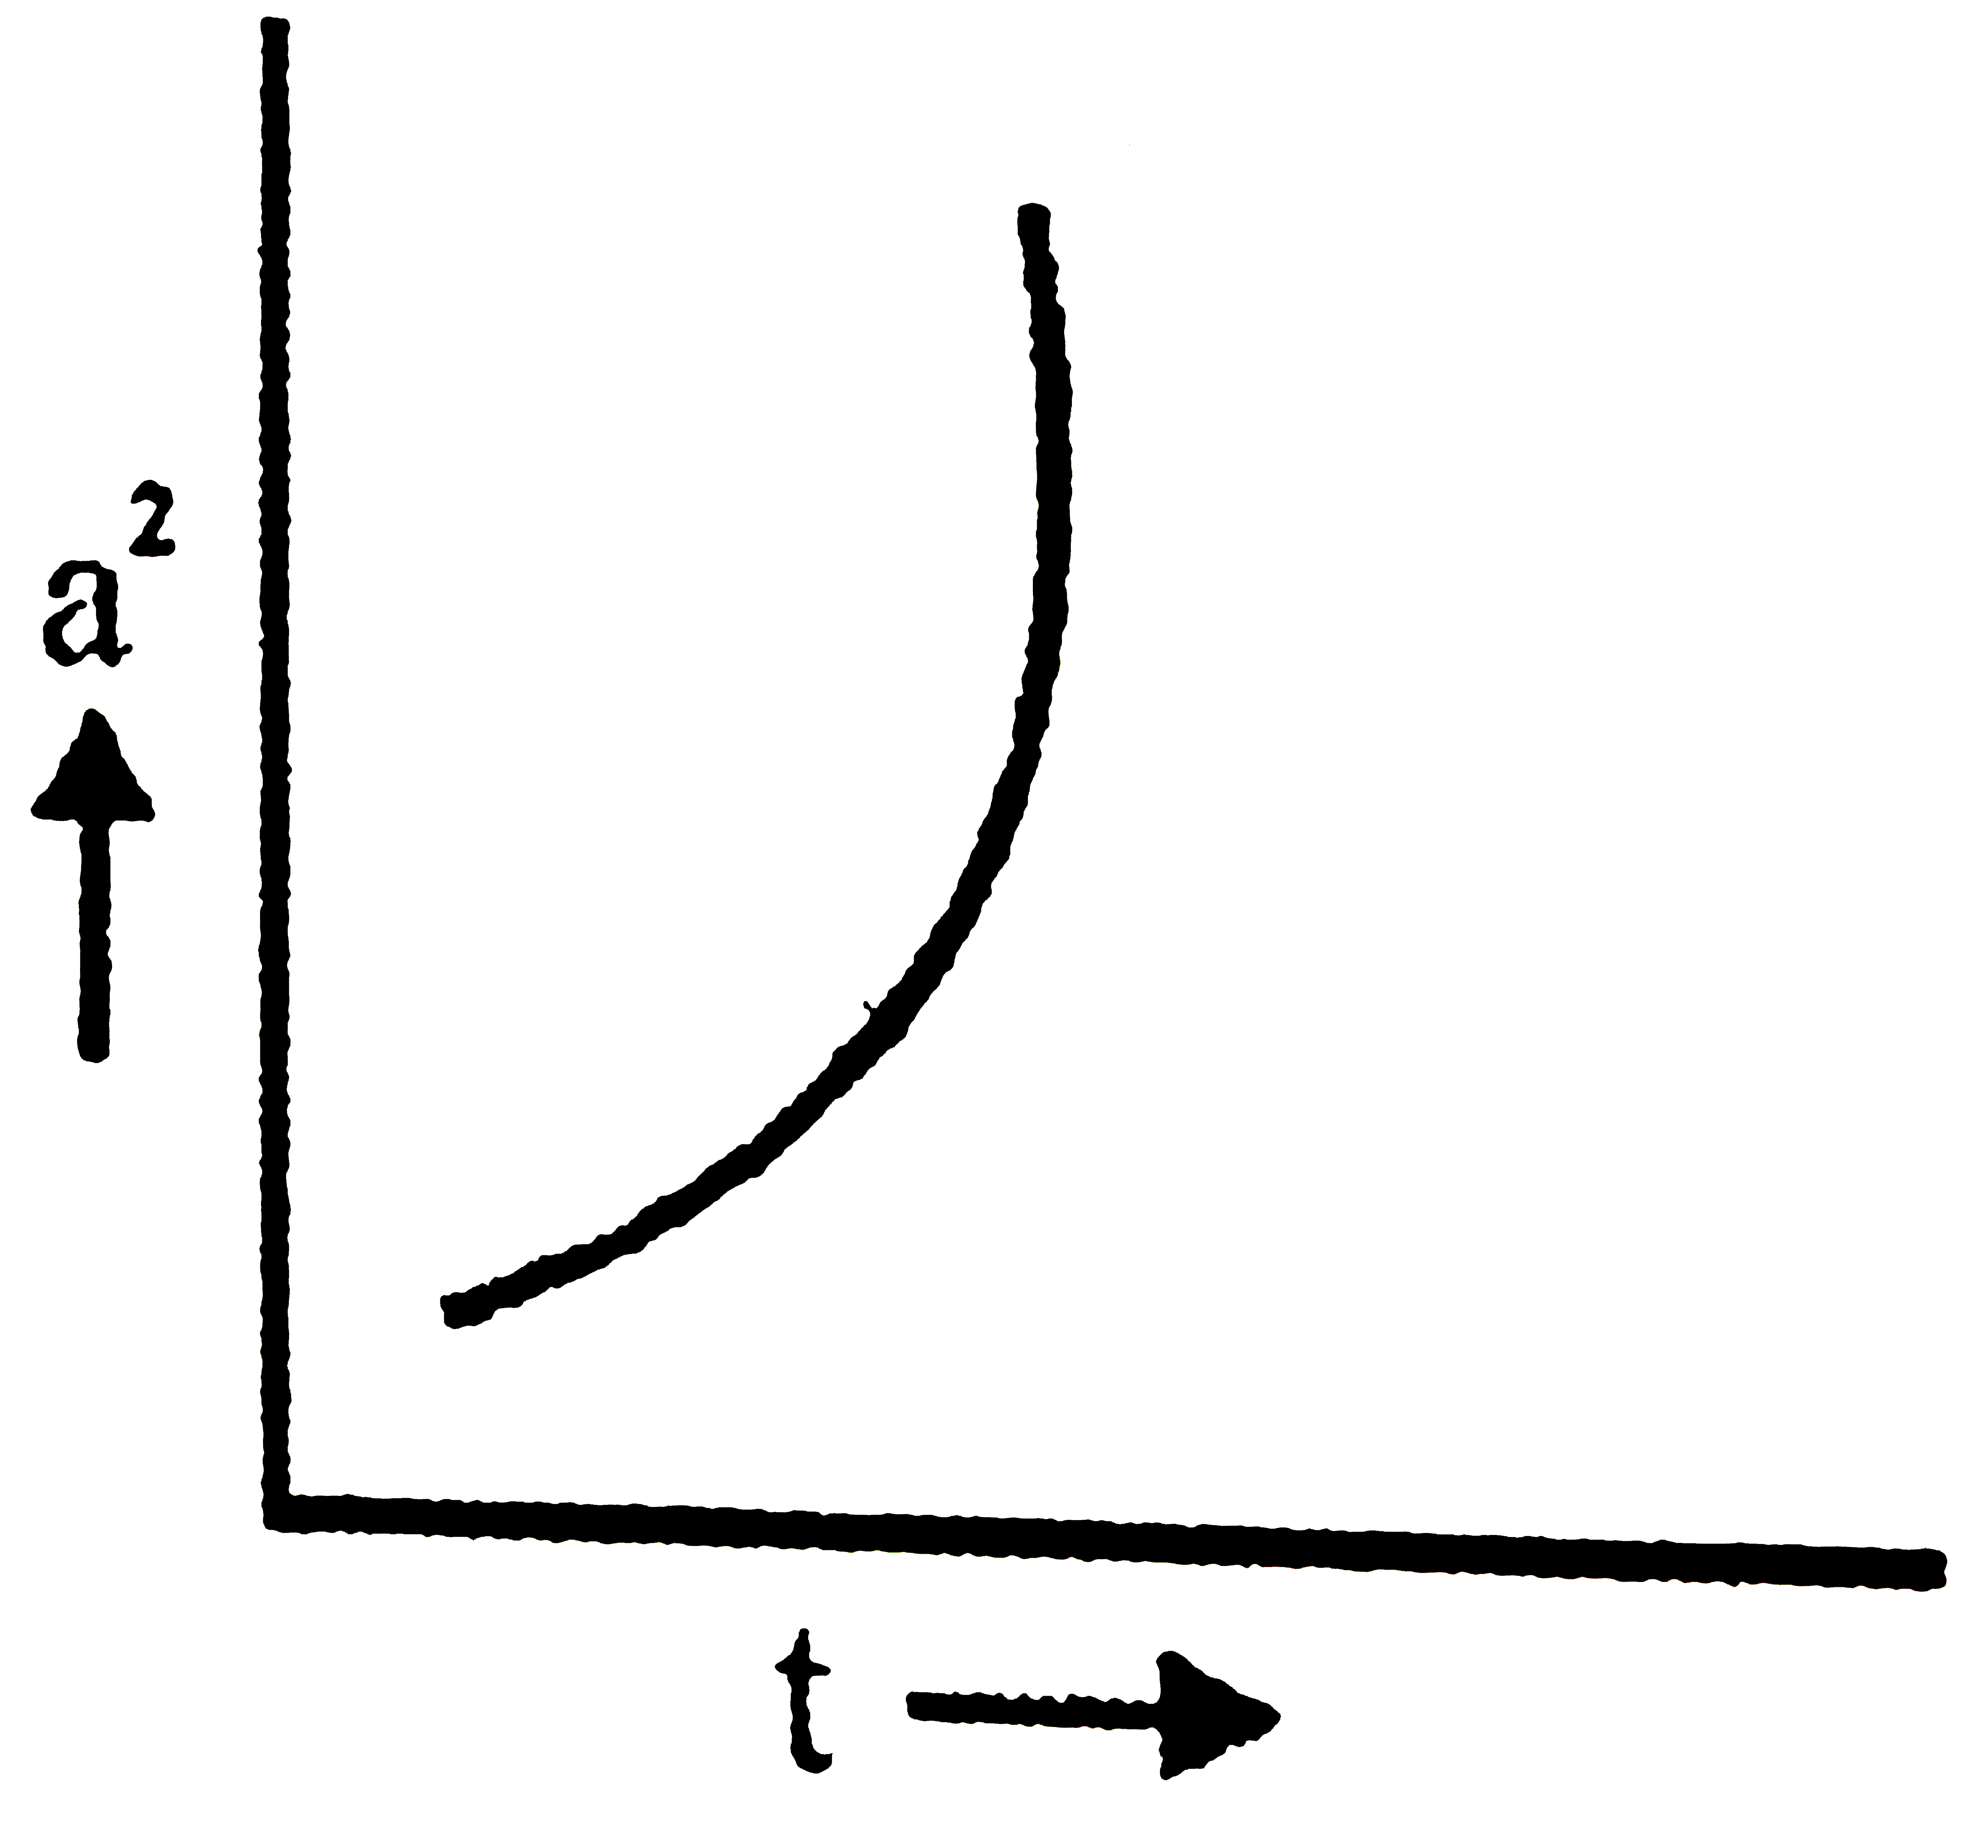 D
D
- Question 3 - Select One
For a simple pendulum the graph between length and time period will be
AhyperbolaBparabolaCstraight lineDnone of these
Time period of simple pendulum is
View SolutionTime period of simple pendulum increase with
View SolutionIn case of a simple pendulum, time period versus length is depicted by
View SolutionThe time period of a simple pendulum in a satellite is
View SolutionThe graph of time period (T) of simple pendulum versus its length (l) is
View Solution

