Which of the following graphs accurately represents the insulin levels (Y-axis) in the body as a function of time (X-axis) after eating sugar and bread/roti?
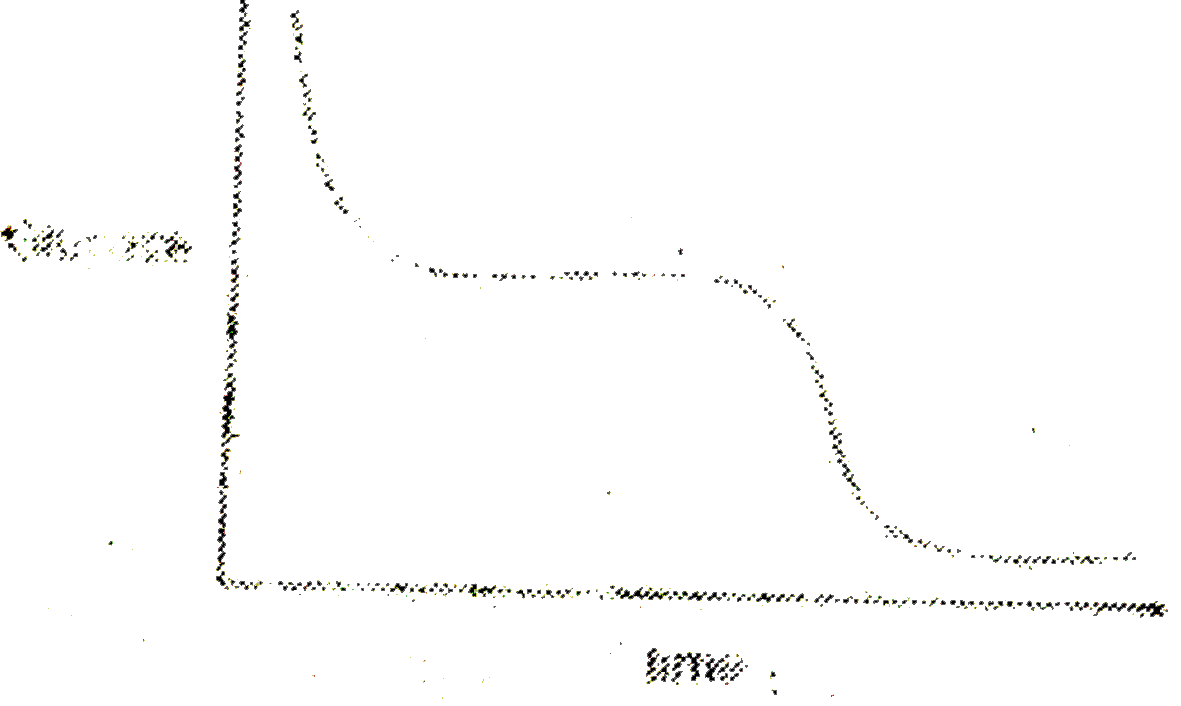

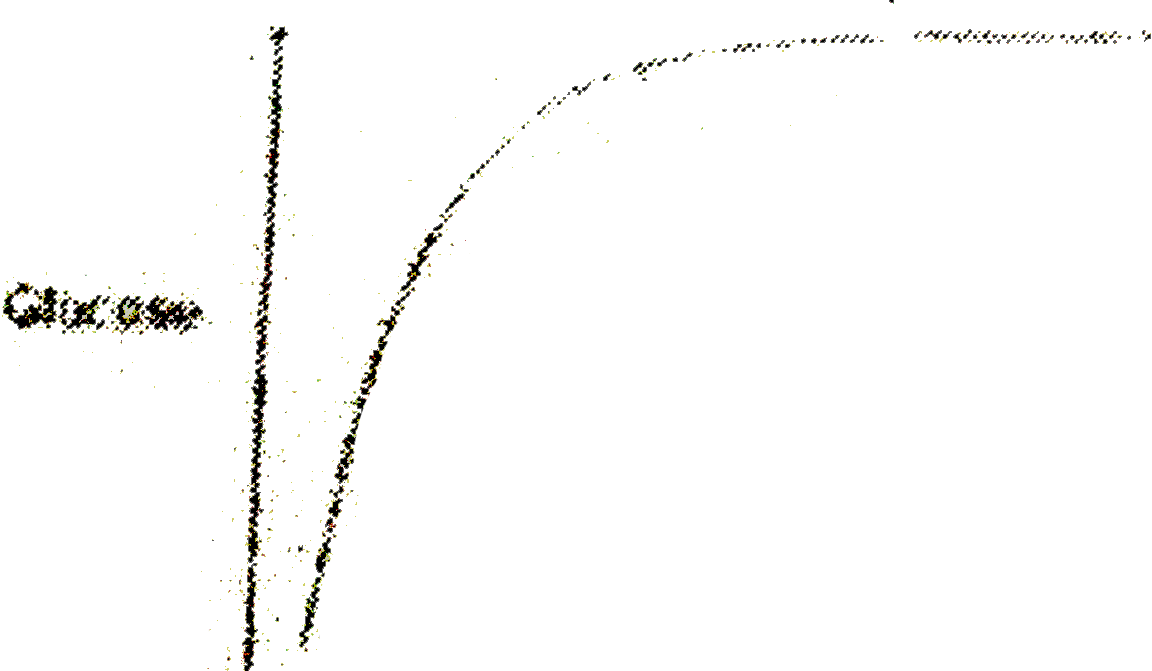

The correct Answer is:A
Step by step video, text & image solution for Which of the following graphs accurately represents the insulin levels (Y-axis) in the body as a function of time (X-axis) after eating sugar and bread/roti? by Biology experts to help you in doubts & scoring excellent marks in Class 12 exams.
Updated on:21/07/2023Topper's Solved these Questions
- KVPYBOOK - KVPY PREVIOUS YEARCHAPTER - KVPYEXERCISE - PART -I BIOLOGY
19 Videos
- KVPYBOOK - KVPY PREVIOUS YEARCHAPTER - KVPYEXERCISE - PART-II MATHEMATICS
1 Videos
- KVPYBOOK - KVPY PREVIOUS YEARCHAPTER - KVPYEXERCISE - PART-2 CHEMISTRY
5 Videos
- KVPY 2021BOOK - KVPY PREVIOUS YEARCHAPTER - KVPY 2021EXERCISE - PART I BIOLOGY
19 Videos
Similar Questions
Knowledge Check
Which of the following equation represents a line parallel to y axis
A2x=3yB2y=4C2x=4D2x-3y=9Which of the following equations represents a line parallel to x axis
A2x+3=0B2y+2=0C2x+3y=0D2x-3y=0Which of the following x-t graphs represents the distance-time variation of a body released from the top of a buiding?
A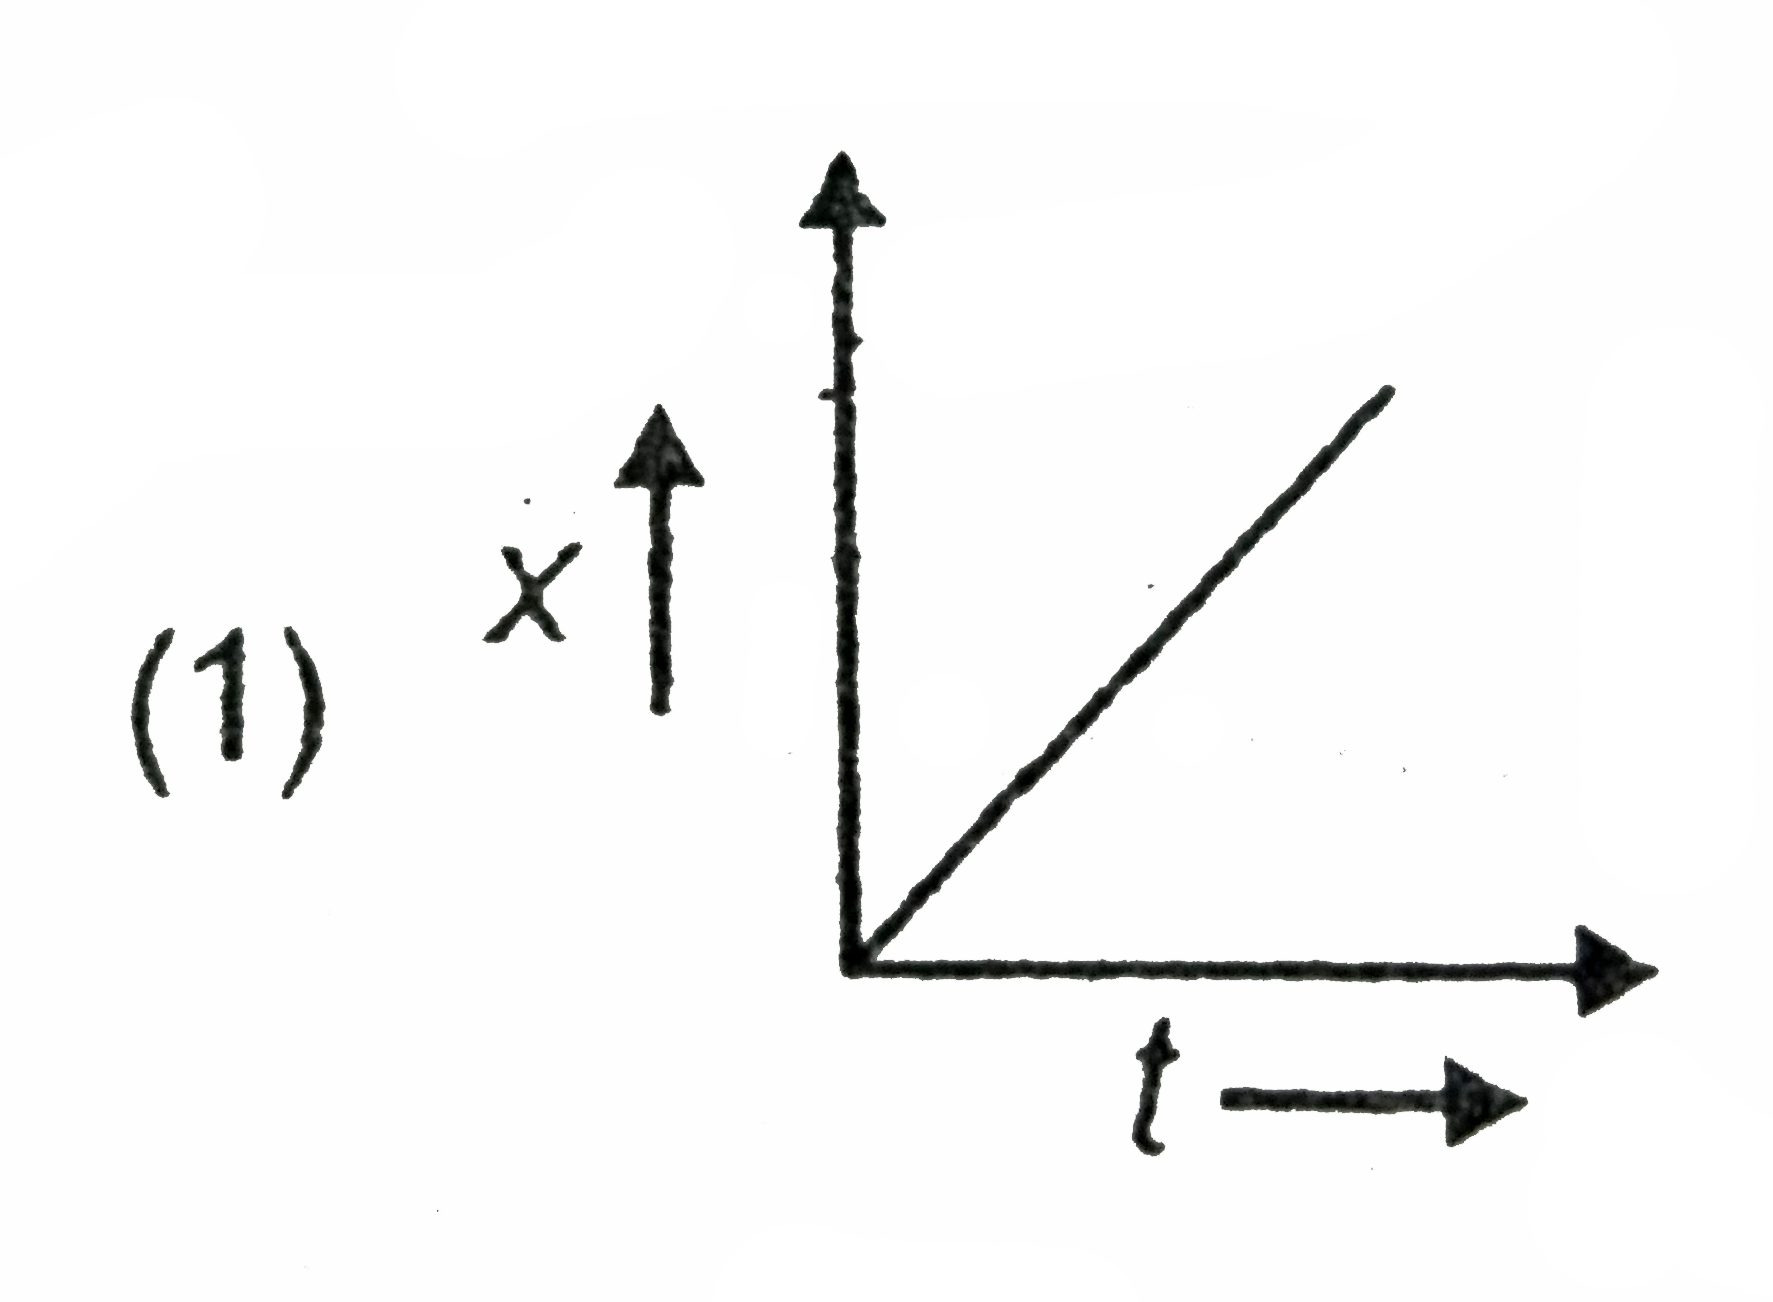 B
B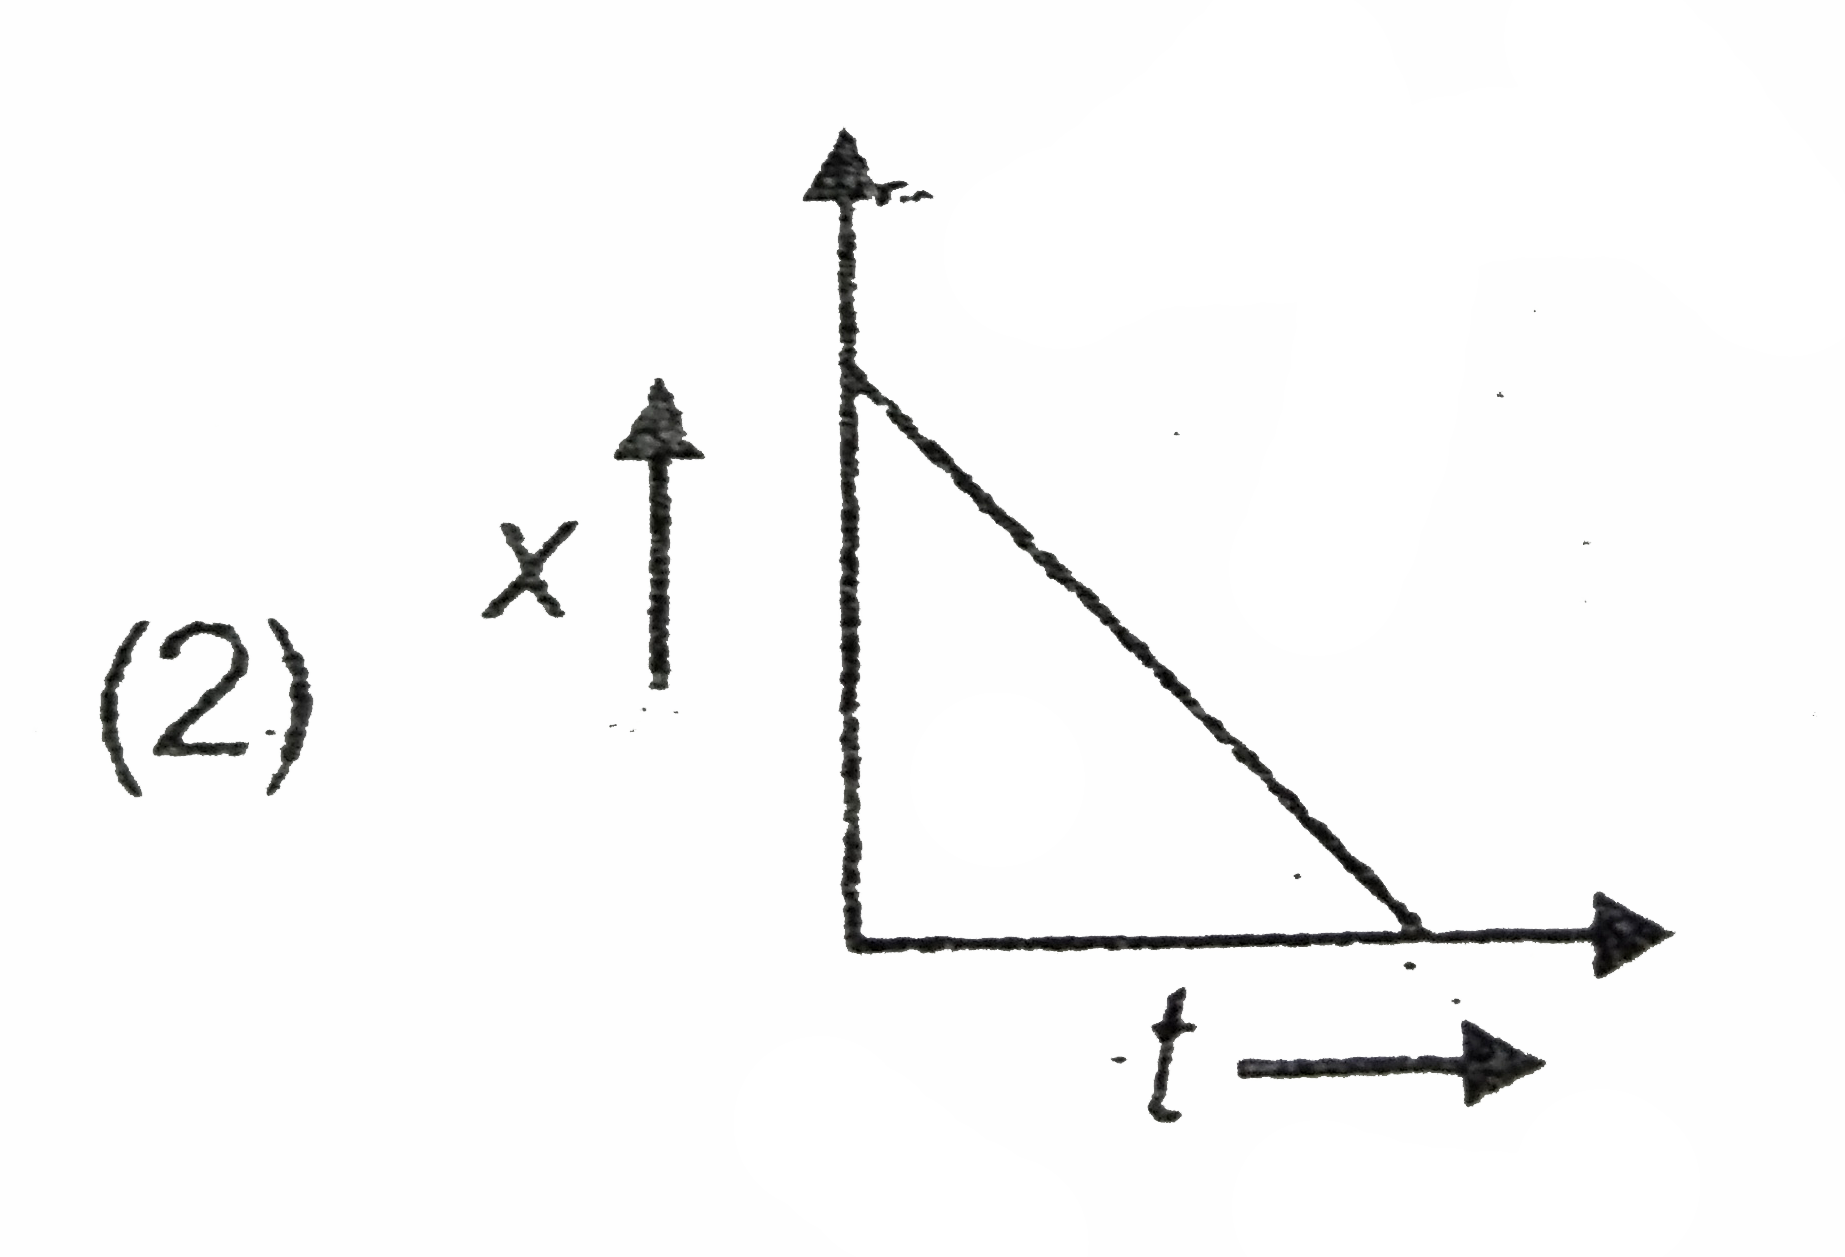 C
C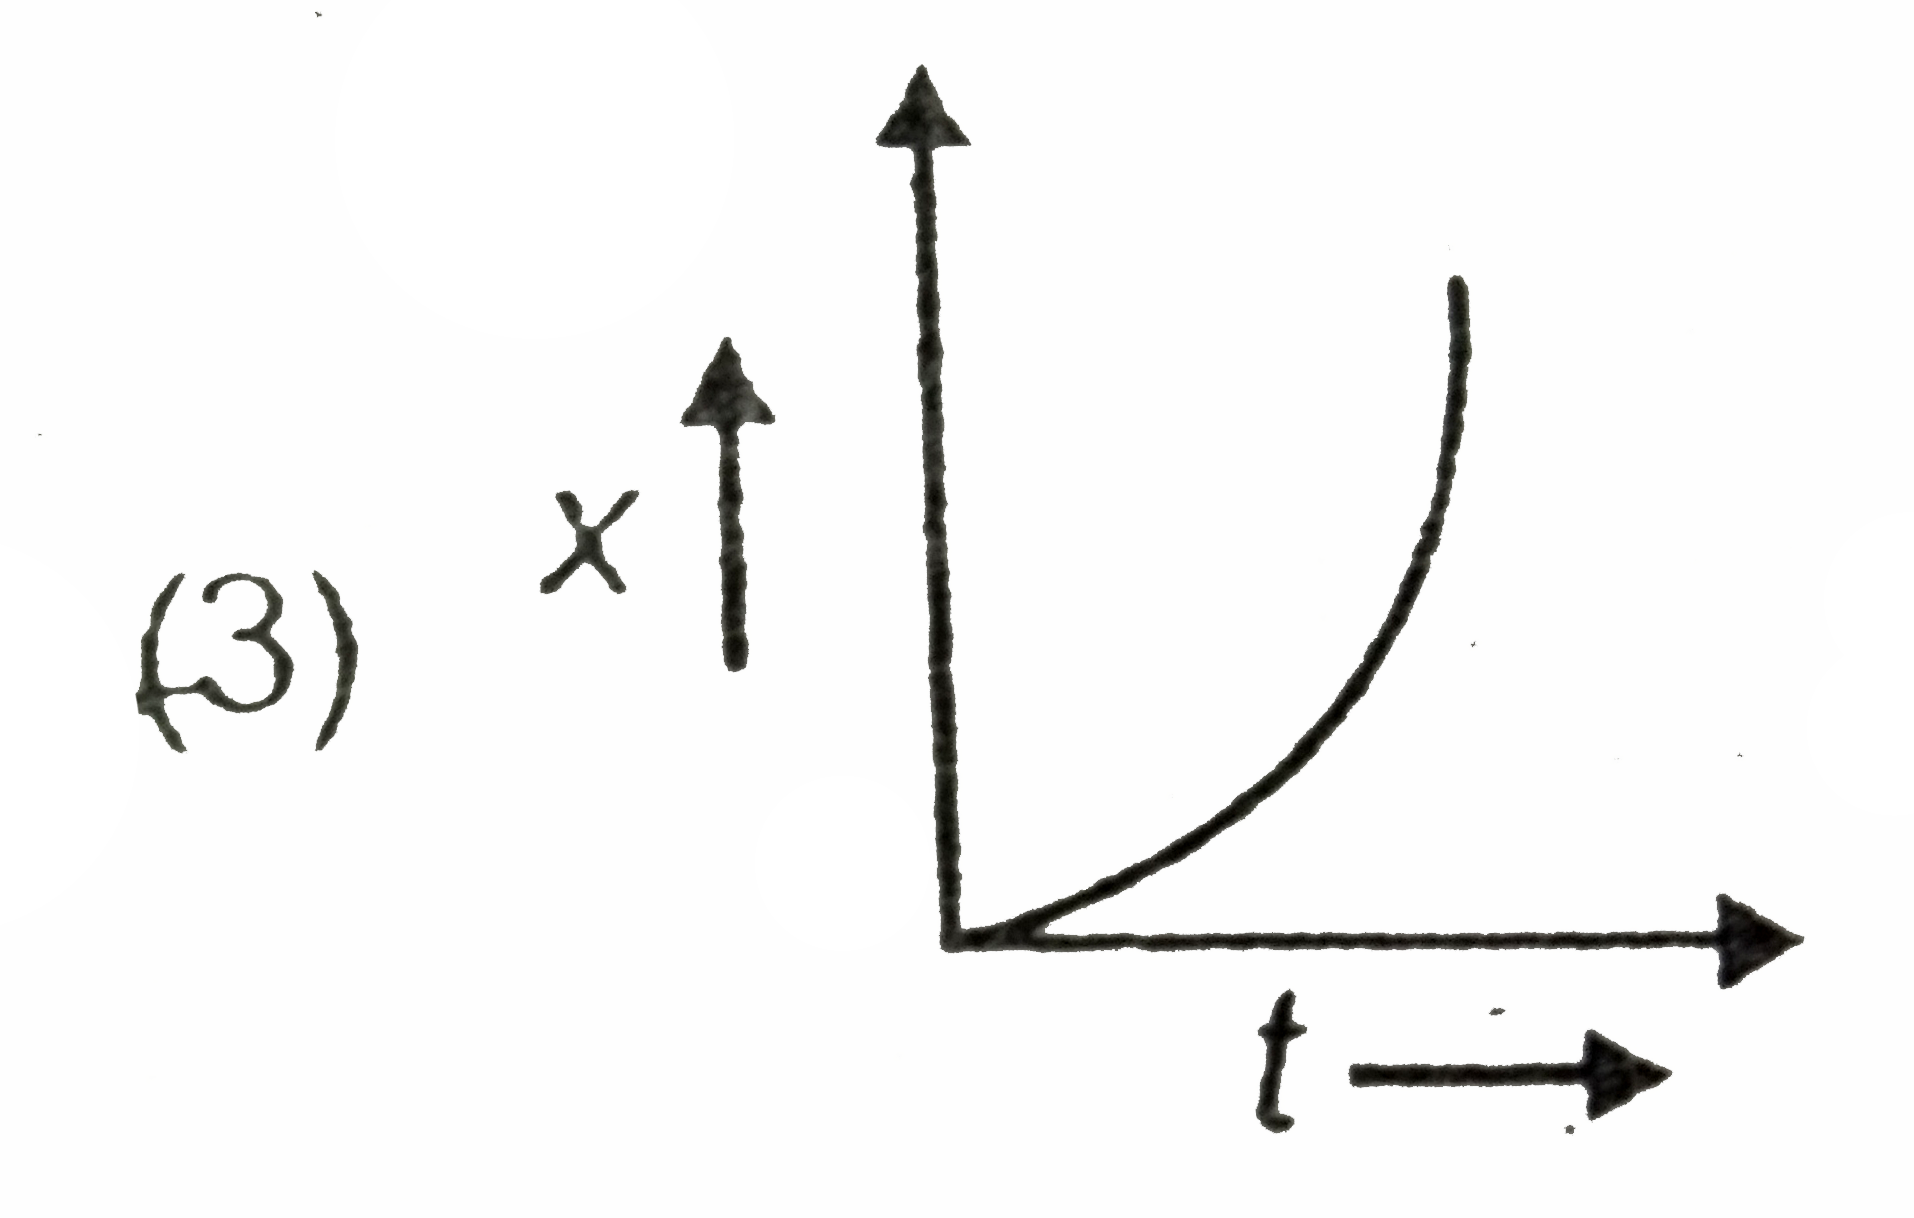 D
D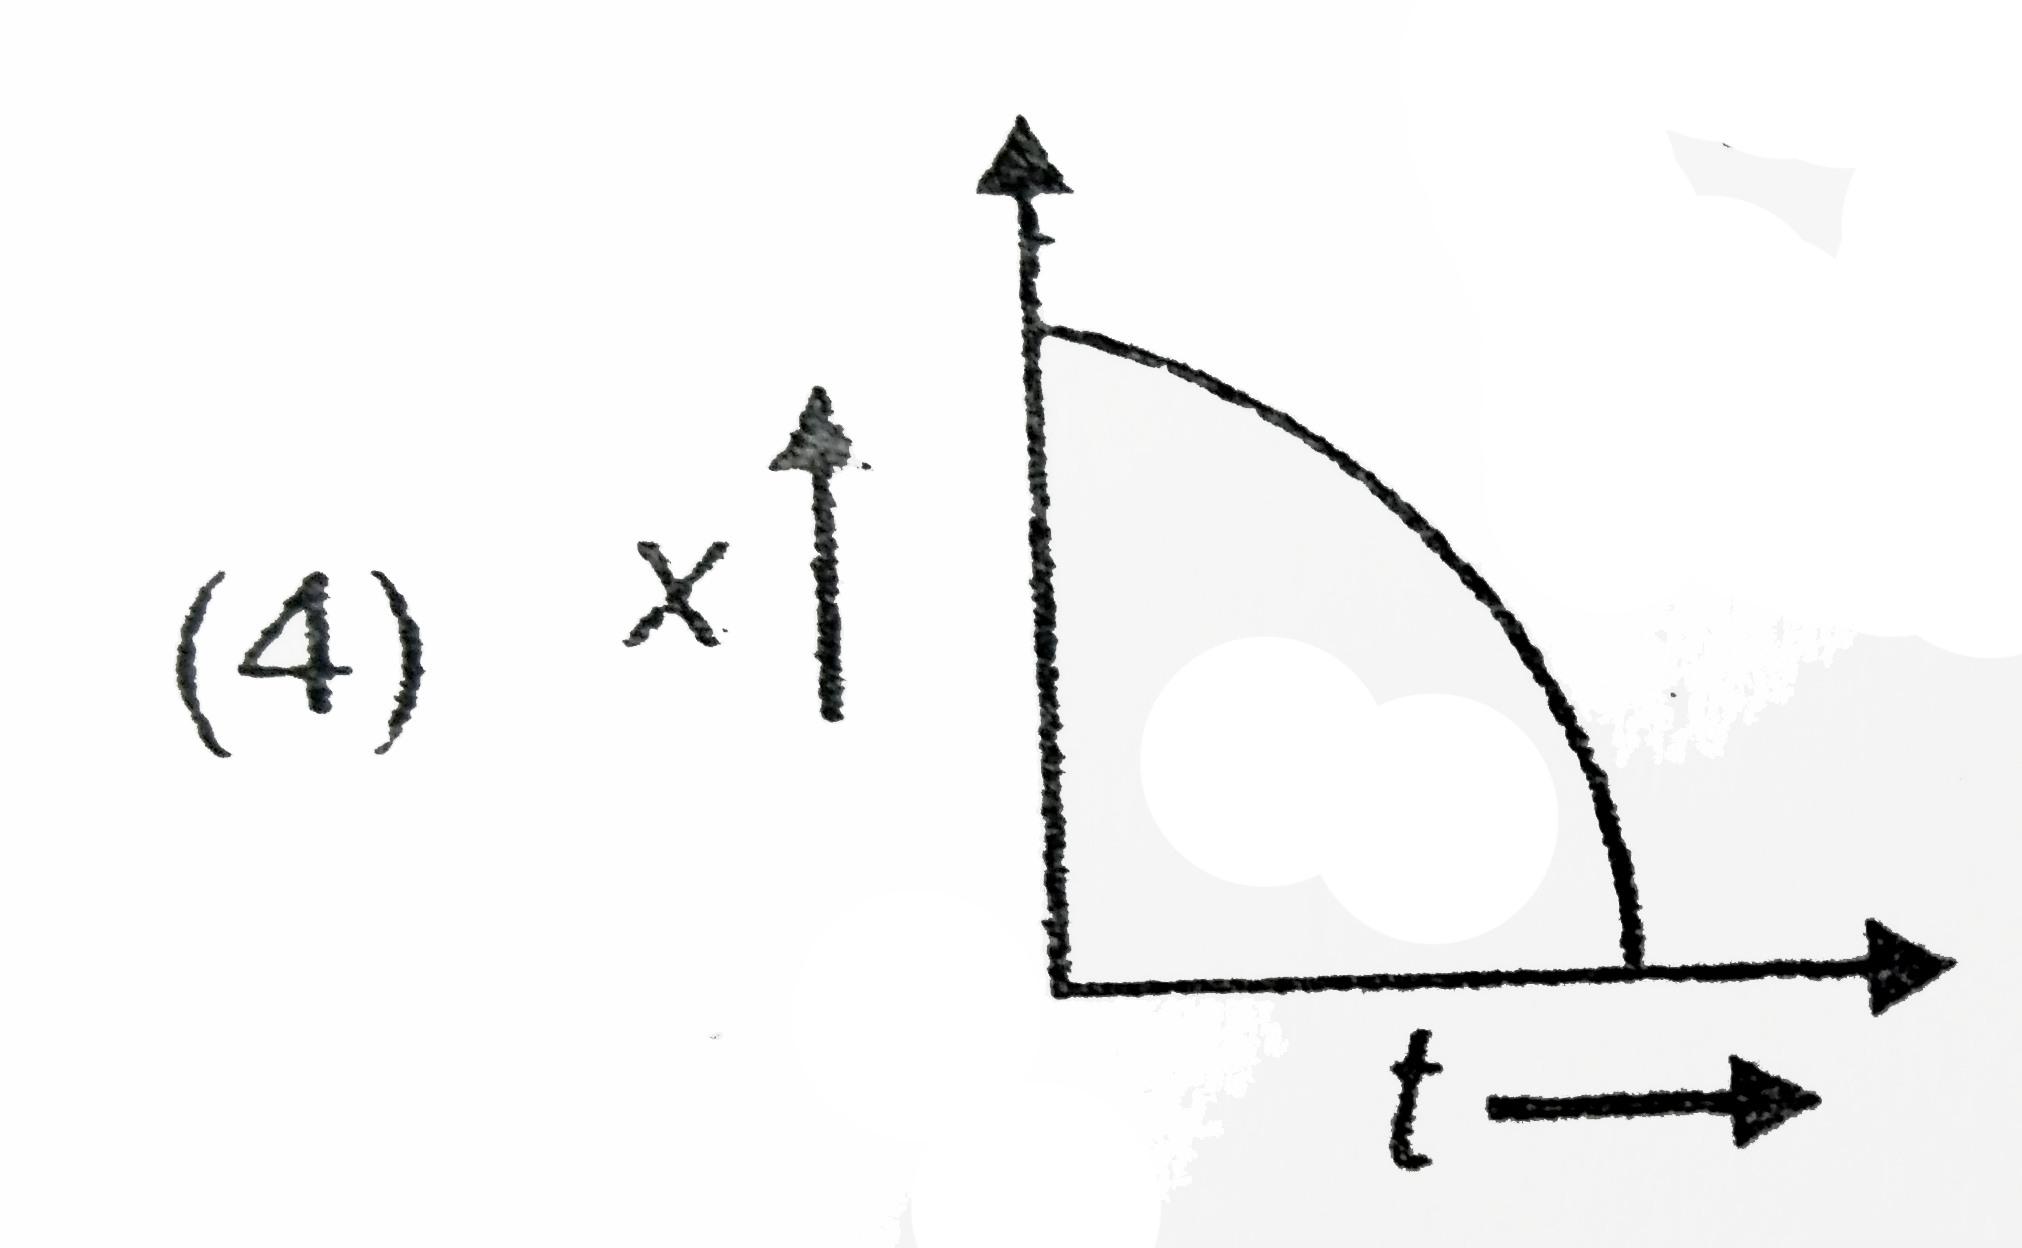
Which of the following equations represents as wave travelling along Y-axis?
View SolutionWhich of the following equations represents as wave travelling along Y-axis?
View SolutionFour point charges are kept on y-axis at (0,a),(0,2a),(0,−a)and(0,−2a) as shown in the figure. Which of the following graphs, best represents the variation of electrostatic potential V as a function of distance x from the origin, on the x-axis.

View SolutionWhich of the following equations represent a transverse wave travelling along- y axis ?
View SolutionWhich of the following hormones is responsible for reguiating the blood sugar level in the human body ?
View Solution

