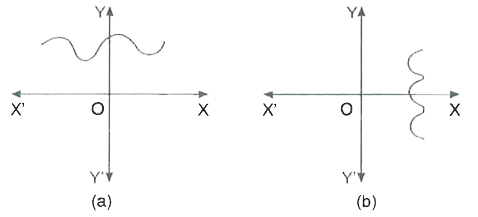
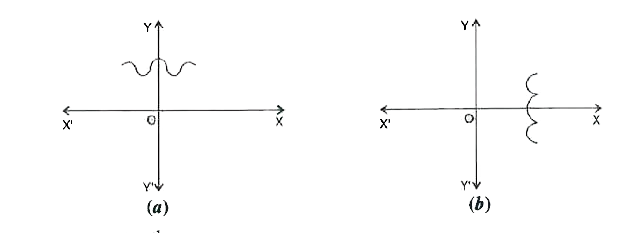
Which of the following graphs represent the function of x ? Why
Video Solution
|
Answer
Step by step video & image solution for Which of the following graphs represent the function of x ? Why by Maths experts to help you in doubts & scoring excellent marks in Class 11 exams.
Updated on:21/07/2023Topper's Solved these Questions
- RELATIONS AND FUNCTIONSBOOK - MODERN PUBLICATIONCHAPTER - RELATIONS AND FUNCTIONSEXERCISE - Exercise-2(a)
25 Videos
- RELATIONS AND FUNCTIONSBOOK - MODERN PUBLICATIONCHAPTER - RELATIONS AND FUNCTIONSEXERCISE - Exercise 2(b)
14 Videos
- RELATIONS AND FUNCTIONSBOOK - MODERN PUBLICATIONCHAPTER - RELATIONS AND FUNCTIONSEXERCISE - Frequently Asked Questions
17 Videos
- PROBABILITYBOOK - MODERN PUBLICATIONCHAPTER - PROBABILITYEXERCISE - CHAPTER TEST
12 Videos
- SEQUENCES AND SERIESBOOK - MODERN PUBLICATIONCHAPTER - SEQUENCES AND SERIESEXERCISE - CHAPTER TEST
12 Videos
Similar Questions
Knowledge Check
Which of the following graph represents e−x?
A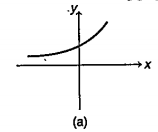 B
B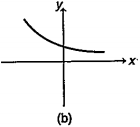 C
C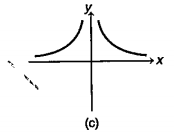 D
D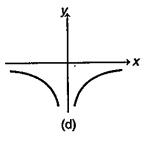
Which of the following graph represent the function f(x)=∫√x0eu2x du, for x>0andf(0)=o
A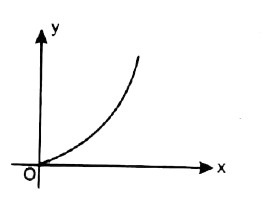 B
B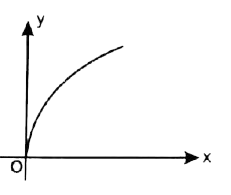 C
C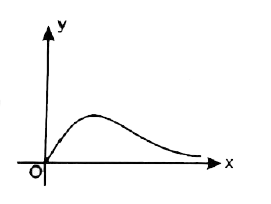 D
D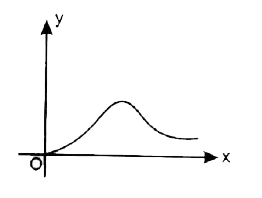
What is the range of the function f(x)=|x|x,x≠0?
A B
B C
C Dnone of above
Which one of the following graphs represents motion?
View SolutionWhich of the following graph represents uniform motion
View SolutionWhich one the following graph represents the function
f(x)=xx,x≠0?
View SolutionWhich of the following graph represents exothermic reaction ?
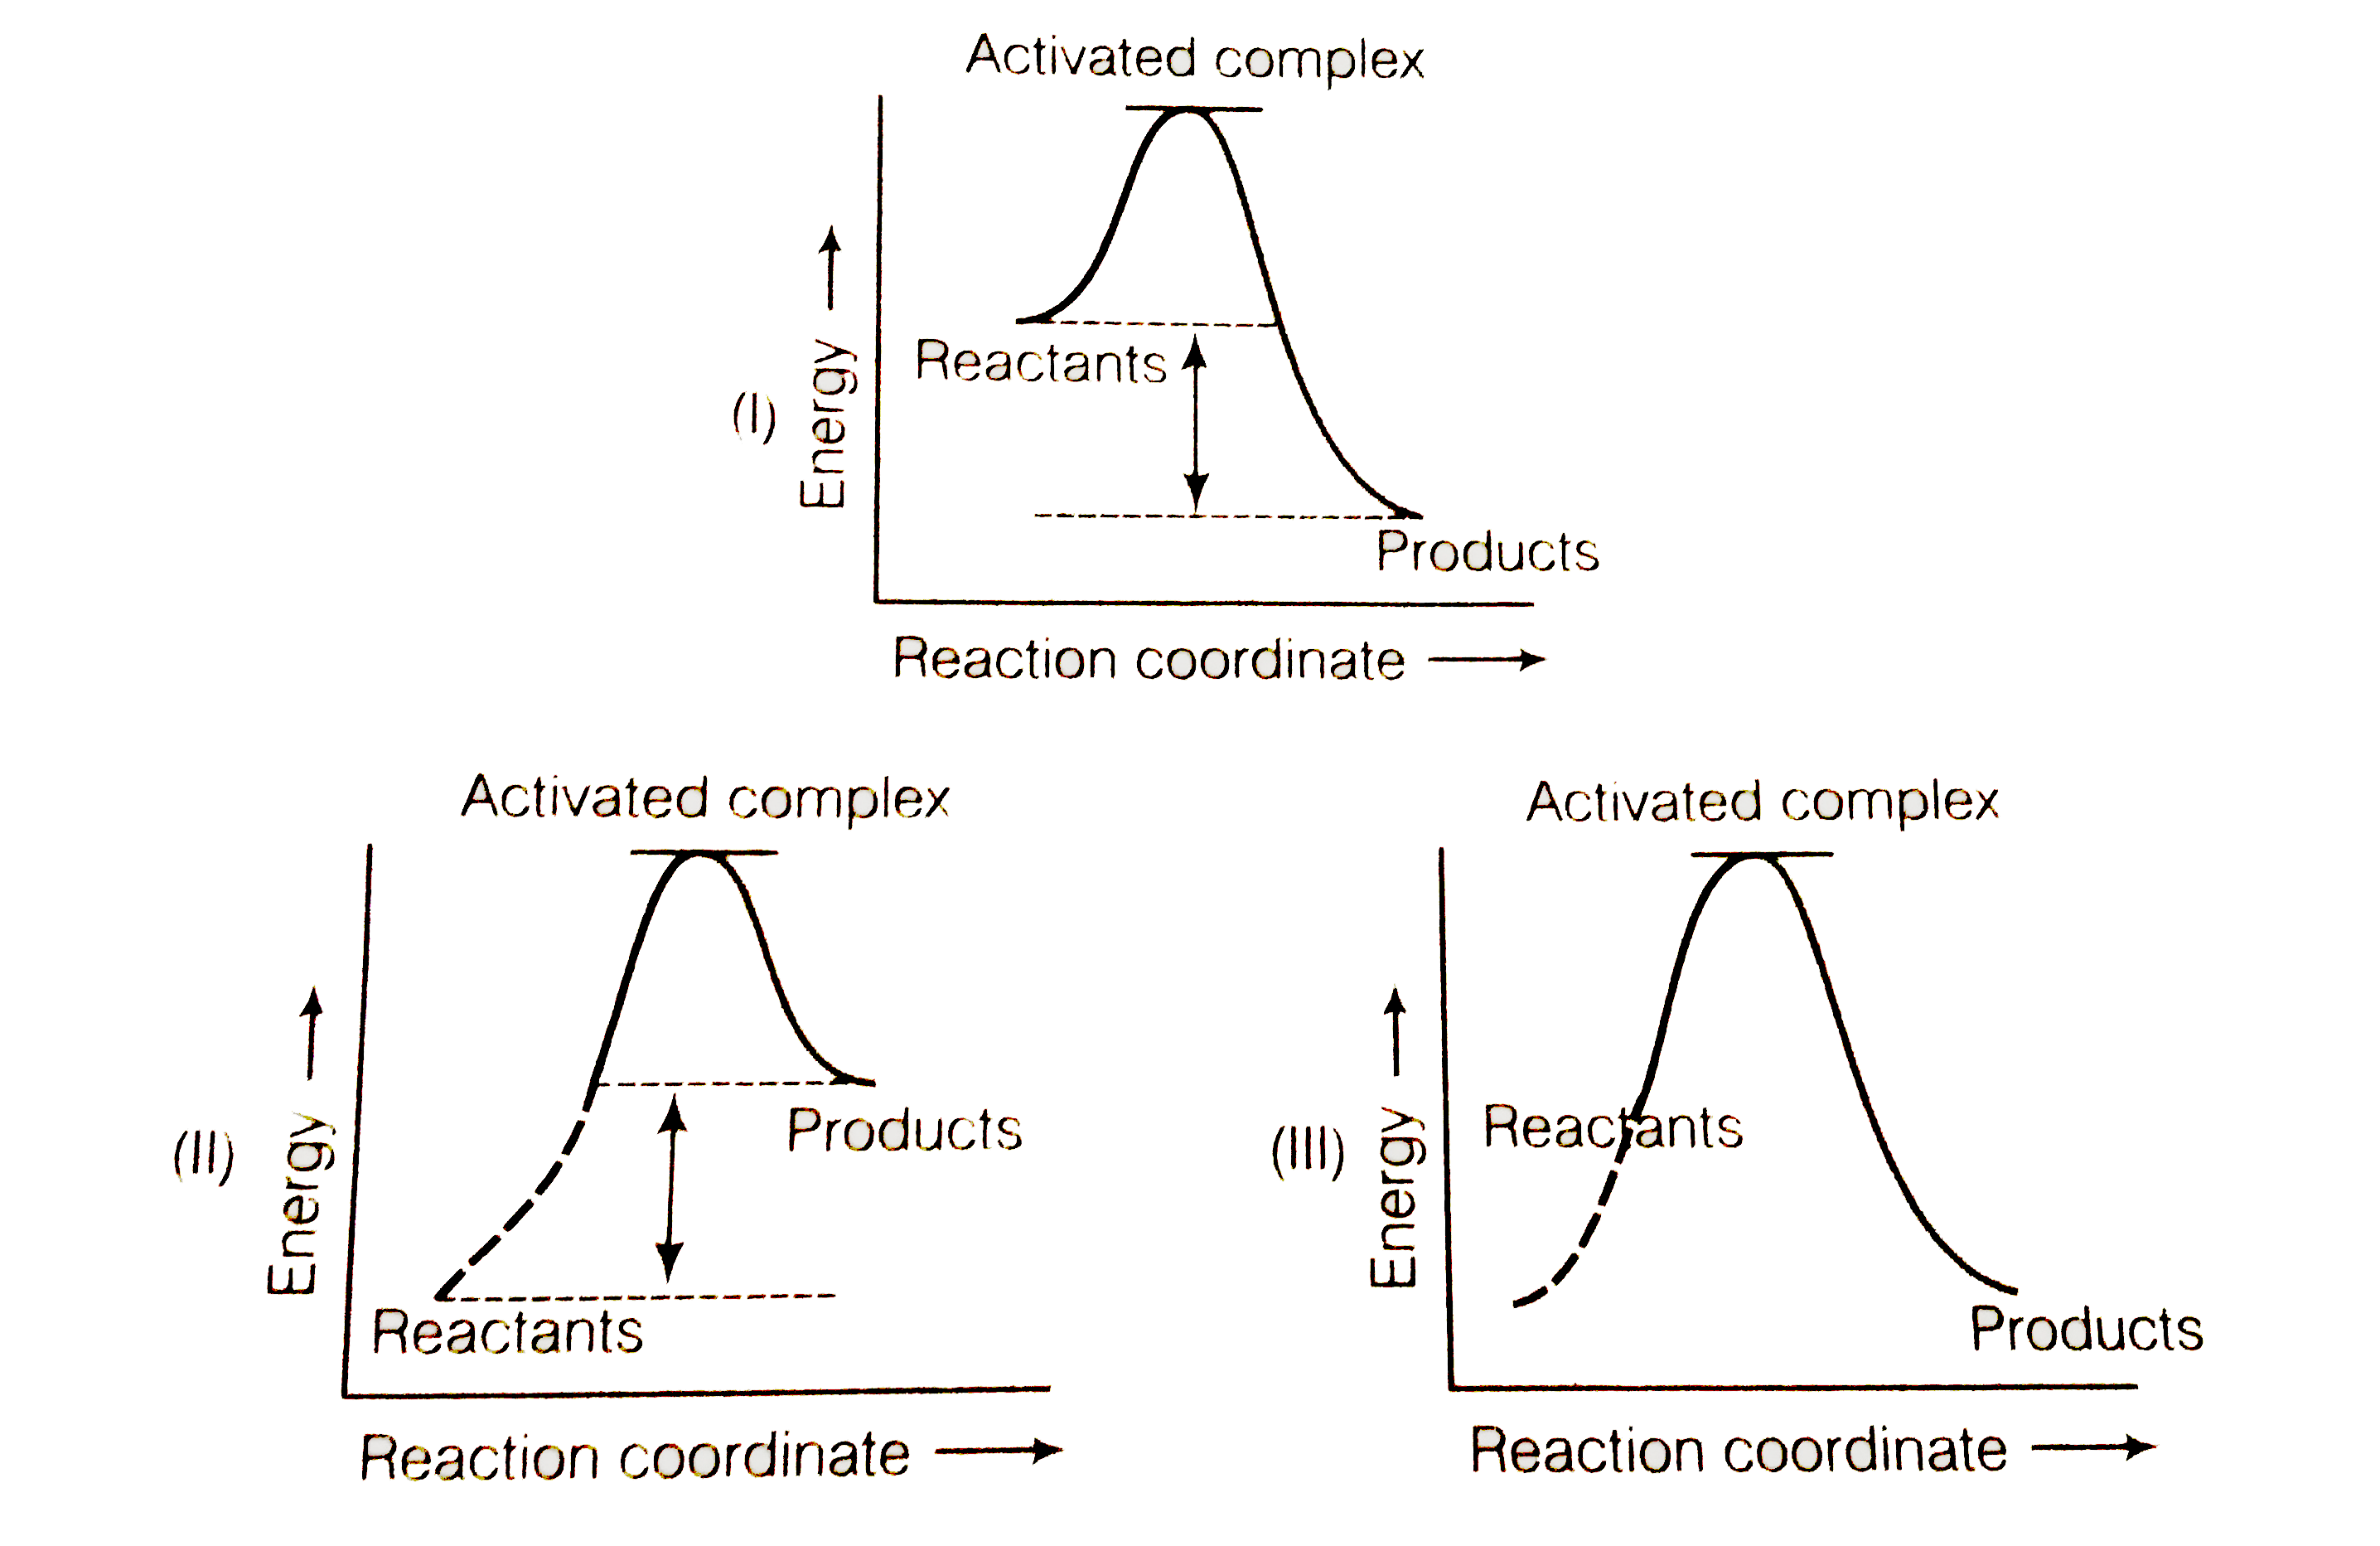
View SolutionWhich of the following graphs represents exothermic reaction?

View Solution

