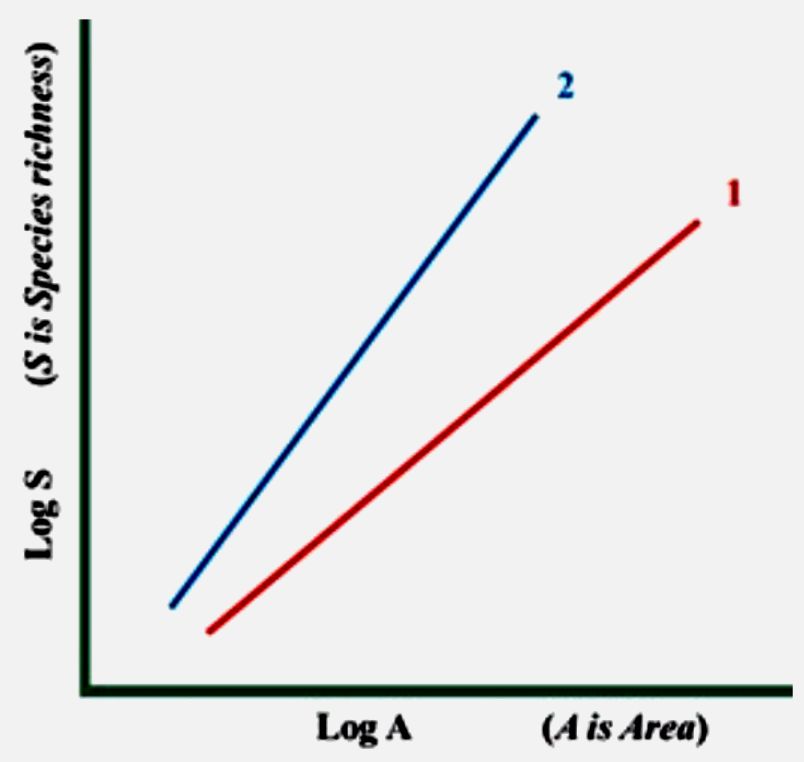
A graph of species richness vs area on log-log axes is
linear
sigmoidal
oscillatory
parabolic
The correct Answer is:A
log S= log c +z log A
Topper's Solved these Questions
- KVPYBOOK - KVPY PREVIOUS YEARCHAPTER - KVPYEXERCISE - Part B- Biology
10 Videos
- KVPYBOOK - KVPY PREVIOUS YEARCHAPTER - KVPYEXERCISE - Part 1 Biology
46 Videos
- KVPYBOOK - KVPY PREVIOUS YEARCHAPTER - KVPYEXERCISE - PART II BIOLOGY
10 Videos
- KVPY 2021BOOK - KVPY PREVIOUS YEARCHAPTER - KVPY 2021EXERCISE - PART I BIOLOGY
19 Videos
Similar Questions
Observe the graph of area versus species richness and select the options that explain lines 1 and 2.

View Solution
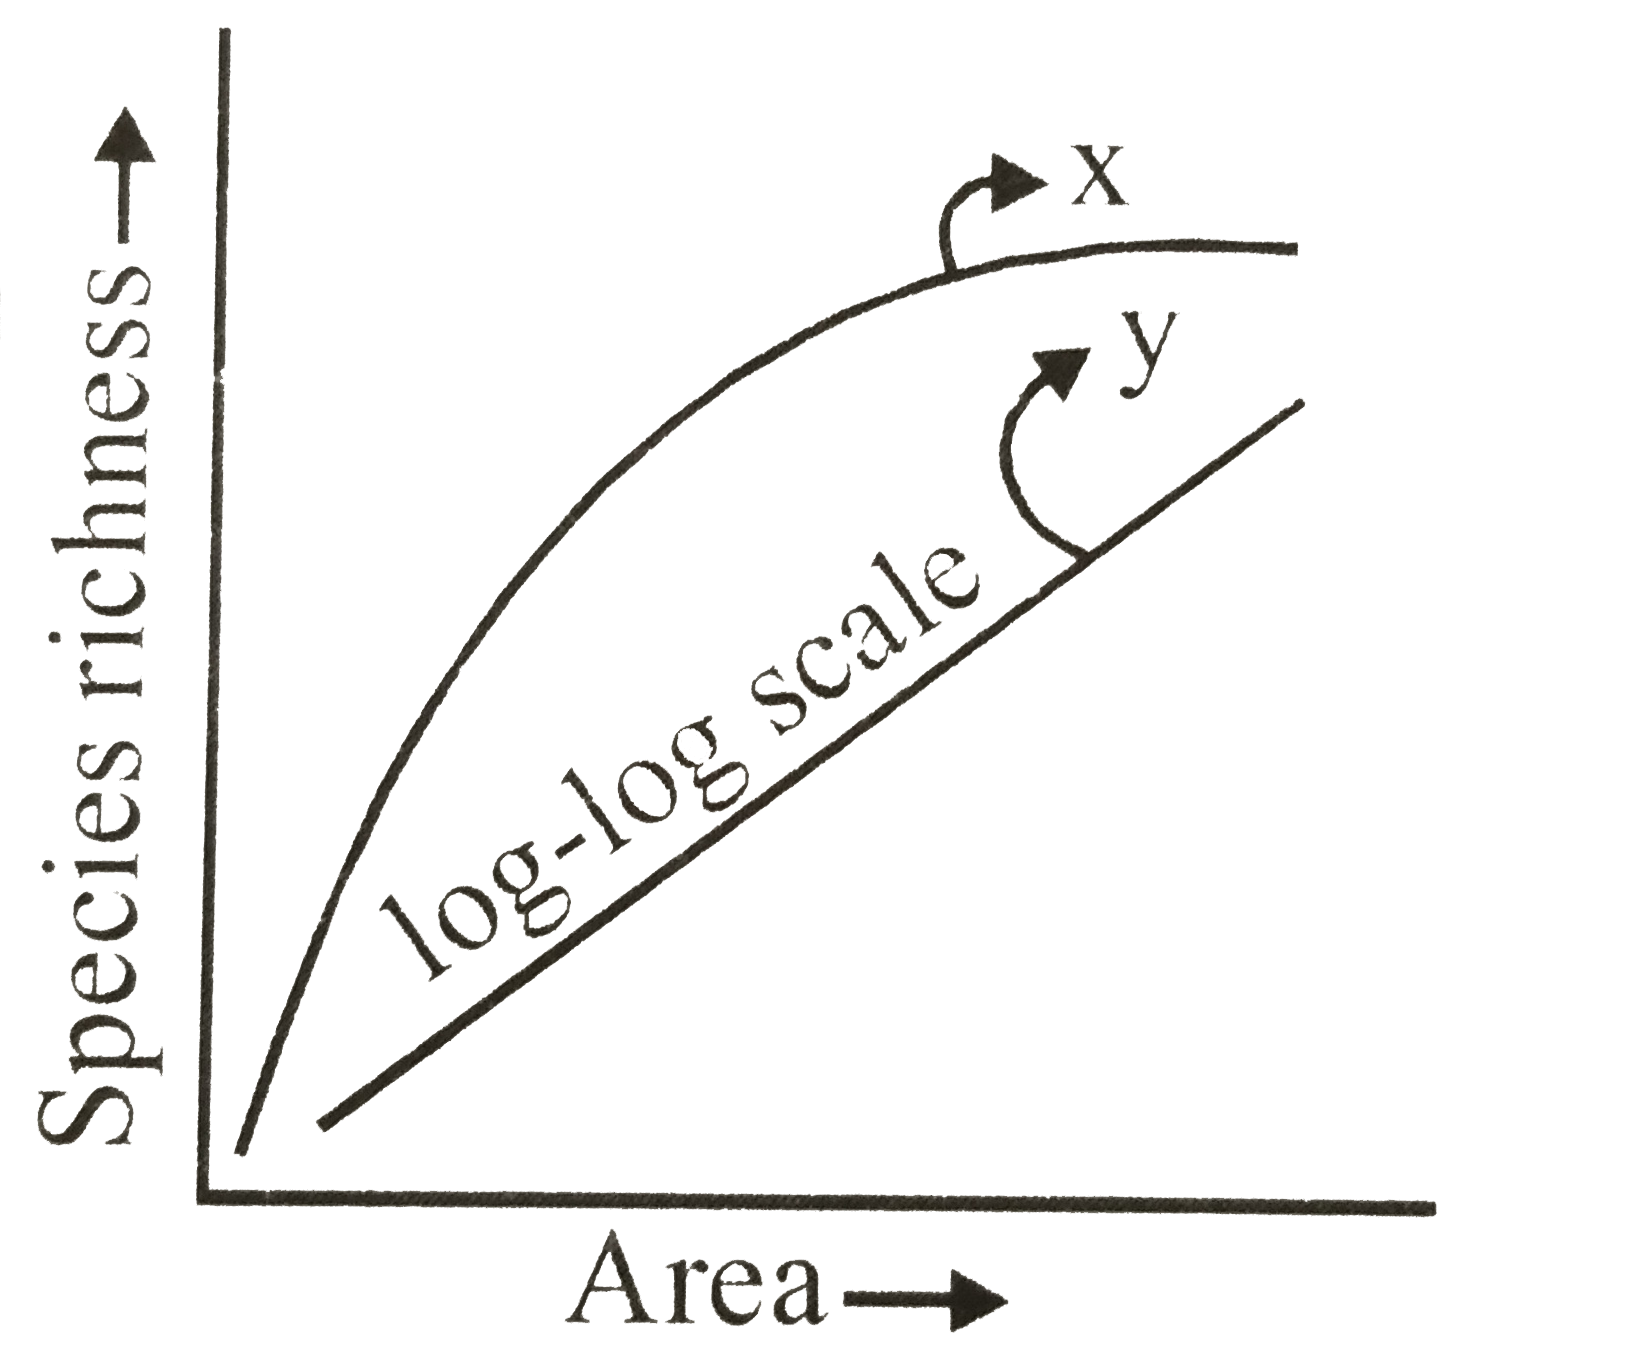
Study the above graph and answer the following questions -
(i) Identify x and y
(ii) The relation between species richness and area can be denoted as generally
(iii) The value of z lies in range of
(iv) On a log scale the relation between species richness and area is
View Solution
Knowledge Check
Which of these examples will have the steepest curve when log of species richness and log of area are plotted on a graph?
Aplants in BritainBbirds in CaliforniaCmolluscs in New York StateDmammals in the tropical forests of different continentsIn mollusks of New York state, which of these experiences gives you a value between 0.1 to 0.2?
( S = log of species richness, A = log of Area, C = log of Y- intercept in the species richness area curve)AS−CABS−ACCC−ASDA−SCAlexander von Humboldt is associated with
(a.) species - area relationship
(b.) log S = log C + z logA
(C.) Within a region , species richness increases with the increasing limited explored area.
(d.) Increased diversity contributes to higher productivity.
(e.) Species diversity increases with the loss of keystone species.Aa and eBa , b and dCa,b,cDb,c and d
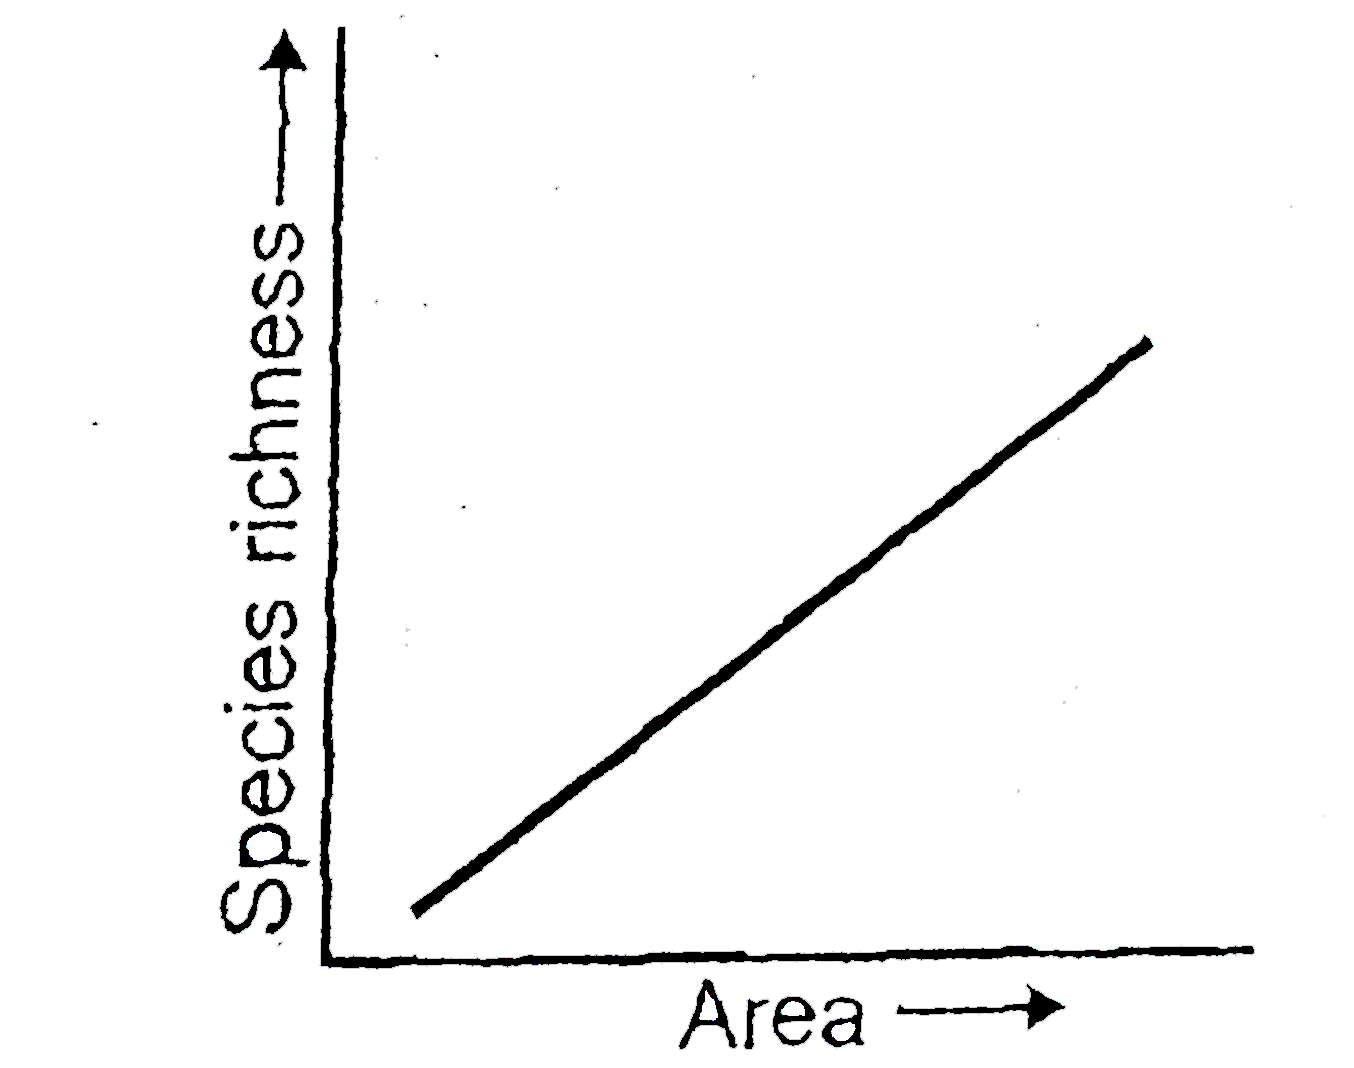
Relationship between species richness (S) and area (A) represent in the following graph is described by the equation

View SolutionDraw the graph of y=log|x| when the graph of y=log(x) is known.
View SolutionDraw graph of y=log(−x), when the graph of y=log(x) is given.
View SolutionDraw the graph of y=|logx| when the graph of y=log(x) is known.
View SolutionIn the given equation relating to species Area relationship , what does 'Z' stand for ?
logS=logc+zlogA
View Solution