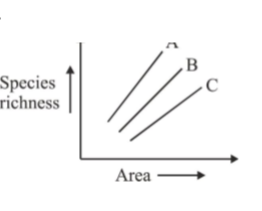
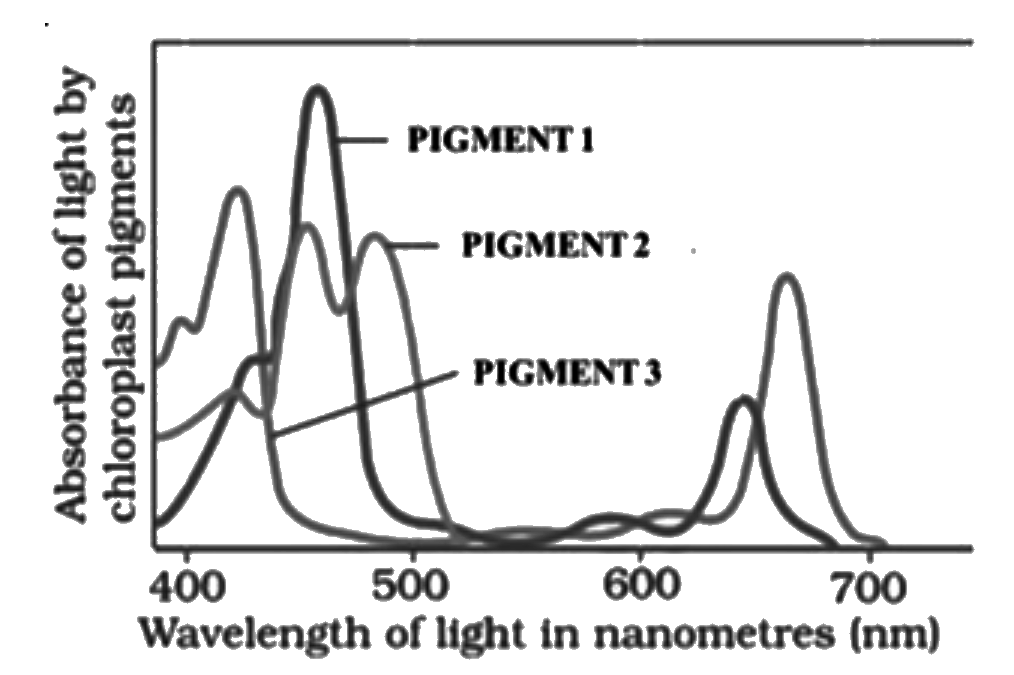
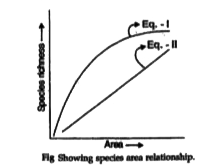
Observe the graph of area versus species richness and select the options that explain lines 1 and 2.
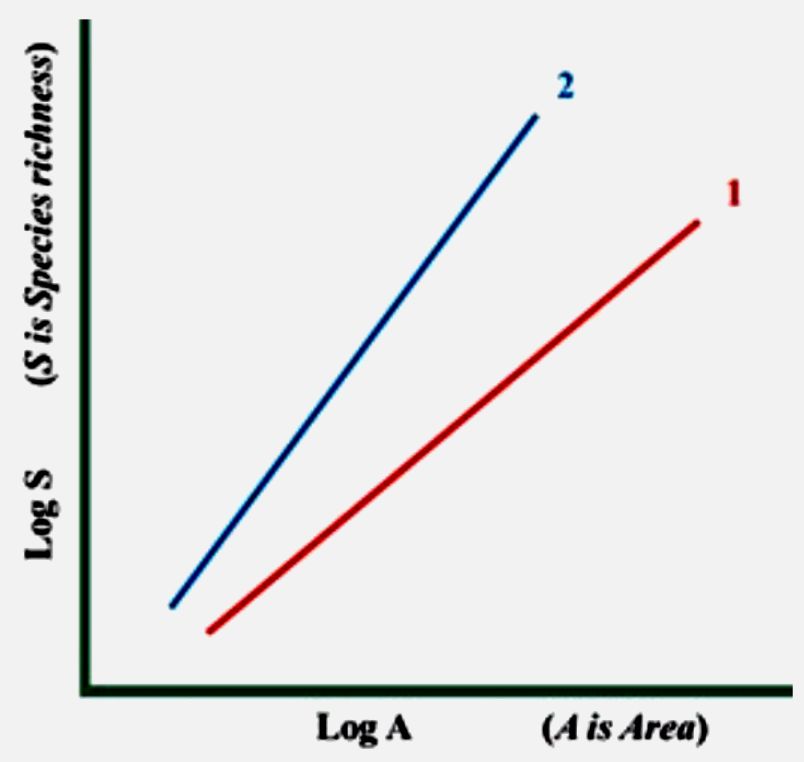
1 - Molluscs in New York State and 2 - plants in Britain
1 - plants in Britain and 2 - birds in California
1 - frugivorous birds and mammals in the tropical forests of different continents and 2 - plants in Britain
1 Molluscs in New York state and 2 frugivorous birds and mammals in the tropical forests of different continents
The correct Answer is:D
Step by step video & image solution for Observe the graph of area versus species richness and select the options that explain lines 1 and 2. by Biology experts to help you in doubts & scoring excellent marks in Class 12 exams.
Updated on:21/07/2023Topper's Solved these Questions
Similar Questions
Knowledge Check
A graph of species richness vs area on log-log axes is
AlinearBsigmoidalCoscillatoryDparabolicThe relation between species richness and area is correctly depicted by
ALogS=logC−ZlogABLogS=ZlogACLogS=logC+ZlogADLogS=logCThe graph between the log K versus 1T is a straight line. The slope of the line is
A−2.303REaB−Ea2.303RC2.303REaDEa2.303R
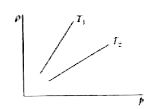
Figure shows graphs of pressure versus density for an ideal gas at two temperatures T1 and T2 Then
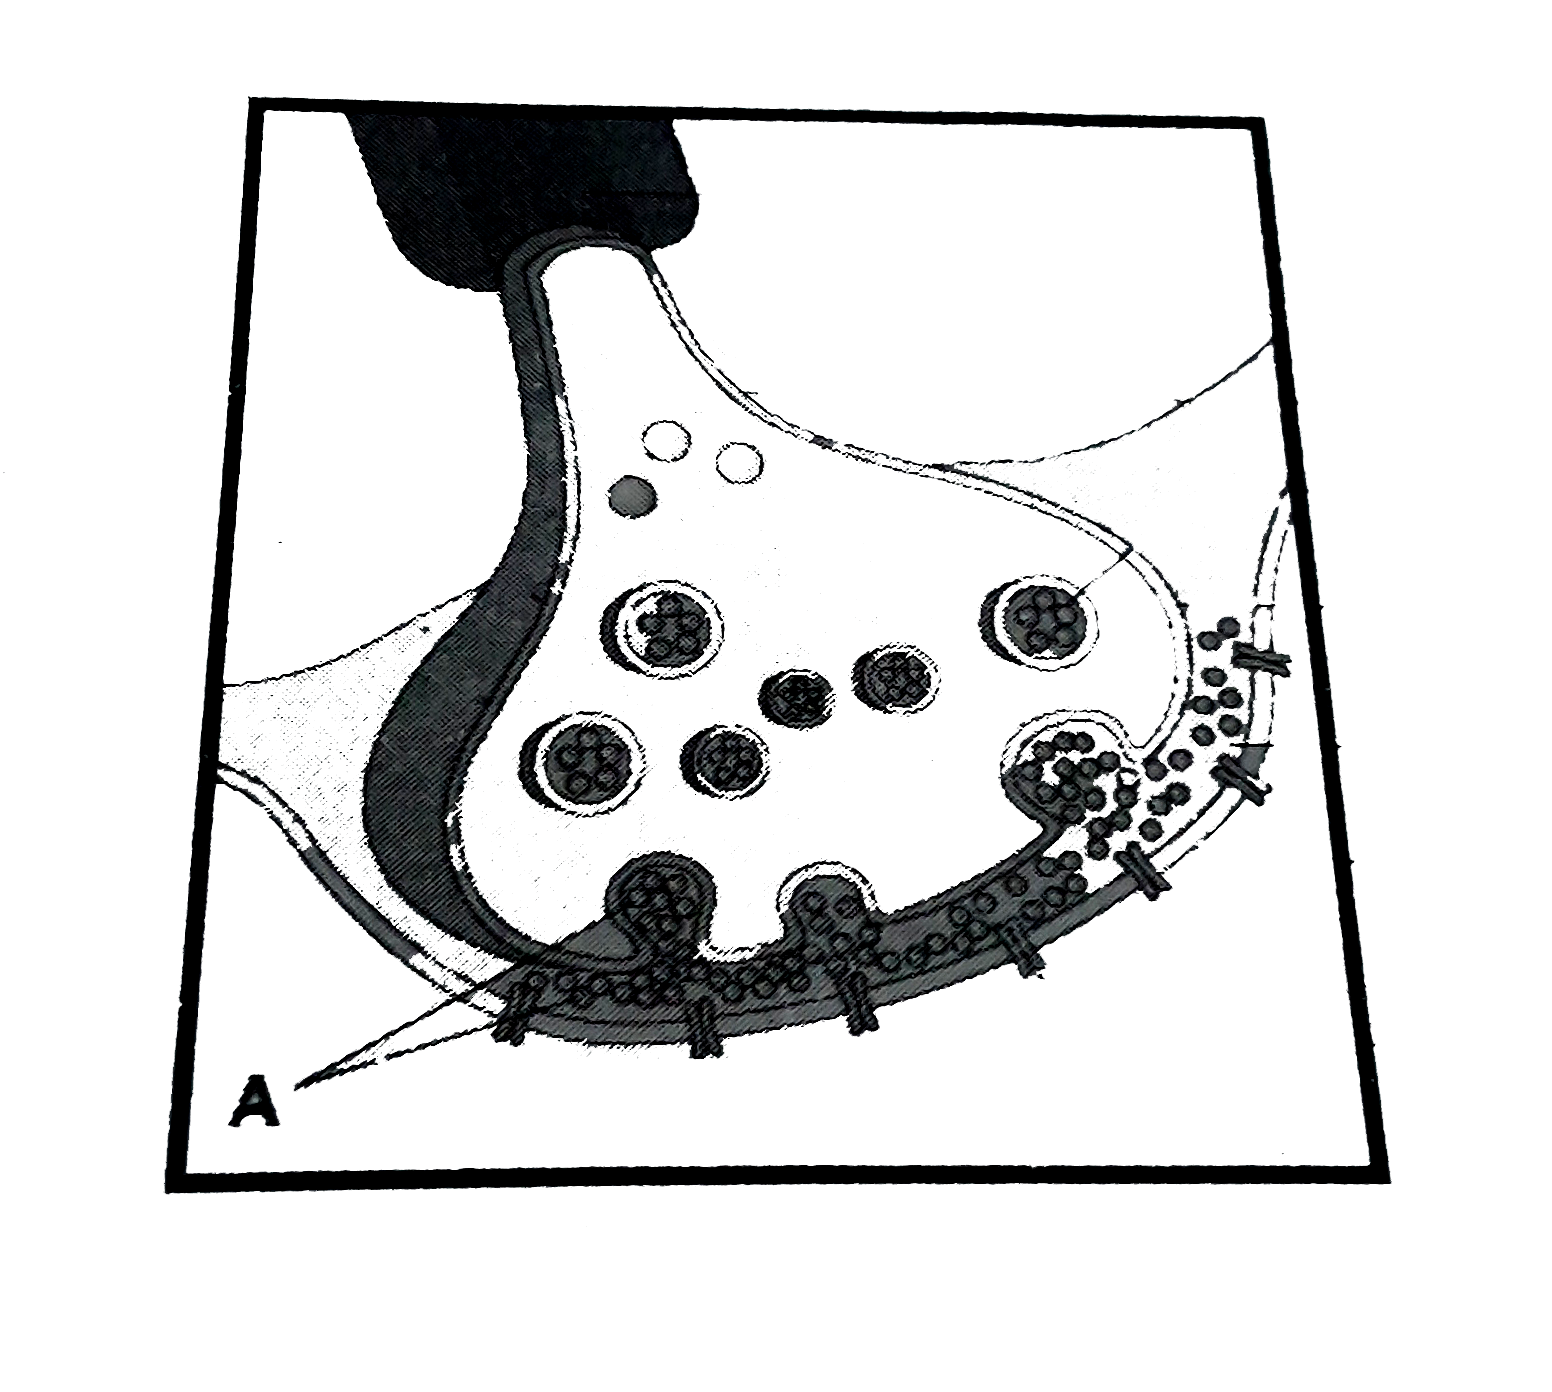
View SolutionObserve the given diagram and select the correct option regarding labeled part A
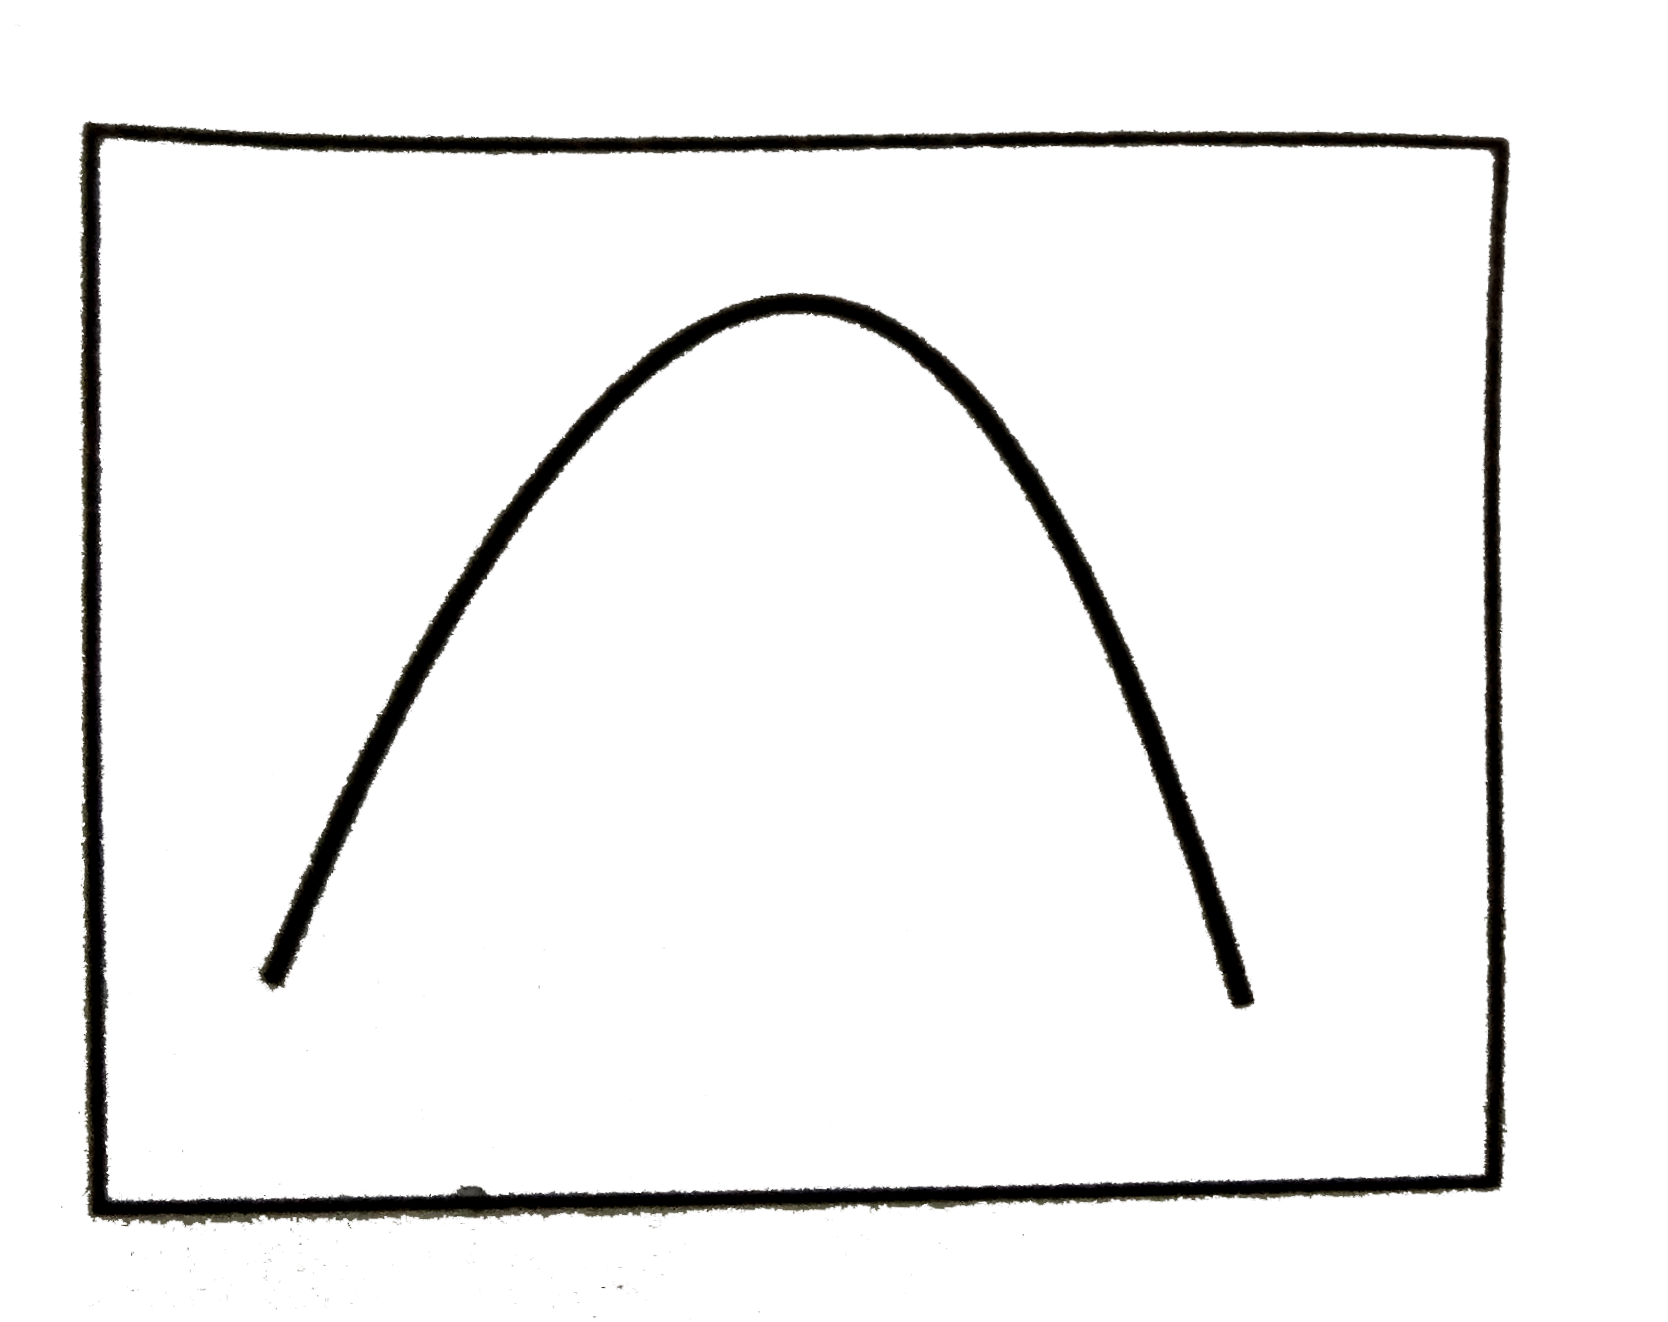
View SolutionSelect the correct option for the given graphs

View SolutionSelect the right option regarding the given graph.
View SolutionThe great German naturalist and geographer Alexander von Humboldt observed that within a region species richness increased with increasing explored area, but only up to a limit. In fact, relation between species richness and area for a wide variety of taxa (angiosperm plants, birds, bats, freshwater fi ishes) turns out to be a rectangular hyperbola. Now find out correct equations shown in the graph.
View Solution

