Position (x) versus time (t) graph of a particle is as shown. The velocity is zero at (second)
Step by step video & image solution for Position (x) versus time (t) graph of a particle is as shown. The velocity is zero at (second) by Physics experts to help you in doubts & scoring excellent marks in Class 12 exams.
Similar Questions
Knowledge Check
- Question 1 - Select One
The velocity − time graph of a particle is as shown in figure
 AIt moves with a constant acceleration throughoutBIt moves with an acceleration of constant magnitude but changing direction at the end of every two secondCThe displacement of the particle is zeroDThe velocity becomes zero at t=4 second
 - Question 2 - Select One
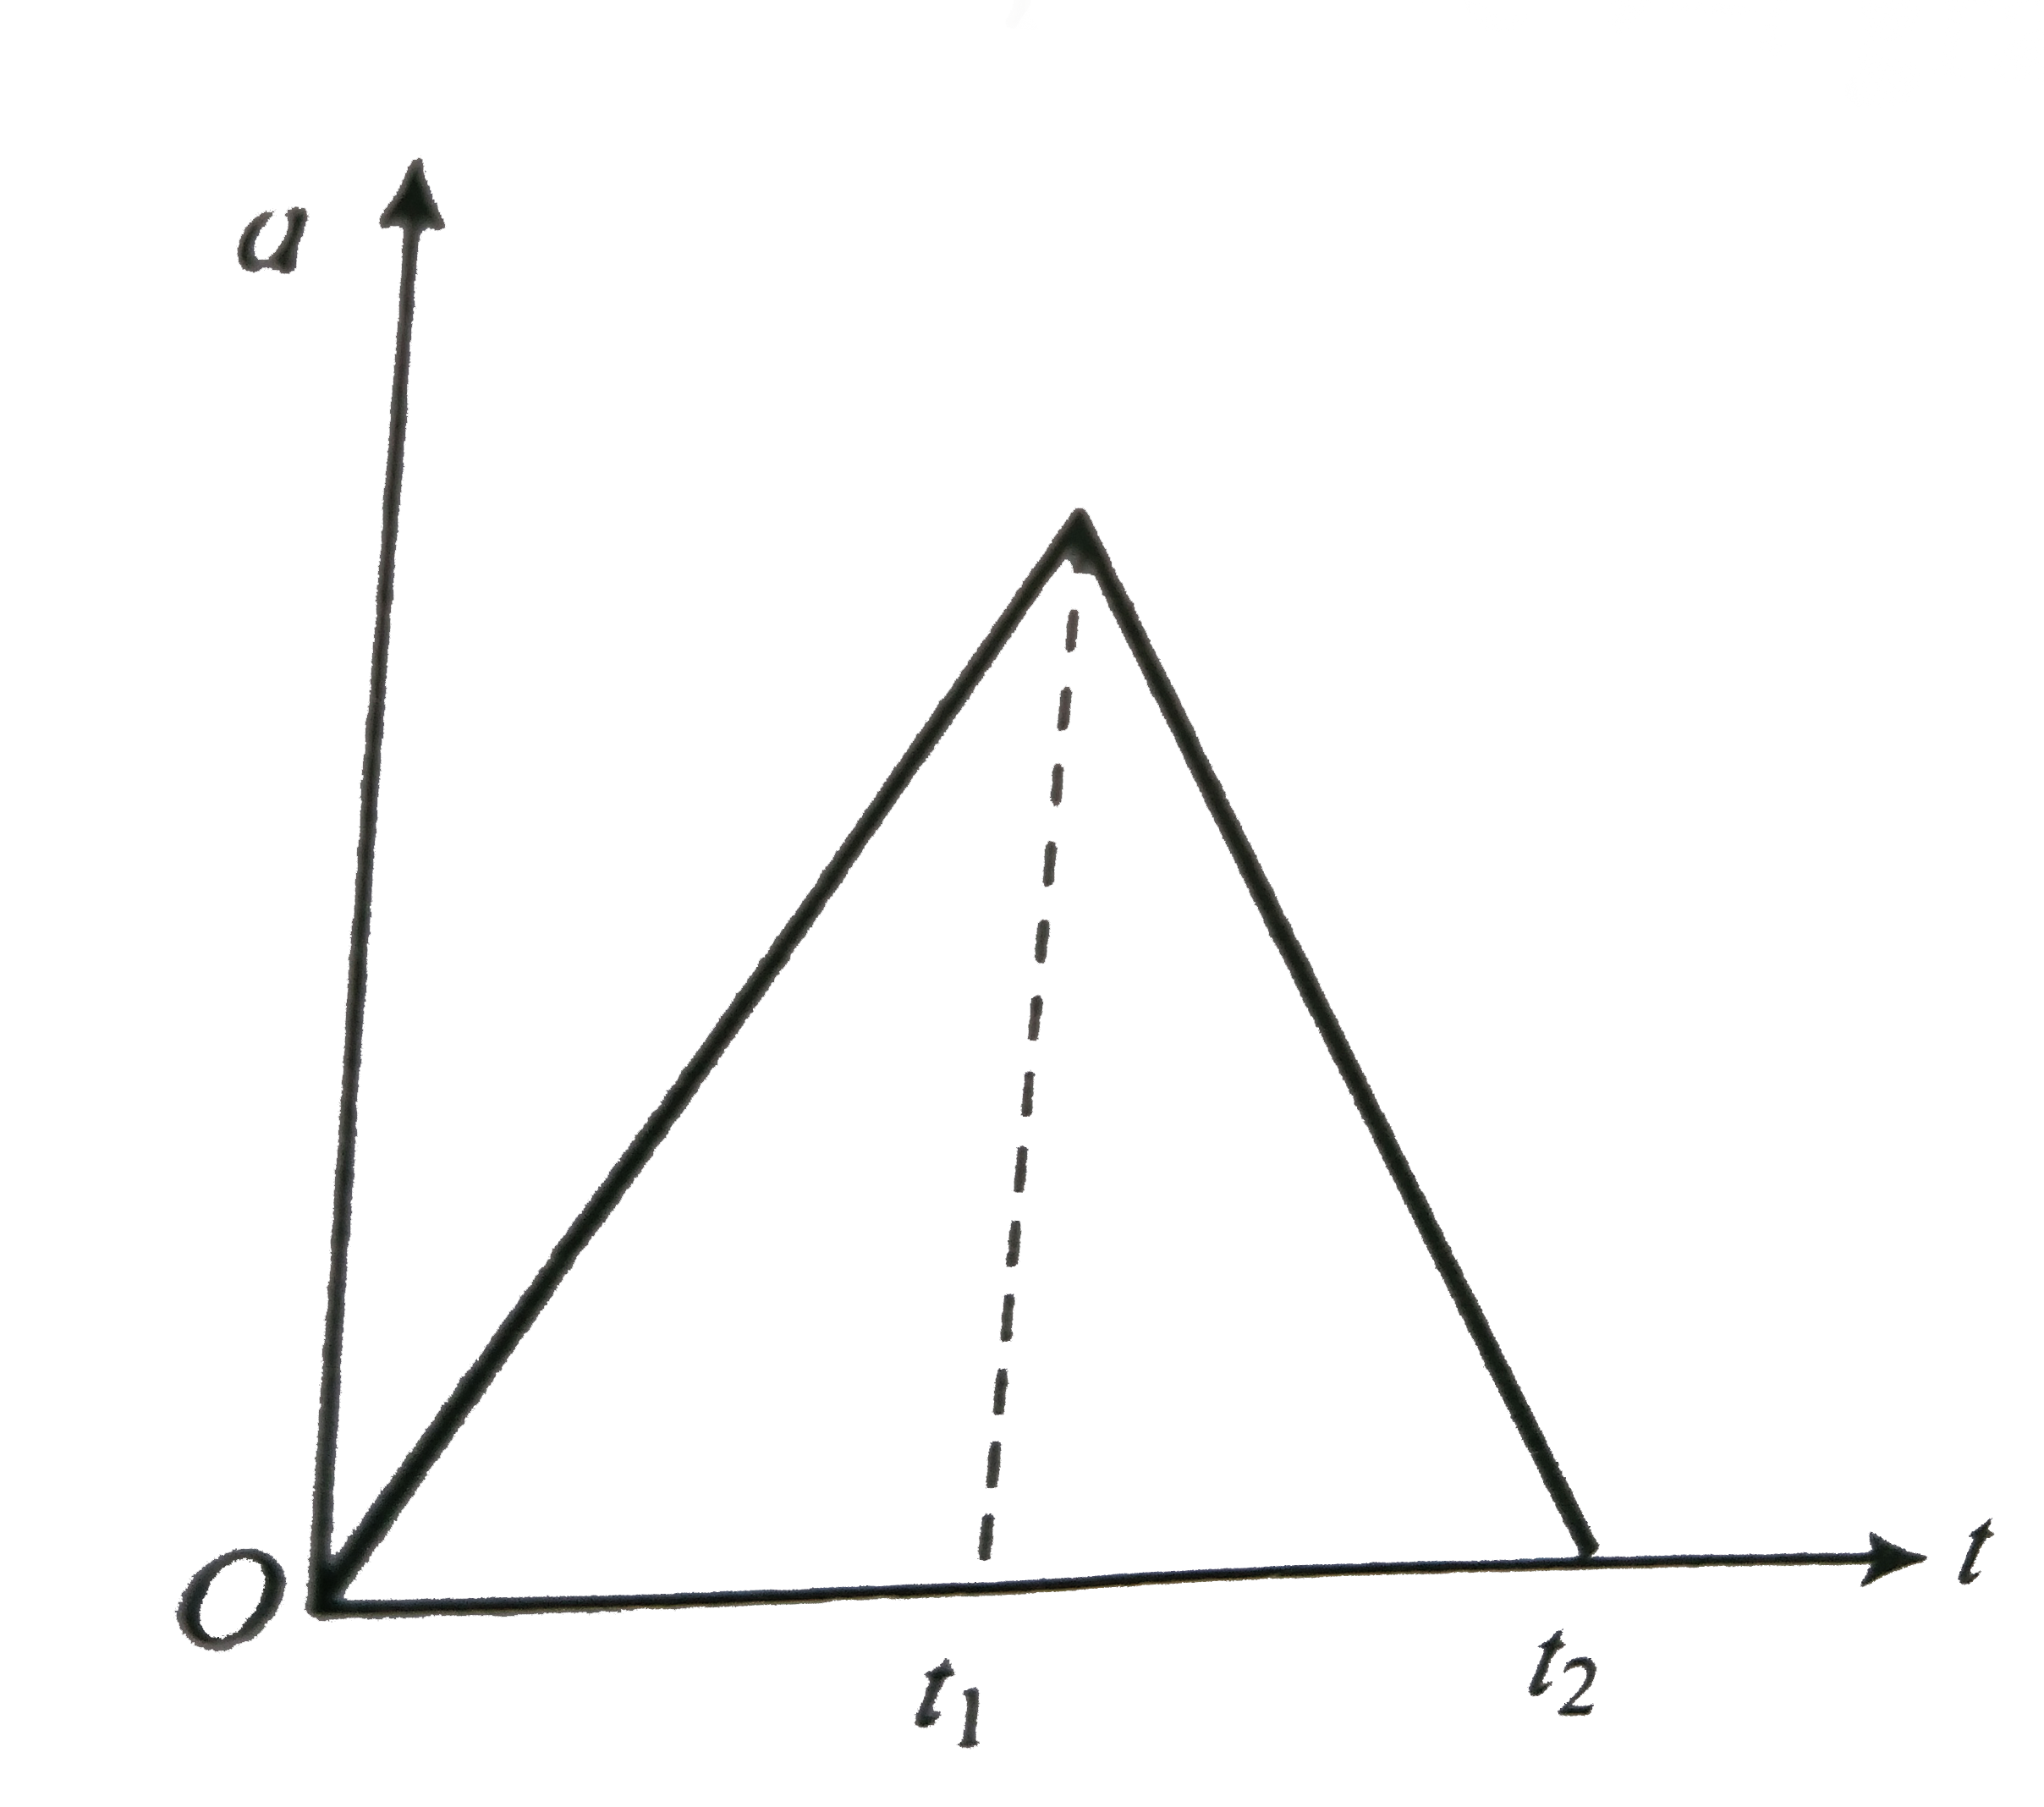
A particle starts to move along a straight line. The acceleration versus time graph of particle is as shown in figure. The correct velocity versus time graph is :
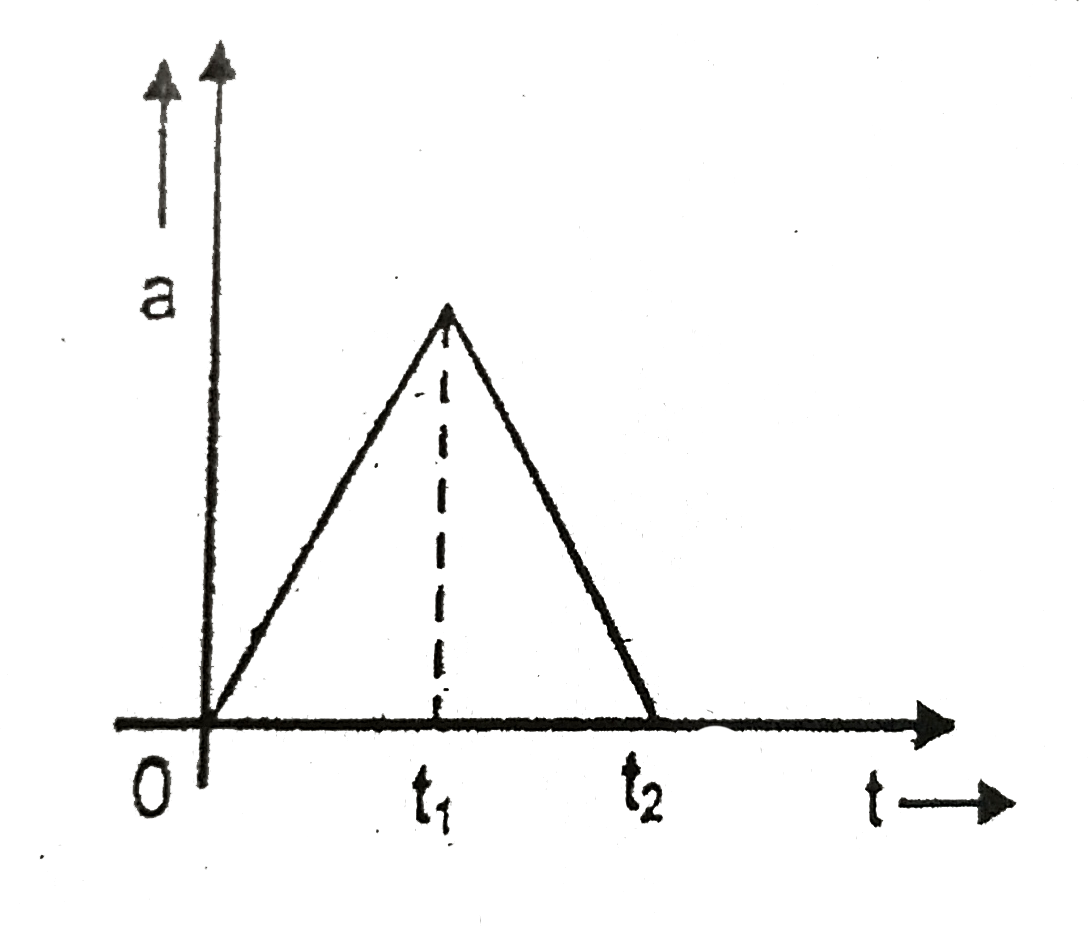 A
A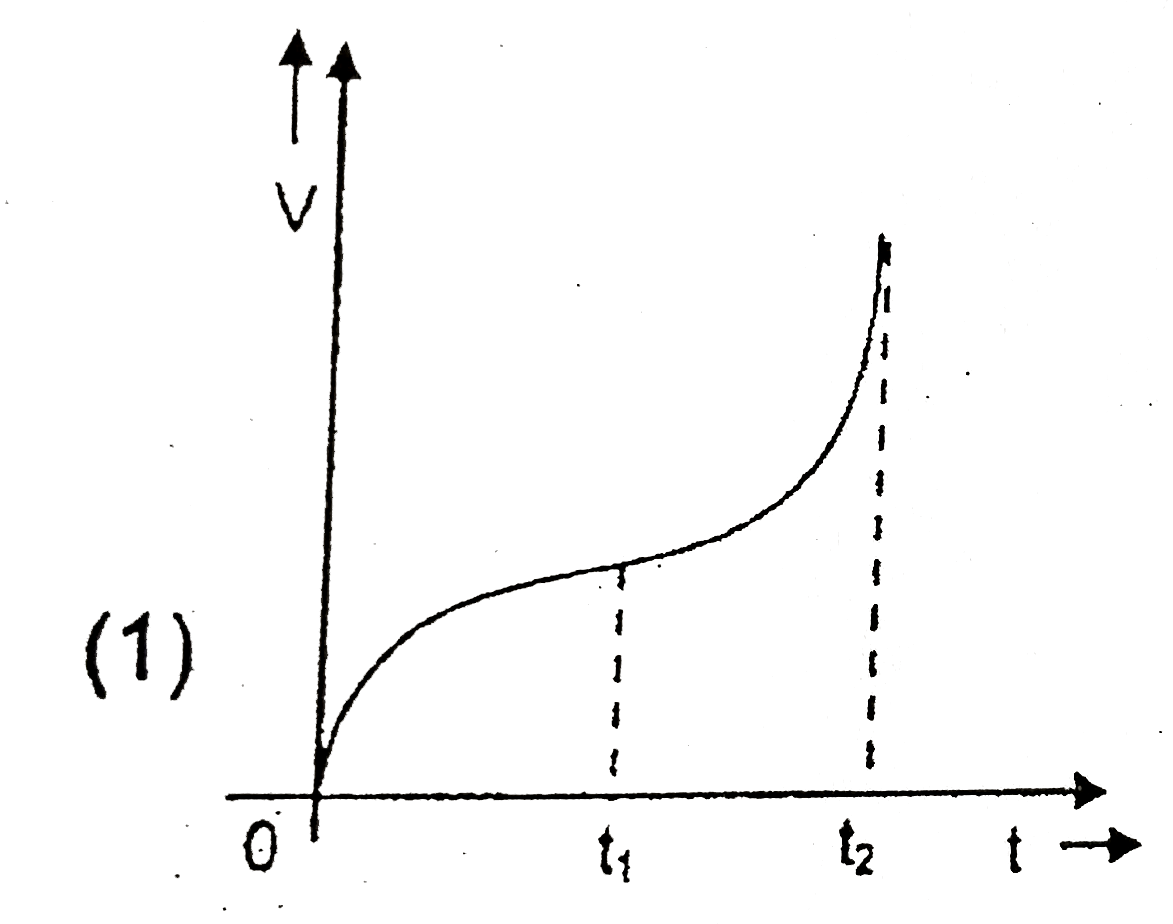 B
B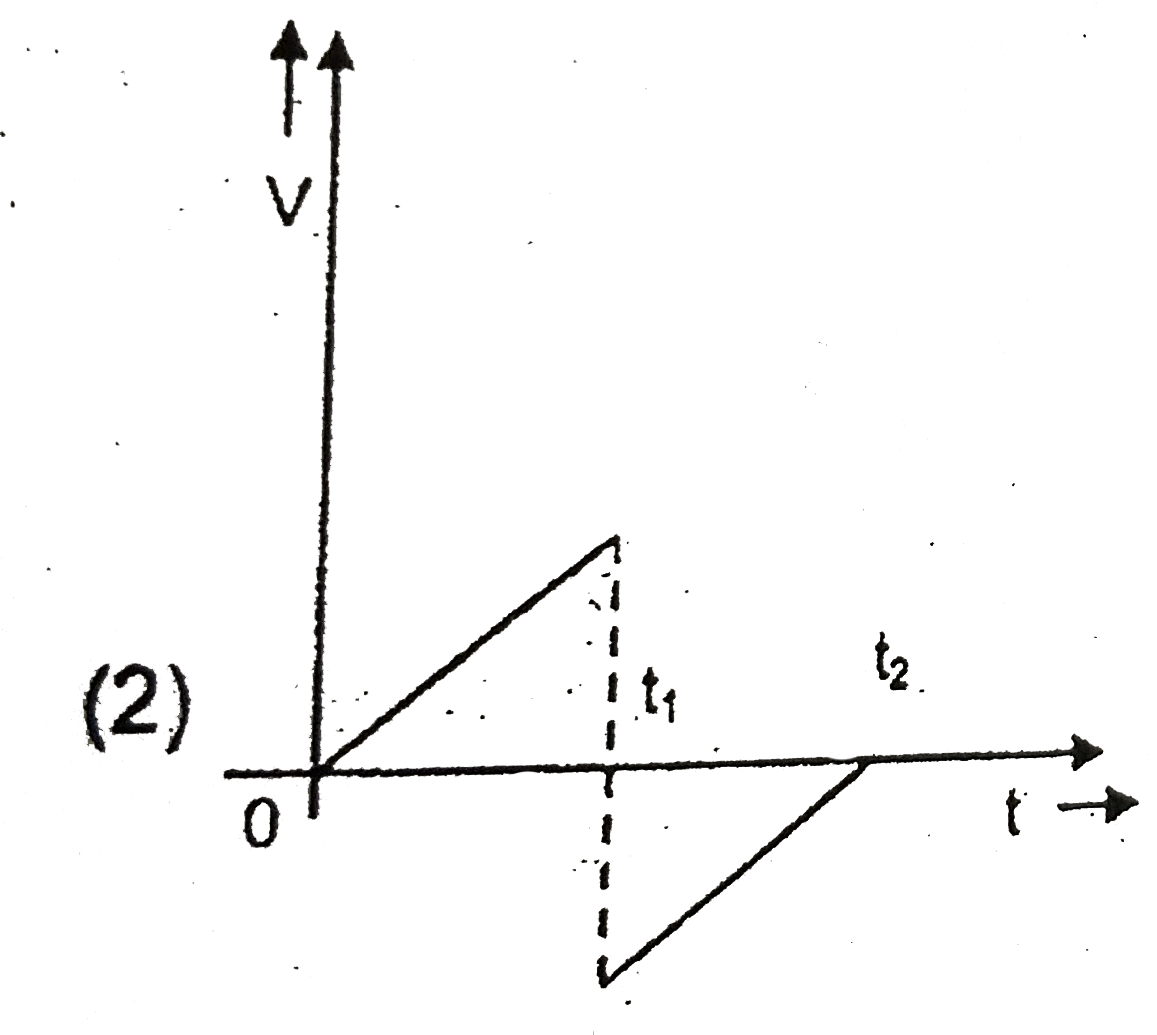 C
C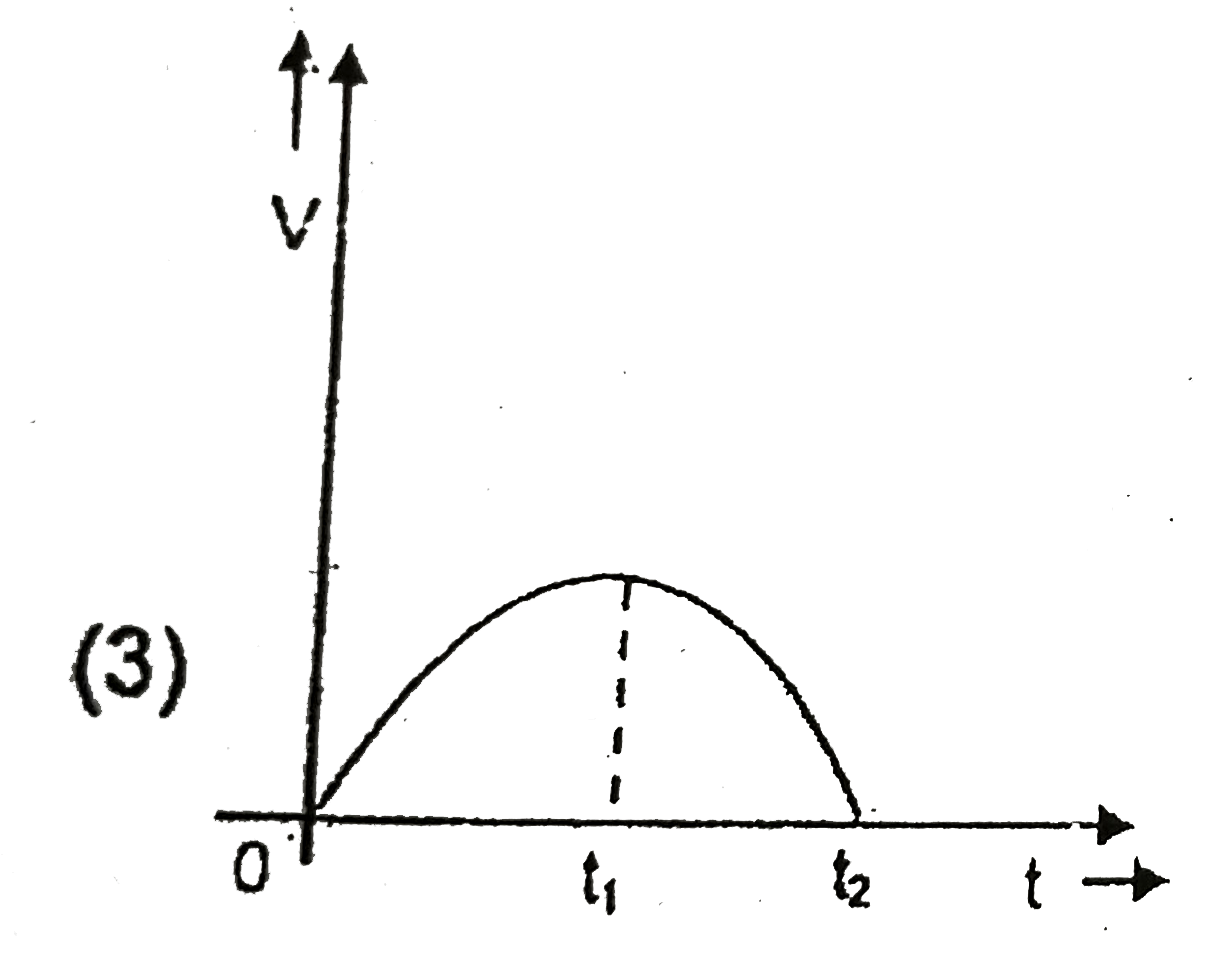 D
D
- Question 3 - Select One
The acceleration versus time graph of a particle moving in a straight line is show in figure. The velocity-time graph of the particle would be
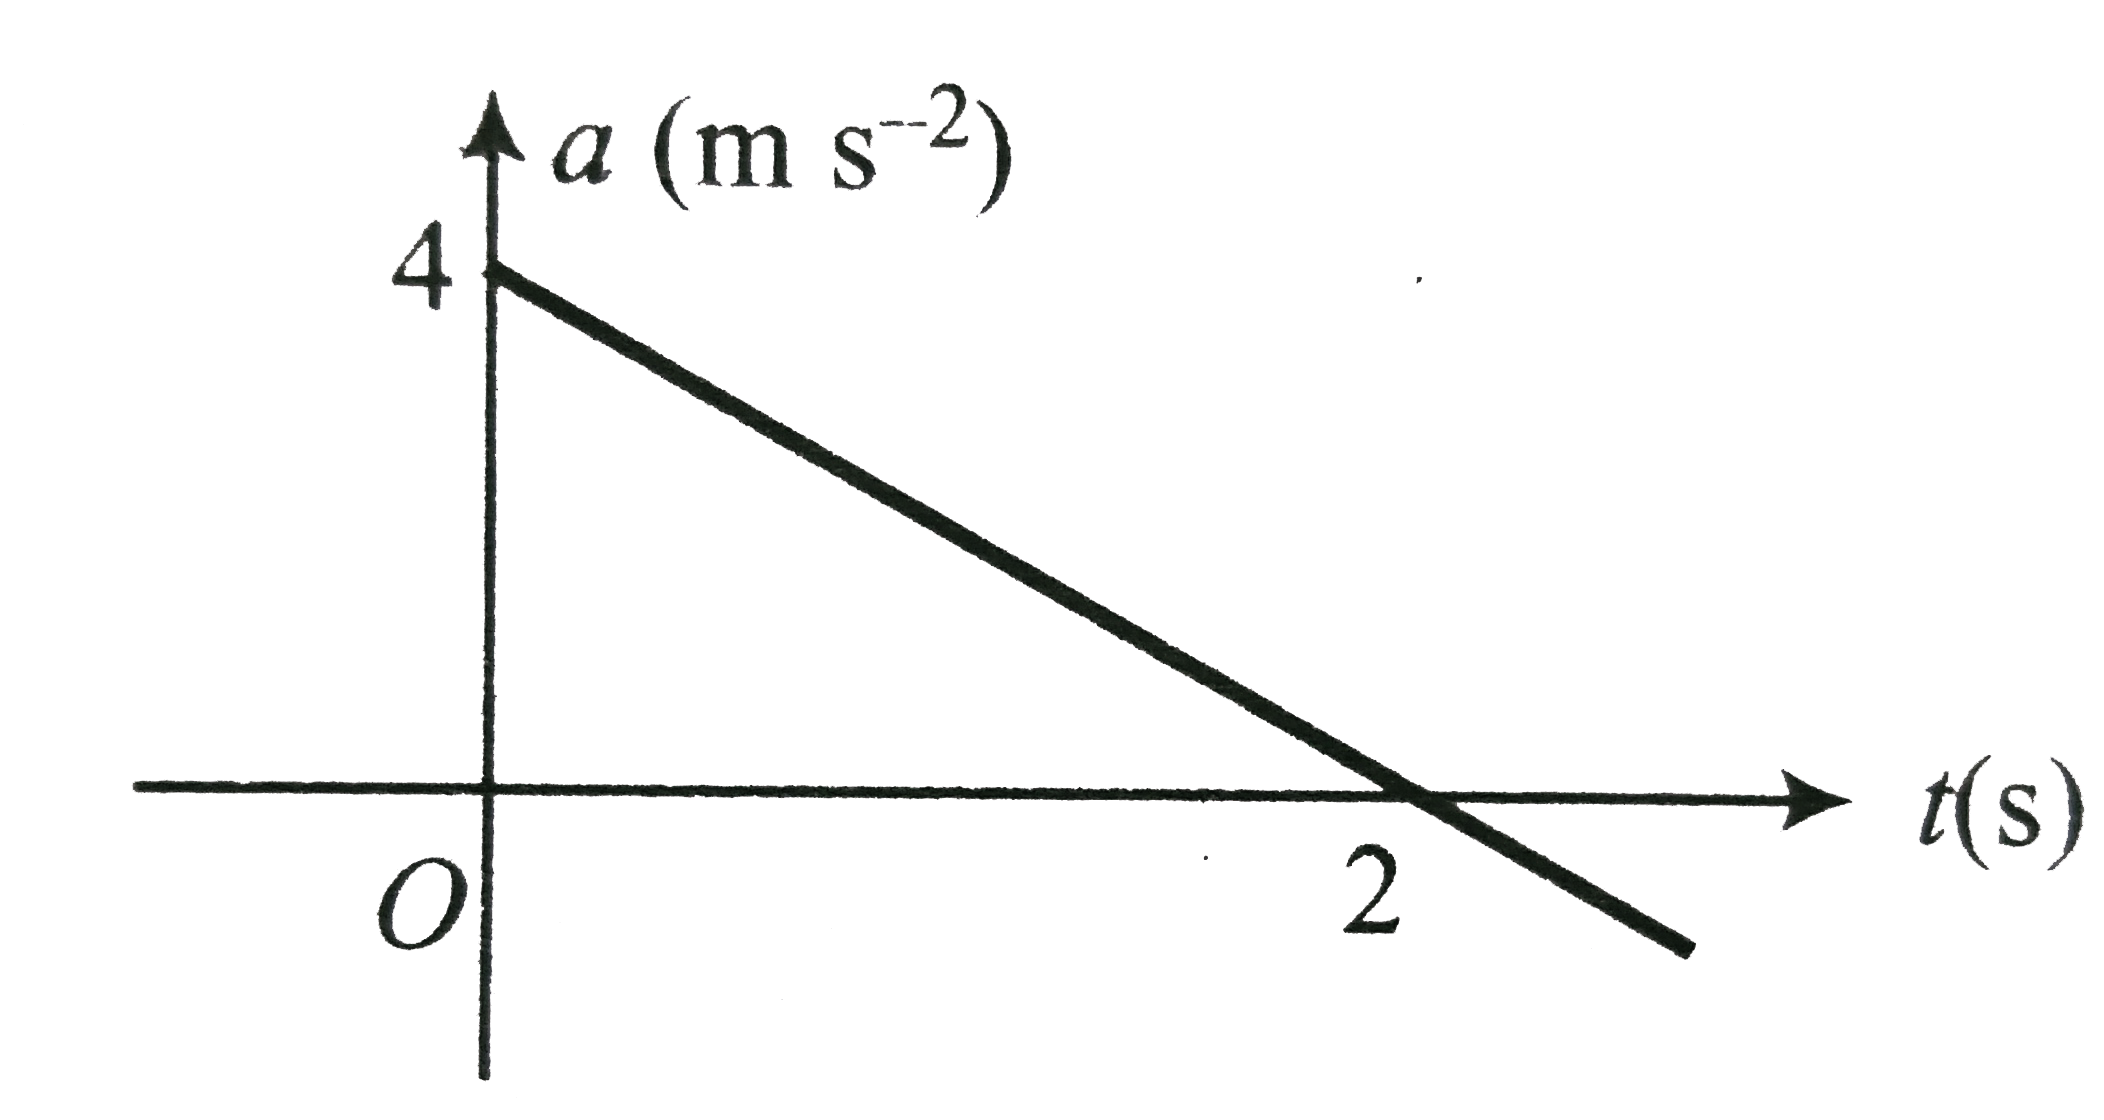 .AA straight lineBA parabolaCA circleDAn ellipse
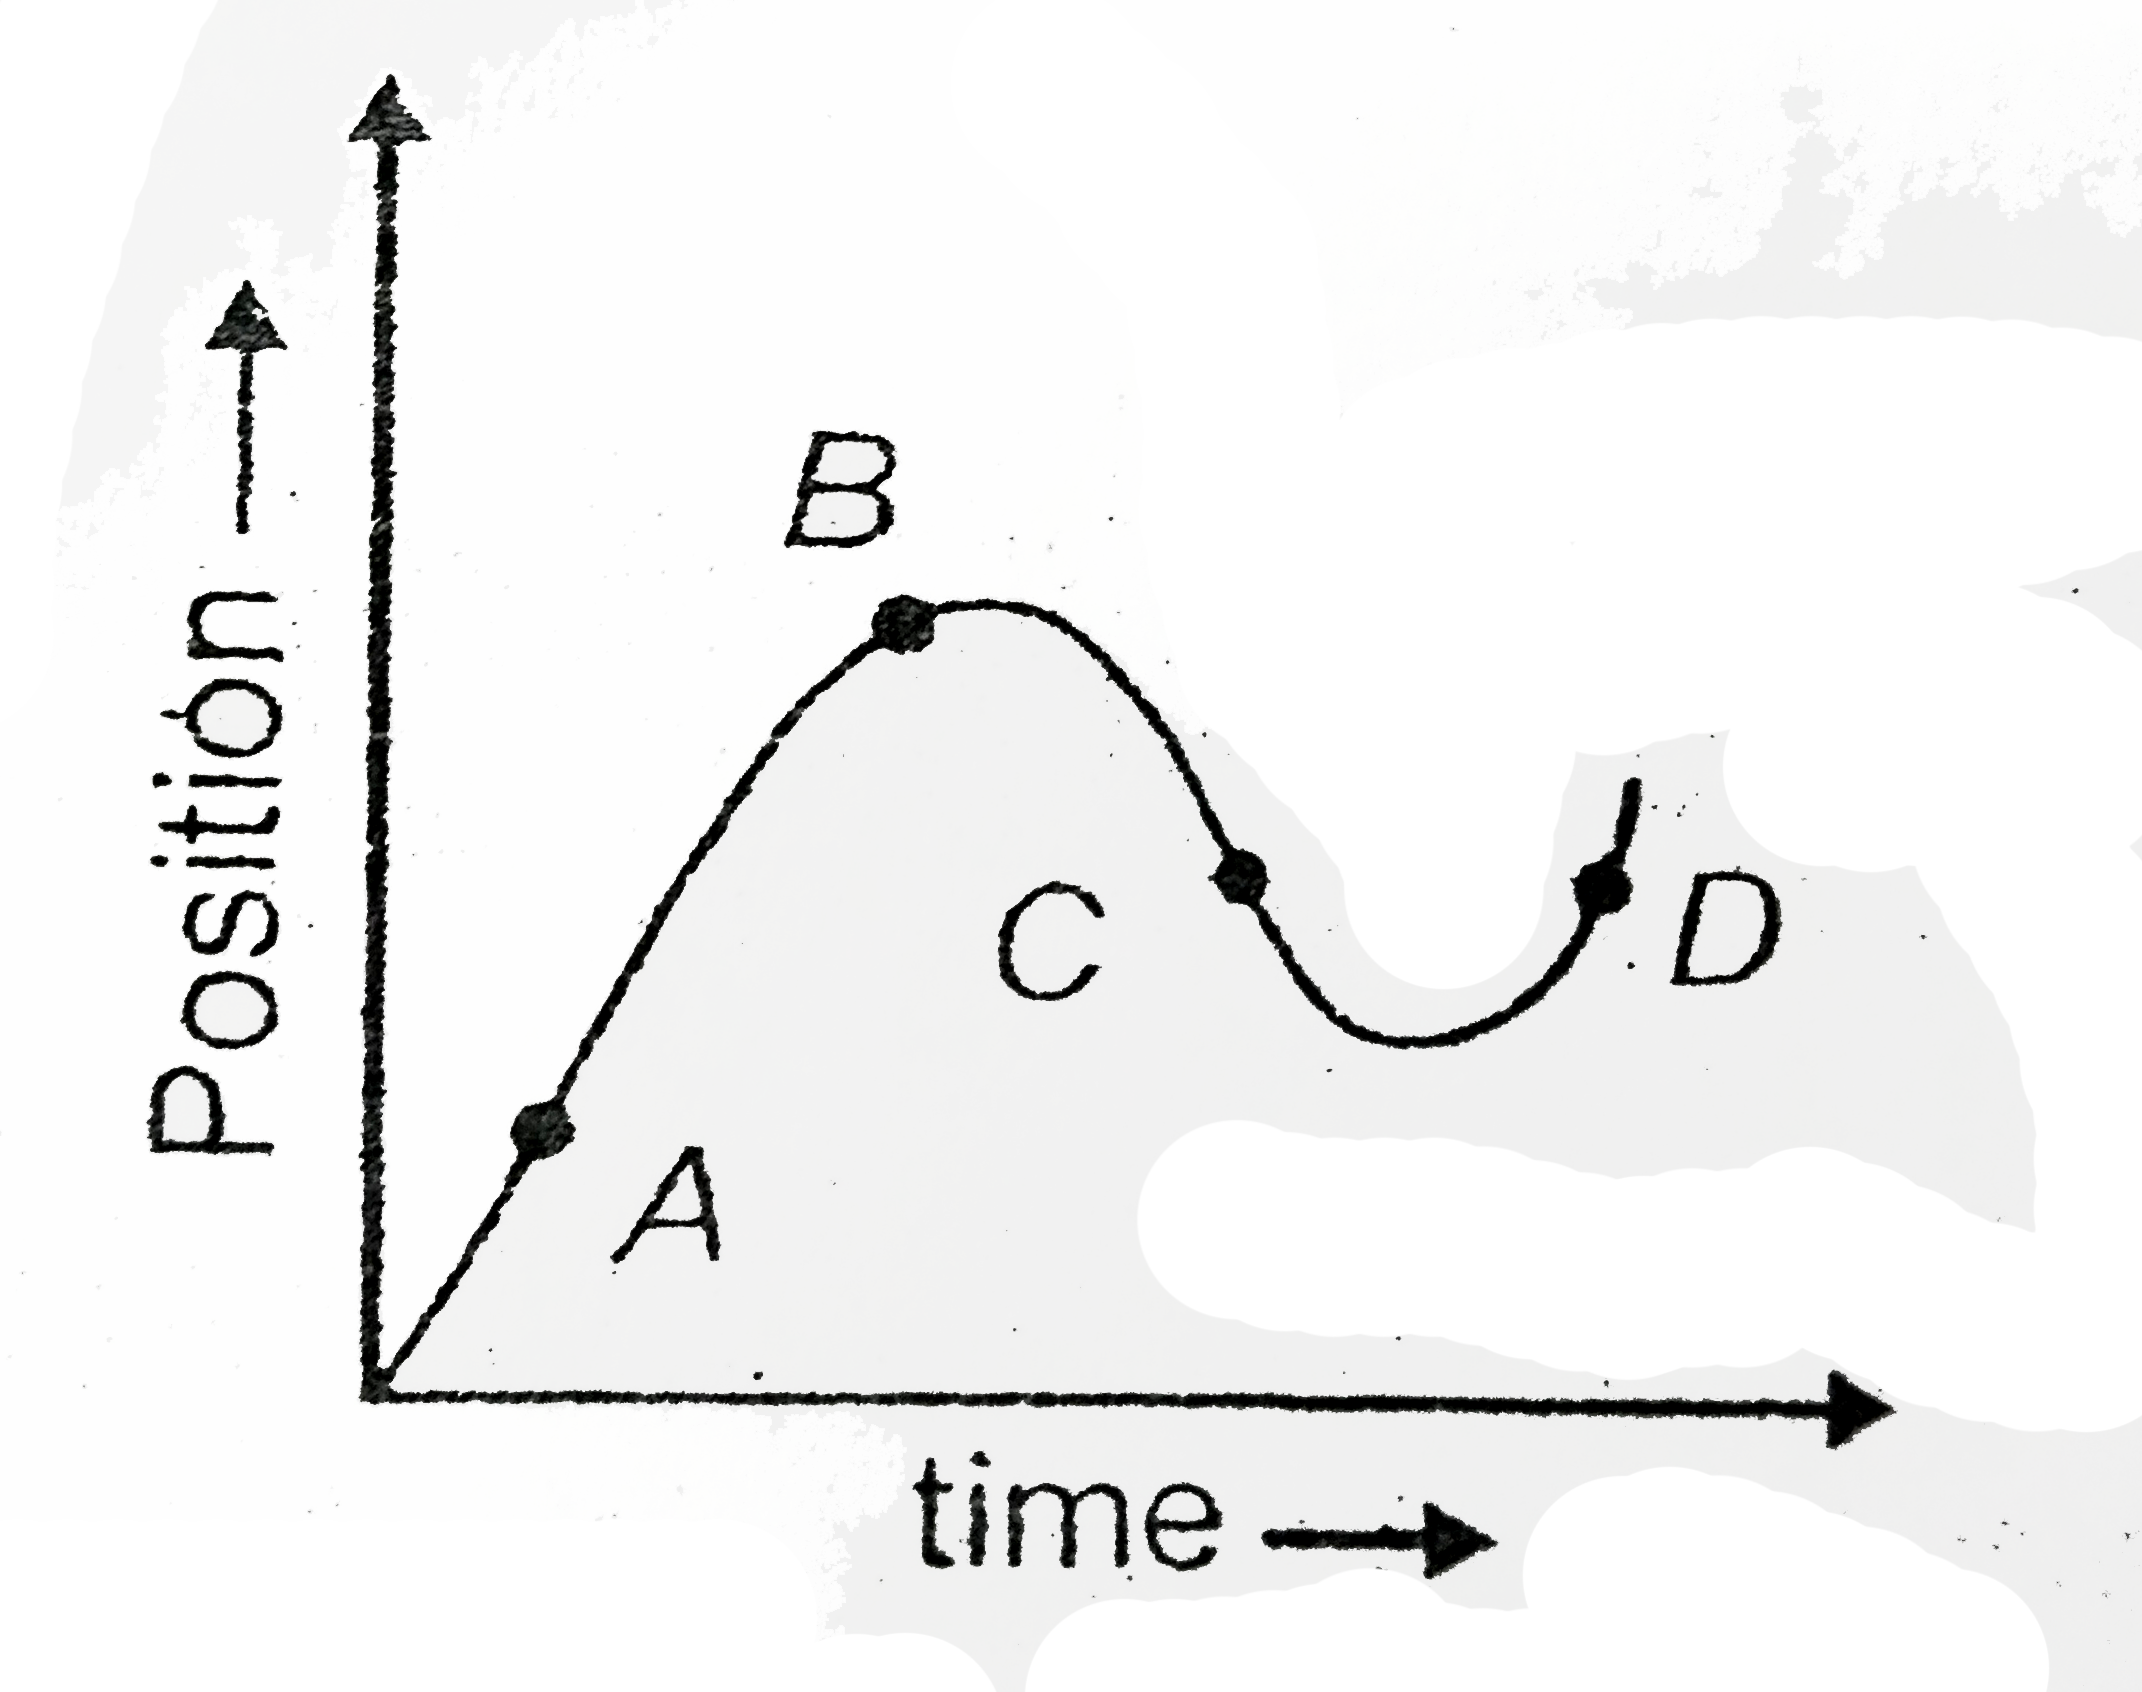
The position-time graph of a moving particle is a shown. The instantaneous velocity of the particle is negative at the point.
 View Solution
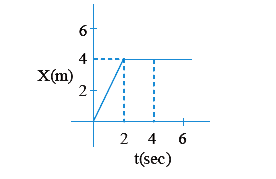
In the figure, the position time graph of a particle of mass 0.1 kg is shown. The impulse at t=2 second is :
 View Solution
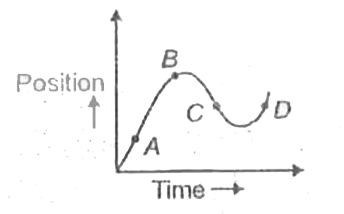
The position versus time graph of a particle moving along a straight line is shown. What is the total distance travelled by the particle from t=0s to t=10s?View SolutionThe position- time graph of a moving particle is shown. The instantaneous velocity of the particle is negative at the point
 View Solution
The acceleration versus time graph of a particle is shown in the figure. The respective v−t graph of the particle is .
 .View Solution
