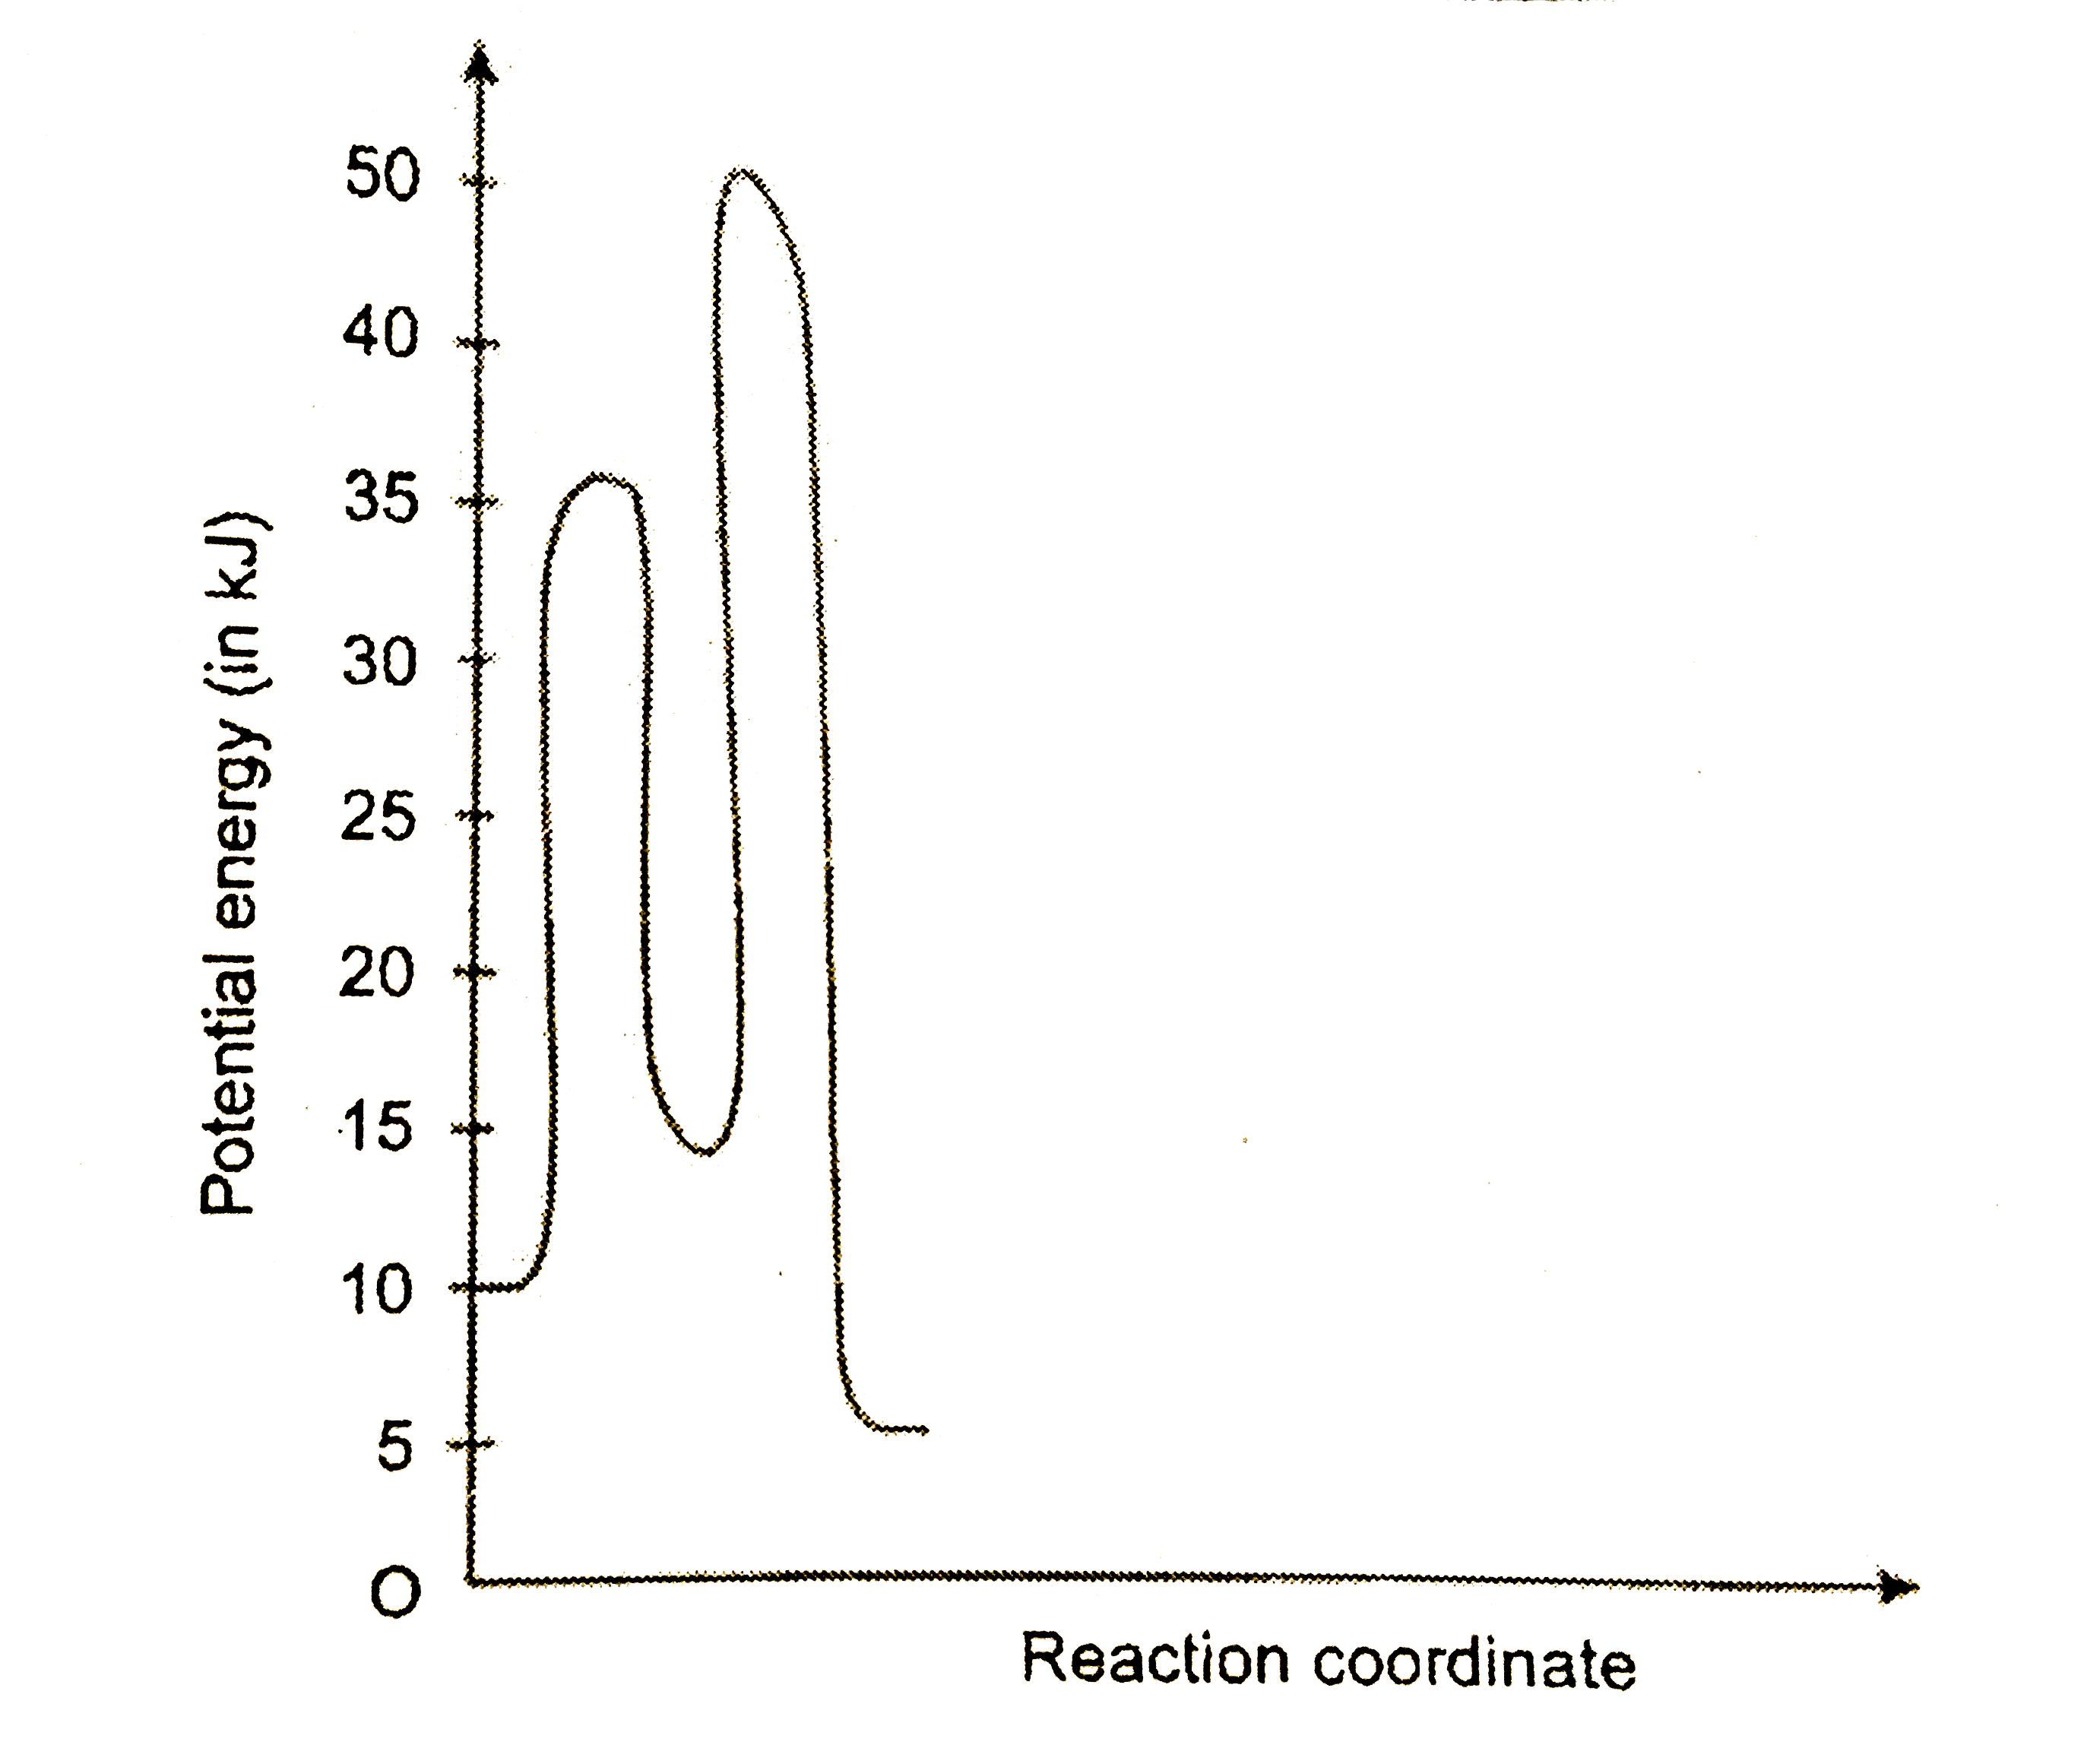
The diagram illustrates energy changes in an enzyme controlled reaction.
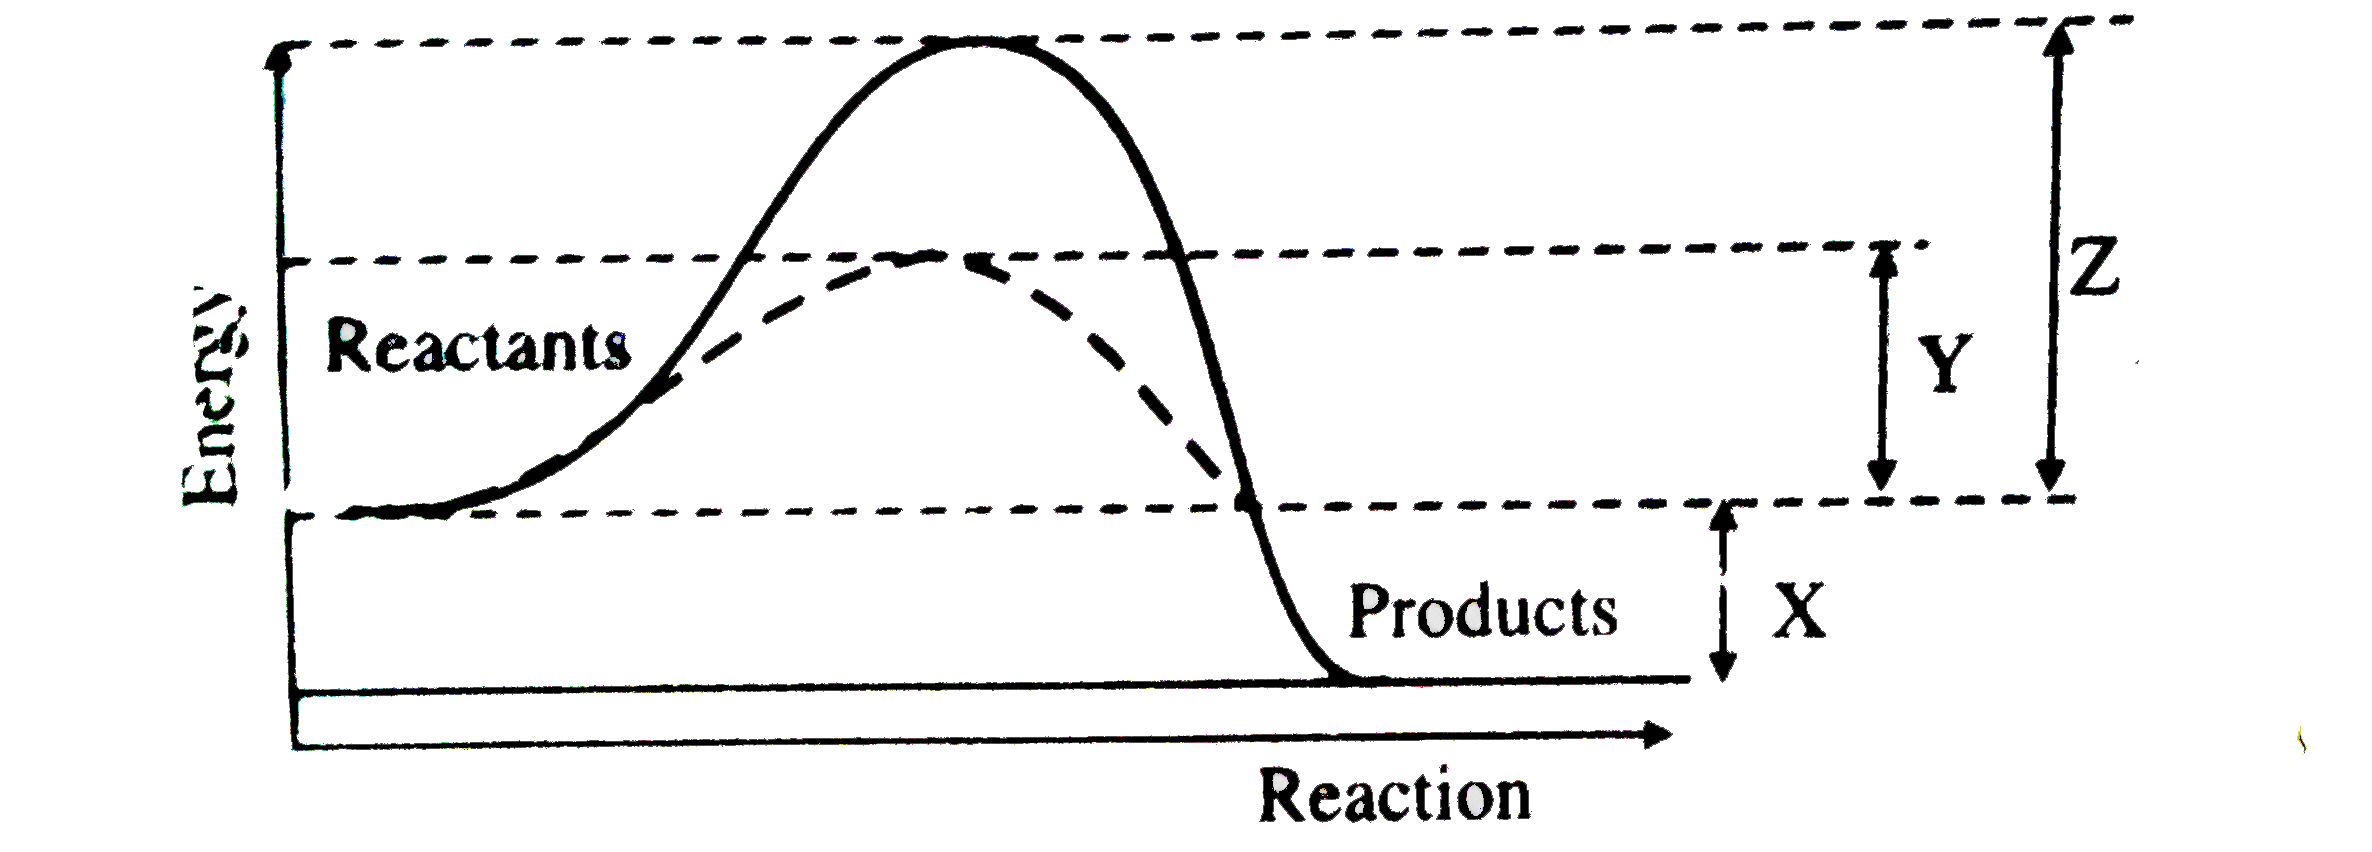
X
Y
Z
Z-Y
The correct Answer is:D
Topper's Solved these Questions
- BOOK - A2ZCHAPTER - BIOMOLECULESEXERCISE - Section -c Previous Years Examination Questions (assertion And Reason Type Questions)8videos
BIOMOLECULES
- BOOK - A2ZCHAPTER - BIOMOLECULESEXERCISE - Section D: Chapter End Test50videos
BIOMOLECULES
- BOOK - A2ZCHAPTER - BIOMOLECULESEXERCISE - Section -c Previous Years Examination Questions (neet/aipmt Questions)116videos
BIOMOLECULES
- BOOK - A2ZCHAPTER - BIOLOGICAL CLASSIFICATIONEXERCISE - Mock Test Assertion - Reasoning Question5videos
BIOLOGICAL CLASSIFICATION
- BOOK - A2ZCHAPTER - BODY FLUIDS AND CIRCULATION EXERCISE - Section D: Chapter-end Test50videos
BODY FLUIDS AND CIRCULATION
Similar Questions
Knowledge Check
- Question 1 - Select One
The given diagram illustrates
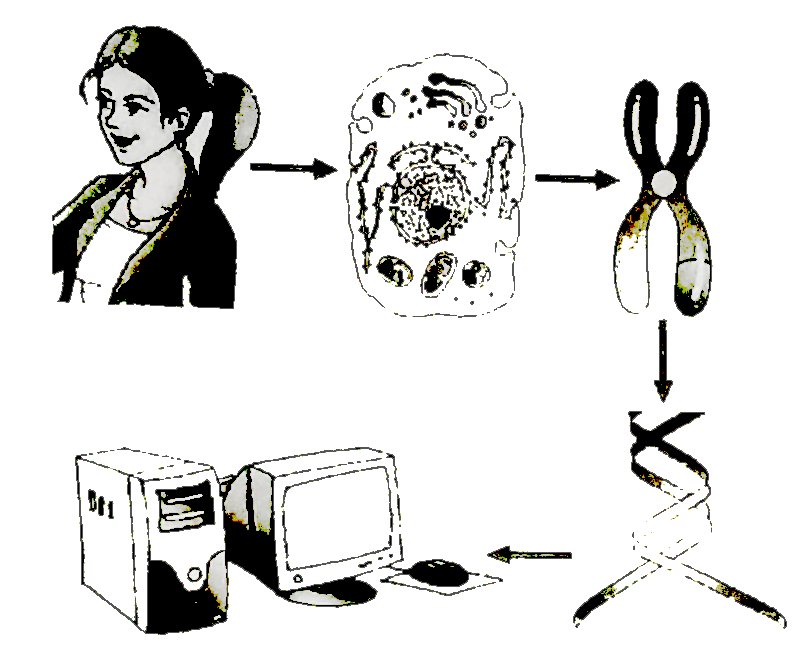 AChromosome walkingBHomoral AnalysisCHuman Genome ProjectDMethod of DNA fingerprinting
 - Question 2 - Select One
Given diagram illustrates the changes that occur when a plant cell takes up water Identify L,Mand N and select the incorrect statement the given diagram
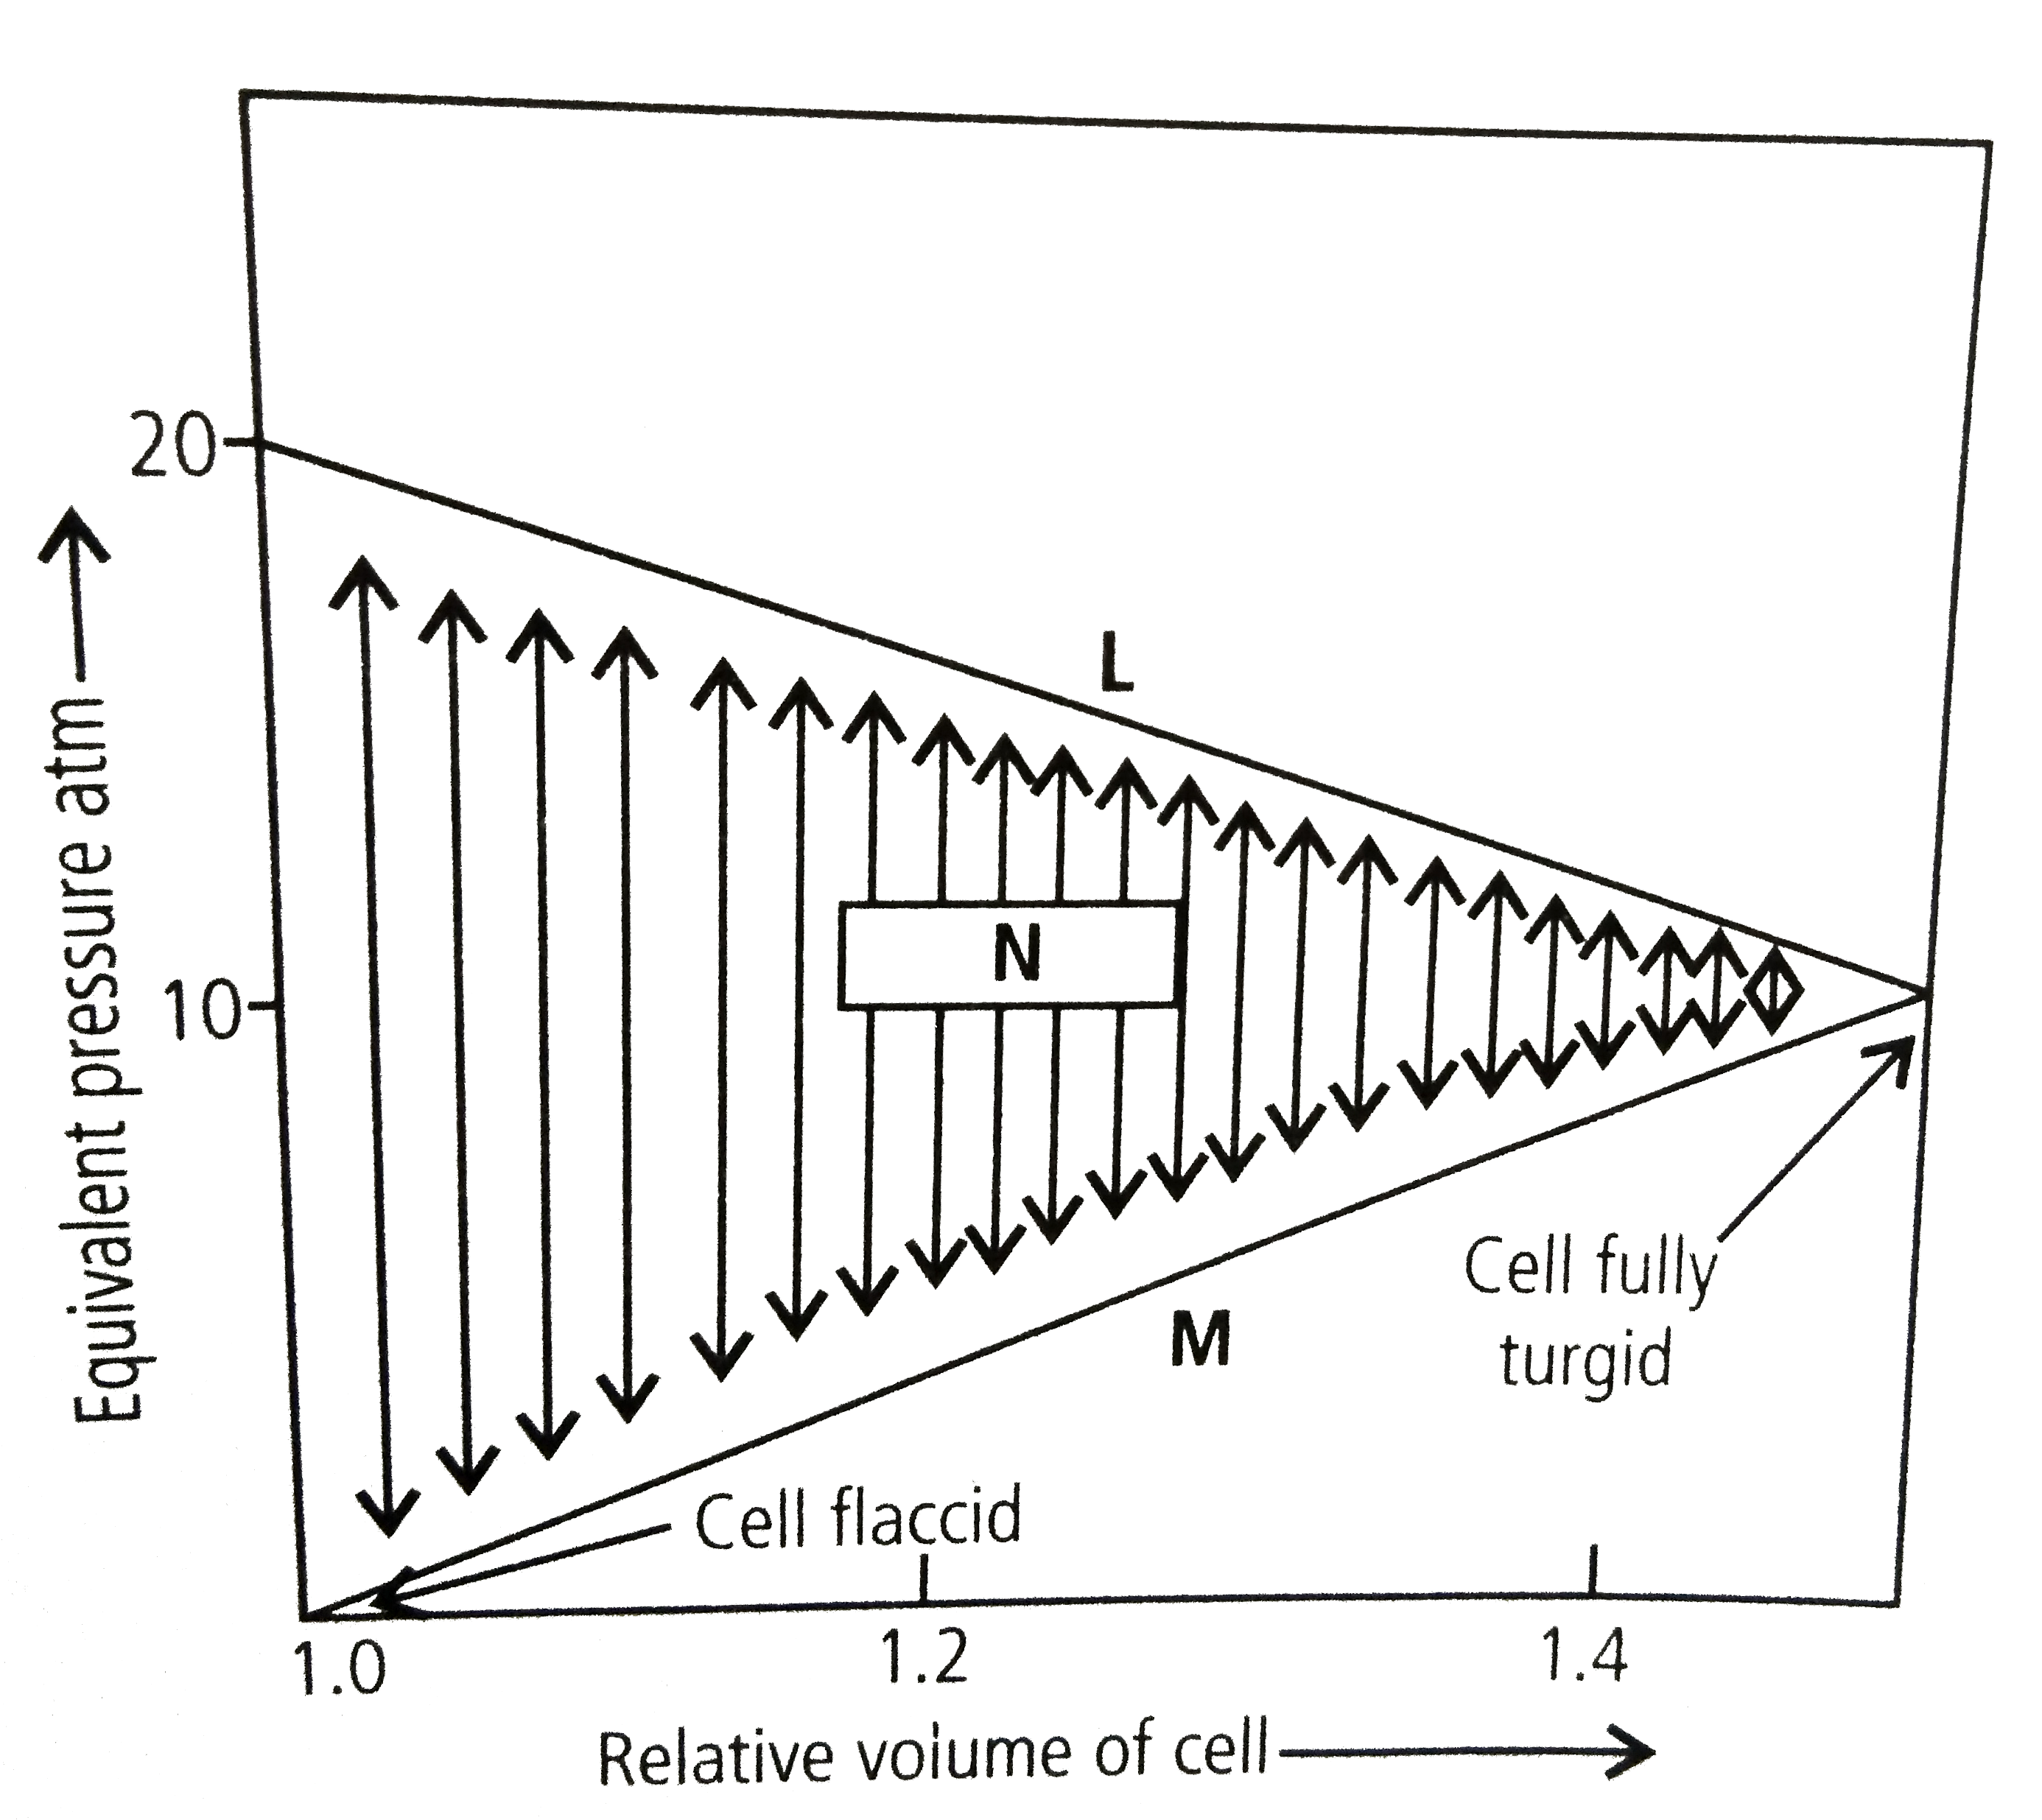 AN is the diffusion pressure deficit which becomes zero when LandM re equal in magnitude.BIn a flaccid cell value of N becomes equal to that of LCMrepresents osmotic pressure which increases when a flaccid cell takes up water.DL represents solute potential which decreases with the increase in turgidity of the cell .
 - Question 3 - Select One
Given diagram illustrates the changes that occur when a plant cell takes up water Identify L,Mand N and select the incorrect statement the given diagram
 AN is the diffusion pressure deficit which becomes zero when LandM re equal in magnitude.BIn a flaccid cell value of N becomes equal to that of LCMrepresents osmotic pressure which increases when a flaccid cell takes up water.DL represents solute potential which decreases with the increase in turgidity of the cell .
The following diagram represents the energy profile diagram for a two-step reaction. Calculate the ratio of change in heat energy involved in step I to step II.
 View Solution
The given diagram illustrates human heart.
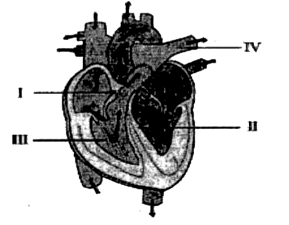
Which labelled structure in the diagram illustrates bundle of His?View SolutionThe Gibbs energy change and standard Gibbs energy change for a reaction are same if the reaction quotient Q has value equal to :
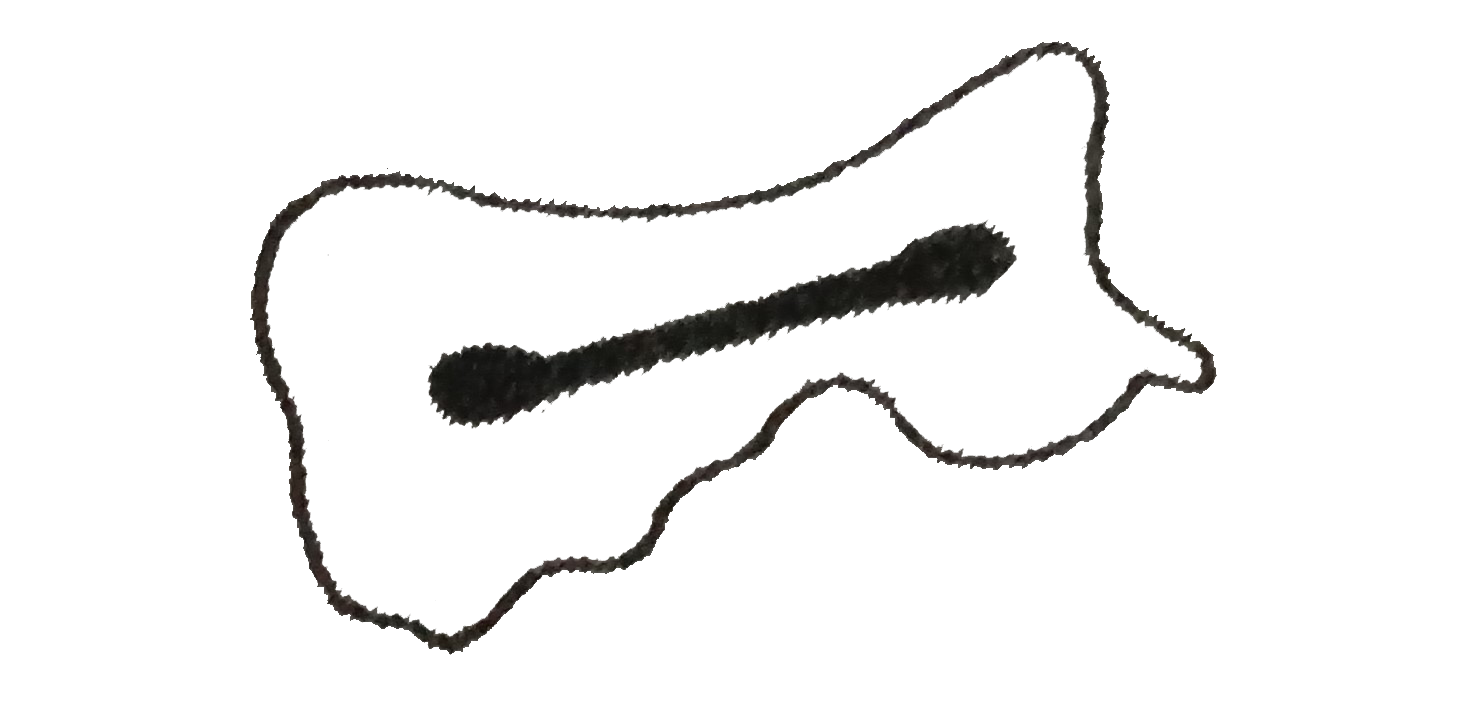
View SolutionThe diagram given alongside illustrates:
 View Solution
An exothermic chemical reaction proceeds by two stages reactants Stage I−−−→intermdediateStage II−−−→ products, The activation energy of stage I is 50kJmol−1. The overall enthalpy change of the reaction is −100kJ mol−1. Which diagram could represent the energy level diagram for the reaction ?
View Solution


