Figure given below shows three velocity-substrate concentration curves for an enzyme reaxtion. What do the curves for an enzyme reaction. What do the curves depict
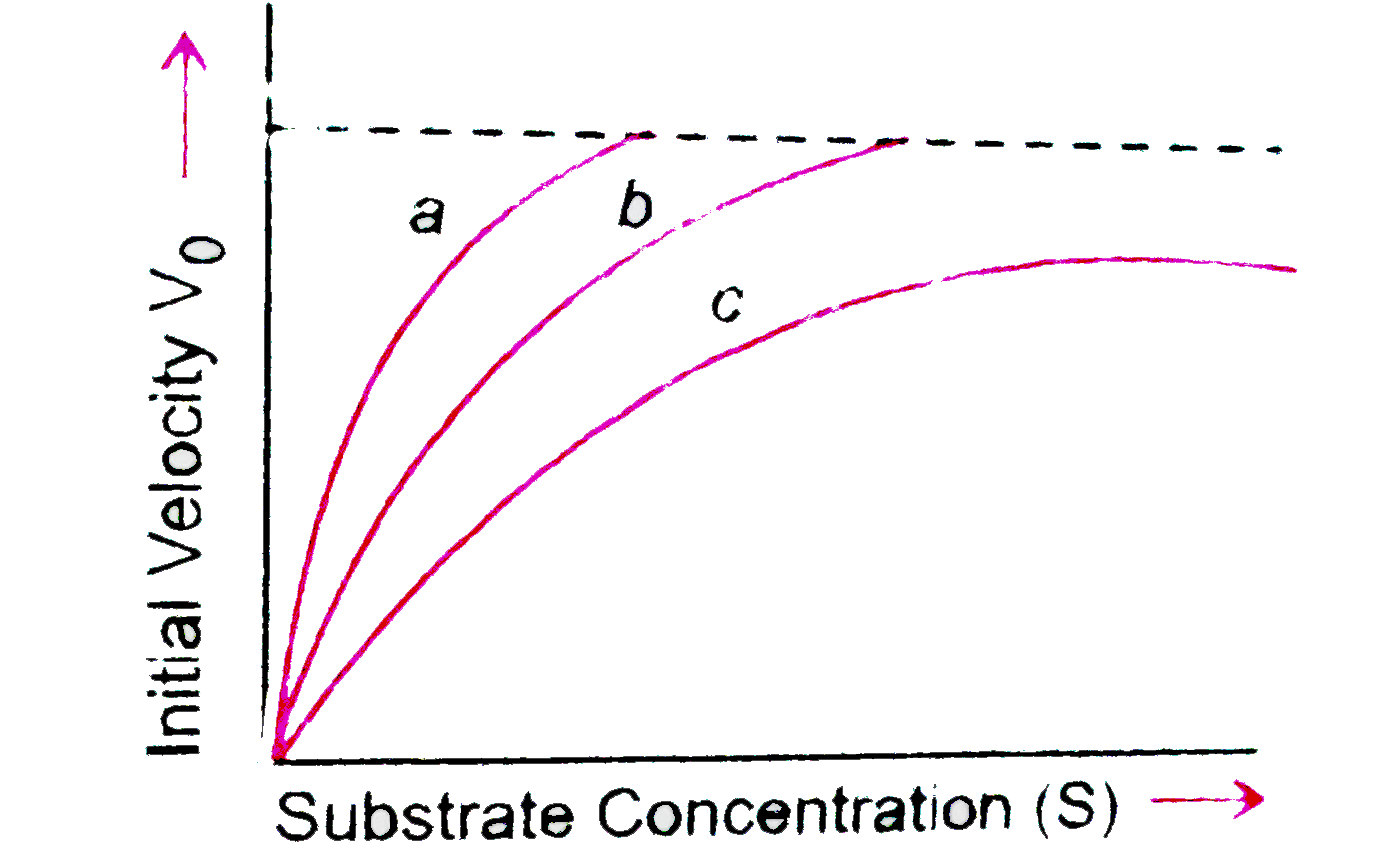
a- normal enzyme reaction
b- competitive inhibition
c- non-competitive inhibition
a-enzyme with an allosteric modulator-added
b-normal enzyme acitivity
c- competitive inhibition
a-enzyme with an allosteric stimulator
b- competitve inhibitor added
c- normal enzyme reaction
a-normal enzyme reaction
b-non-competitive inhibitor added
c- allosteric inhibitor added
The correct Answer is:A
Step by step video, text & image solution for Figure given below shows three velocity-substrate concentration curves for an enzyme reaxtion. What do the curves for an enzyme reaction. What do the curves depict by Biology experts to help you in doubts & scoring excellent marks in Class 11 exams.
Topper's Solved these Questions
- BOOK - A2ZCHAPTER - BIOMOLECULESEXERCISE - Section -c Previous Years Examination Questions (assertion And Reason Type Questions)8videos
BIOMOLECULES
- BOOK - A2ZCHAPTER - BIOMOLECULESEXERCISE - Section D: Chapter End Test50videos
BIOMOLECULES
- BOOK - A2ZCHAPTER - BIOMOLECULESEXERCISE - Section -c Previous Years Examination Questions (neet/aipmt Questions)116videos
BIOMOLECULES
- BOOK - A2ZCHAPTER - BIOLOGICAL CLASSIFICATIONEXERCISE - Mock Test Assertion - Reasoning Question5videos
BIOLOGICAL CLASSIFICATION
- BOOK - A2ZCHAPTER - BODY FLUIDS AND CIRCULATION EXERCISE - Section D: Chapter-end Test50videos
BODY FLUIDS AND CIRCULATION
Similar Questions
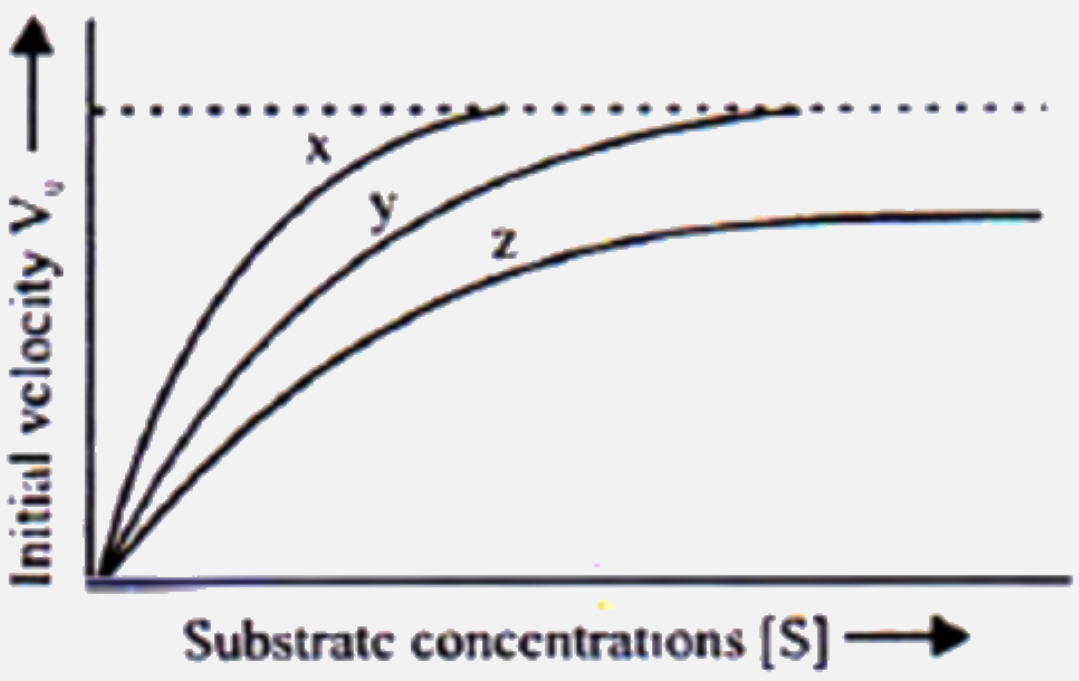
The Given figure shows three velocity-substrate concentration curves of an enzyme reaction. What do the curves X Y and Z depict respectively ?
 View Solution
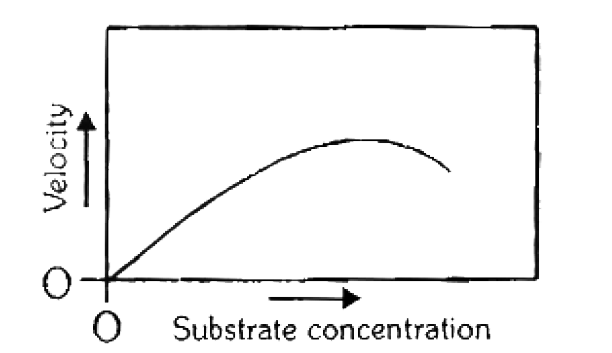
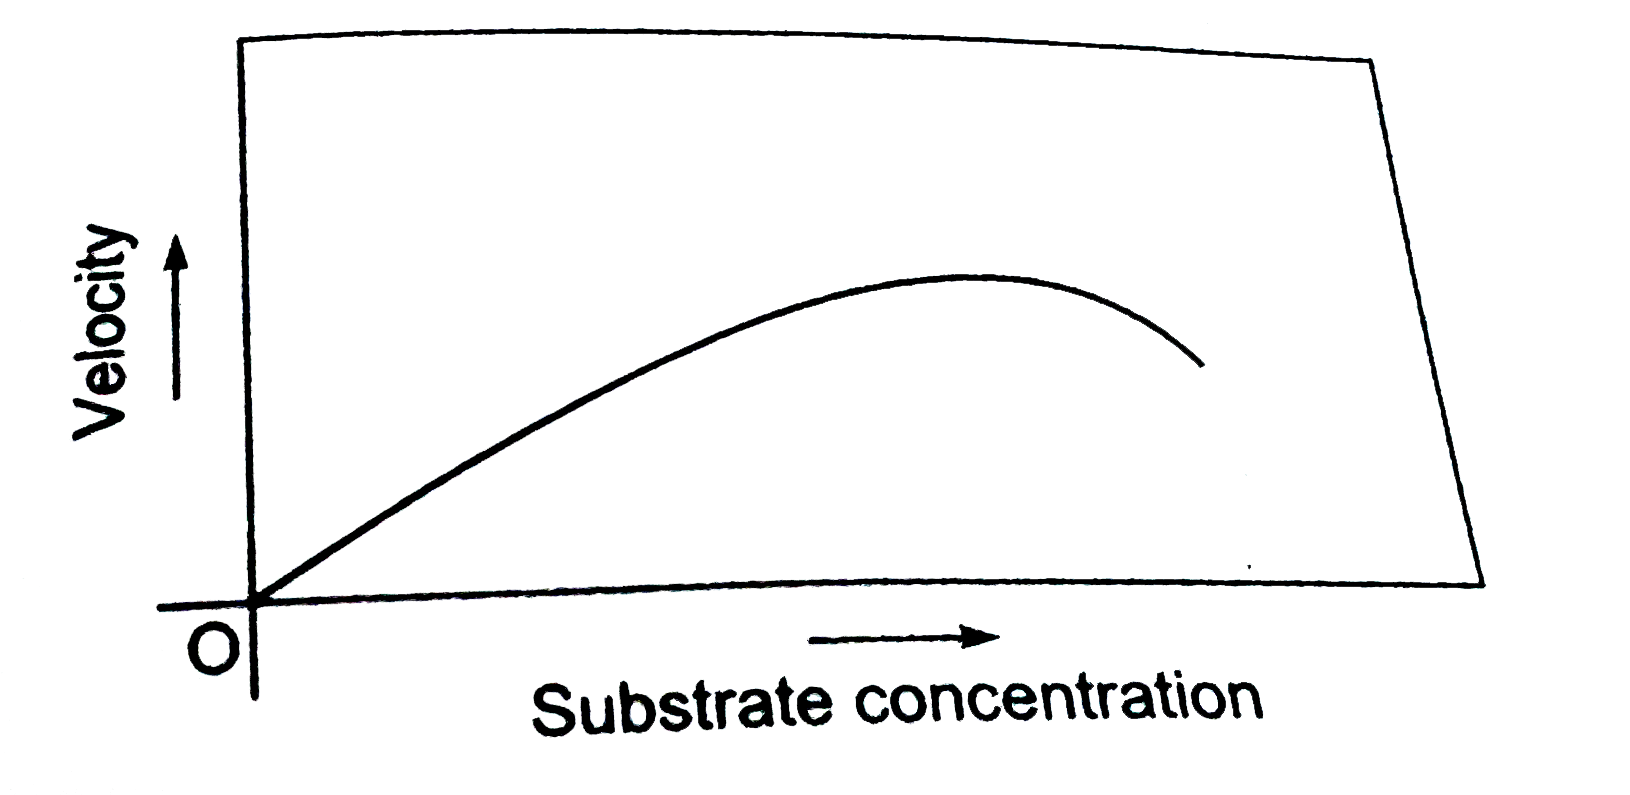
The graph given below shows the effect of substrate concentration on the rate of reaction of the enzyme green-gram-phosphatase What does the graph indicates?
 View Solution
Knowledge Check
- Question 1 - Select One
The given figure shows three velocity-substrate concentration curves for an enzyme reaction. What do the curves x, y and z depict respectively?
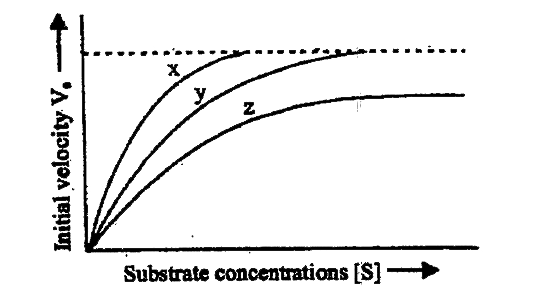 Ax-normal enzyme reaction, y-competitive inhibition, z-non-competitive inhibitionBx-enzyme with an allosteric modulator added, y-normal enzyme activity, 2-competitive inhibitionCX-enzyme with an allosteric stimulator, y-competitive inhibition added z-normal enzyme reactionDx-normal enzyme reaction, y-non-competitive inhibitor added z-allosteric inhibitor added
 - Question 2 - Select One
What enzymes do for a biochemical reaction
AAlter its rateBAlter its patternCAlter bothDNone of the above - Question 3 - Select One
The given graph shows the effect of substrate concentration on the rate of reaction of the enzyme green gram-phosphatase

What dose the graph indicateAThe rate of enzyme reaction is directly proportional to the substrate concentrationBPresence of an enzyme inhibitor in the reaction mixtureCFormation of an enzyme-substrate complexDAt higher substrate concentration the pH increase
The substrate concentration at which the chemical reaction catalyzed by an enzyme attains half of its maximum velocity is termed as
View SolutionThe given graph shows the effect of substrate concentration on the rate of reaction of the enzyme green-gram-phosphatase What does the graph indicate?
View SolutionThe given graph shows the effect of substrate concentration on the rate of reaction of the enzymes green gram-phosphatase. What does the graph indicate ?
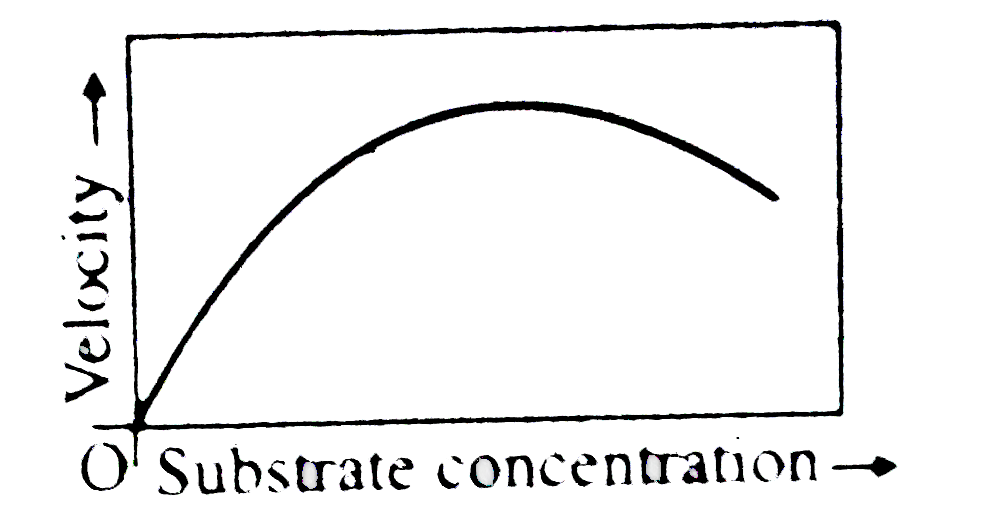 View Solution
the graph given in Fig.9.36 shows the effect of substrate concentration on the rate of reaction of the enzyme green-gram -phosphatase . What does the graph indicates ?
 View Solution
The figure given below shows the conversion of a substrate into product by an enzyme. In which one of the four options (a-d) the components of reaction labelled as A, B, C and D are identified correctly
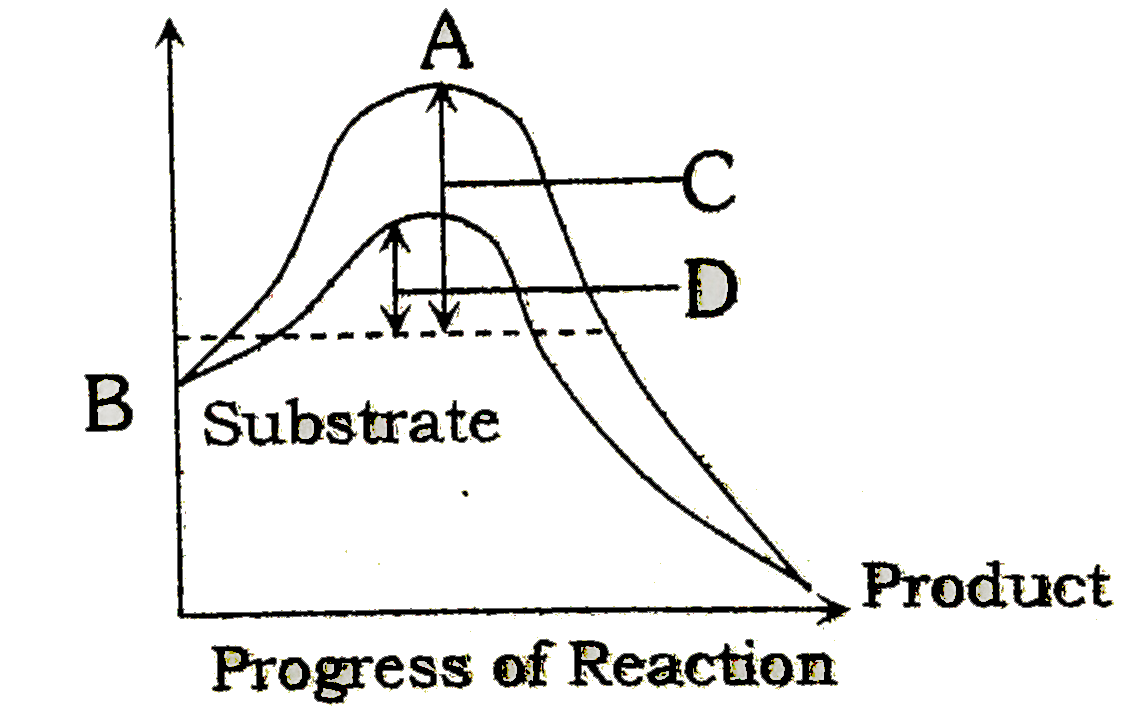 View Solution
