Reading of pie chart for the % wise distribution of lectures in different subjects
Step by step video & image solution for Reading of pie chart for the % wise distribution of lectures in different subjects by Maths experts to help you in doubts & scoring excellent marks in Class 14 exams.
Updated on:21/07/2023Similar Questions
Knowledge Check
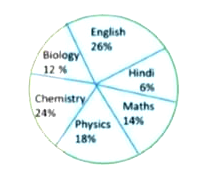
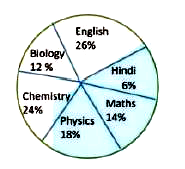
The pie-chart shows percentage wise distribution of teachers who teach six different subjects. Study the pie chart and answer the question :

Total number of teachers =1650
What is the difference between the total number of teachers who teach Physics and Maths and the total number of teachers who tech chemistry and biology ?Aa) 60Bb) 76Cc) 66Dd) 68
Reading of a pie chart for the ratio of 2 mobile phones in different months
View Solution(Questions 10-14): Study the following pie-chart and the table given below it carefully to answer the questions given below: Percentage-wise distribution of lecturers in 6 different subjects in a university total number of lecturers: 1600 Ratio of male to female lecturers
Lecturers Males : Females Mathematics 3 : 4 Education 5 : 3 Hindi 1 : 3
Chemistry 1 : 7
Physics 9 : 5
Zoology 7 : 9
Total number of lecturers (both male and female) in Hindi is approximately what per cent of the total number of female lecturers in Mathematics and Chemistry together?
(a) 58 (b) 43 (c) 47 (d) 51 (e) 50
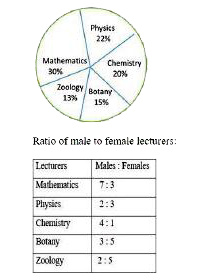
View SolutionStudy the given pie-chart and table carefully and answer the question that follows. The percentage wise distribution of lecturers in five different subjects in a university is shown in the pie-chart. The total number is 500.
दिए गए पाई-चार्ट और तालिका का सावधानीपूर्वक अध्ययन करें और उसके बाद प्रश्नों का उत्तर दें। एक विश्वविद्यालय में पांच अलग-अलग विषयों में व्याख्याताओं का प्रतिशतवार वितरण पाई-चार्ट में दिखाया गया है। कुल संख्या 500 है। Ratio of male to female lecturers:
महिला व्याख्याताओं और पुरुष व्याख्याताओं का अनुपात: Find the number of male lecturers in Physics.
भौतिकी में पुरुष व्याख्याताओं की संख्या ज्ञात कीजिए।
View SolutionStudy the given pie-chart and table carefully and answer the question that follows. The percentage-wise distribution of lecturers in five different subjects in a university is shown in the pie-chart. The total number of lecturers is 500.

Find the number of male lecturers in Physics.
View SolutionStudy the pie-chart and the table carefully and answer the questions that follow. The percentage distribution of lecturers in five different subjects in a university is shown in the pie-chart. The total number of lecturers is 500.
पाई-चा्ट और तालिका का ध्यानपूर्वक अध्ययन करें और आने वाले प्रश्नों के उत्तर दें। एक विश्वविद्यालय में पांच अलग-अलग विषयों में व्याख्याताओं का प्रतिशत वितरण पाई-चार्ट में दिखाया गया है। व्याख्याताओं की कुल संख्या 500 है। Ratio of male to female lecturers:
महिला व्याख्याताओं और पुरुष व्याख्याताओं का अनुपात: What is the difference in the number of female lecturers in chemistry and Mathematics?
रसायन विज्ञान और गणित में महिला व्याख्याताओं की संख्या में क्या अंतर है?
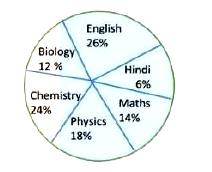
View SolutionThe pie-chart shows percentage wise distribution of teachers who teach six different subjects. Study the pie chart and answer the question:

Total number of teachers = 1650
What is the total number of teachers teaching English. Maths and Physics?
View SolutionThe pie chart shows percentage wise distribution of teachers who teach six different subjects. Study the pie chart and answer the question.

Total number of teachers = 1650
What is the difference between the total number of teachers who teach Physics and Maths and the total number of teachers who teach chemistry and biology?
View Solution
